FXOpen

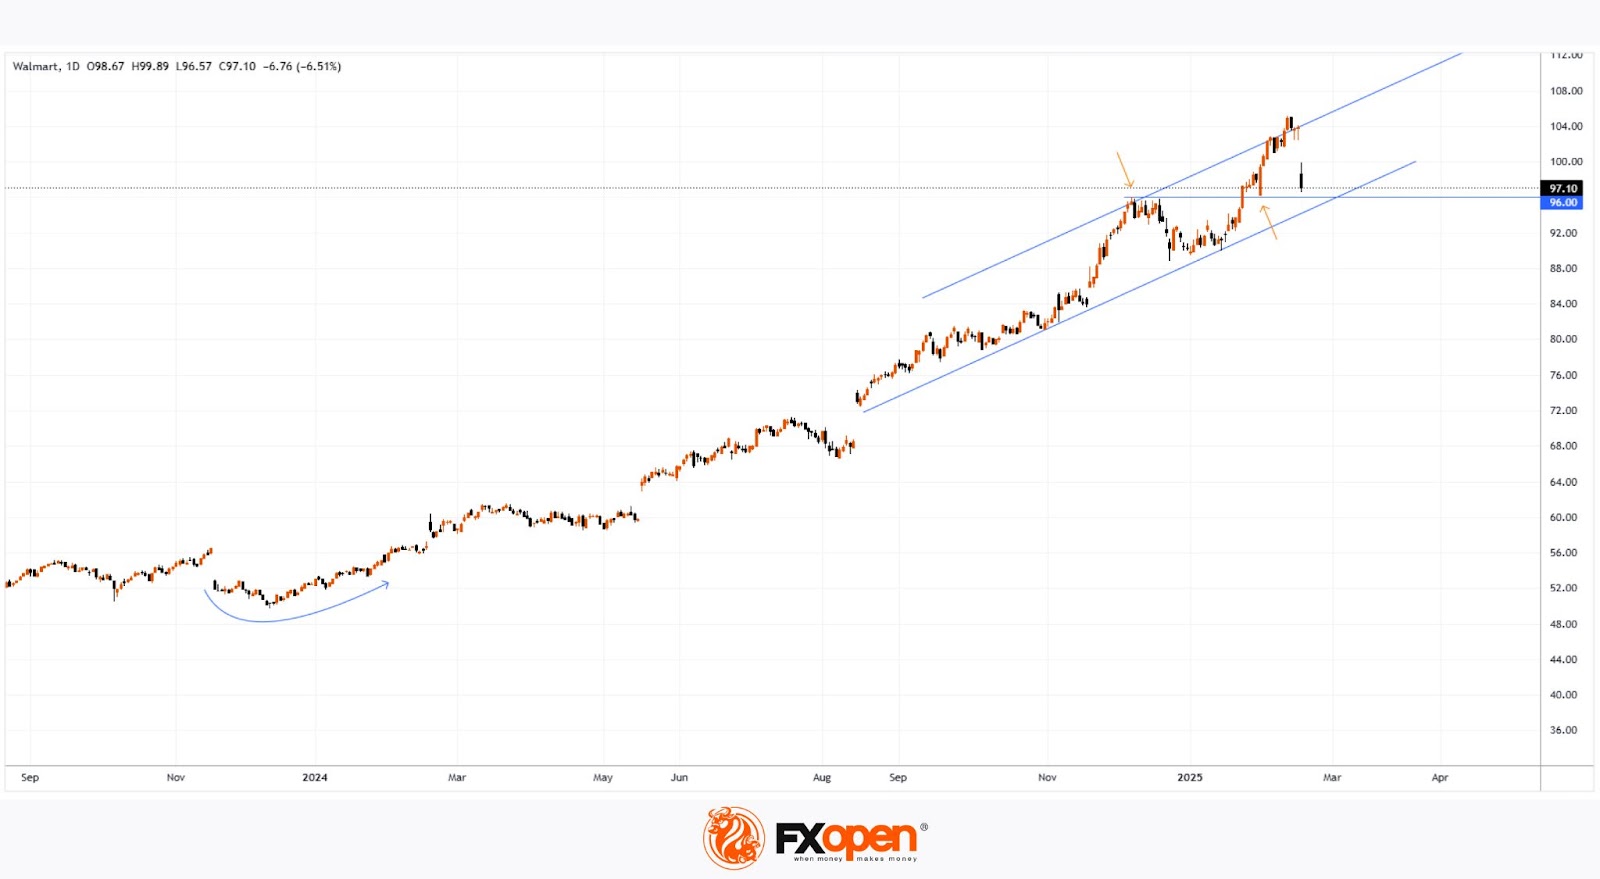
As shown in the Walmart (WMT) stock chart, trading on 20th February closed at $97.26, whereas the previous day, the stock was trading around $103. The decline of over 6% marks the largest drop in Walmart (WMT) stock price in 15 months.
Why Did Walmart (WMT) Stock Drop?
The bearish momentum emerged after Walmart’s earnings report, which was actually quite strong, as:
→ Sales growth reached 5.2%;
→ The company exceeded analysts' expectations (earnings per share were 2% higher than forecasts);
→ Walmart announced a 13% dividend increase.
However, WMT stock fell because the retail giant released a profit forecast for 2025 that came in below market expectations. This was attributed to uncertain consumer behaviour and geopolitical conditions. Additionally, investors may have been dissatisfied with increased executive compensation.
Walmart (WMT) Stock Technical Analysis
The chart shows that after the decline, the price is consolidating near support levels formed by:
→ The lower boundary of the ascending channel;
→ Former resistance around $96.
The situation resembles November 2023, when the market also reacted negatively to an earnings report. However, WMT stock later recovered, and a similar scenario could unfold in 2025.
Analytical Walmart (WMT) Stock Price Forecasts
Analysts remain optimistic. According to Yahoo Finance:
→ The average 12-month price target for WMT is $107.25;
→ Of the 42 analysts surveyed, 38 recommend buying WMT stock.
Buy and sell stocks of the world's biggest publicly-listed companies with CFDs on FXOpen’s trading platform. Open your FXOpen account now or learn more about trading share CFDs with FXOpen.
This article represents the opinion of the Companies operating under the FXOpen brand only. It is not to be construed as an offer, solicitation, or recommendation with respect to products and services provided by the Companies operating under the FXOpen brand, nor is it to be considered financial advice.
Stay ahead of the market!
Subscribe now to our mailing list and receive the latest market news and insights delivered directly to your inbox.


Latest articles
Natural Gas Prices Rise Amid Middle East Conflict
The recent strike by Israel and the US, along with Iran’s retaliatory actions, has pushed energy asset prices higher. Yesterday, we reported on a bullish gap in oil markets, and while US natural gas prices have not surged as

The US Dollar Index (DXY) Climbs to a One-and-a-Half-Month High
Today, the US Dollar Index rose above the 98.70 level for the first time since the third week of January. Monday’s trading opened with a bullish gap, and upward momentum continues to build as news emerges of a