


Walmart (WMT) Stock Drops Over 6%
FXOpen

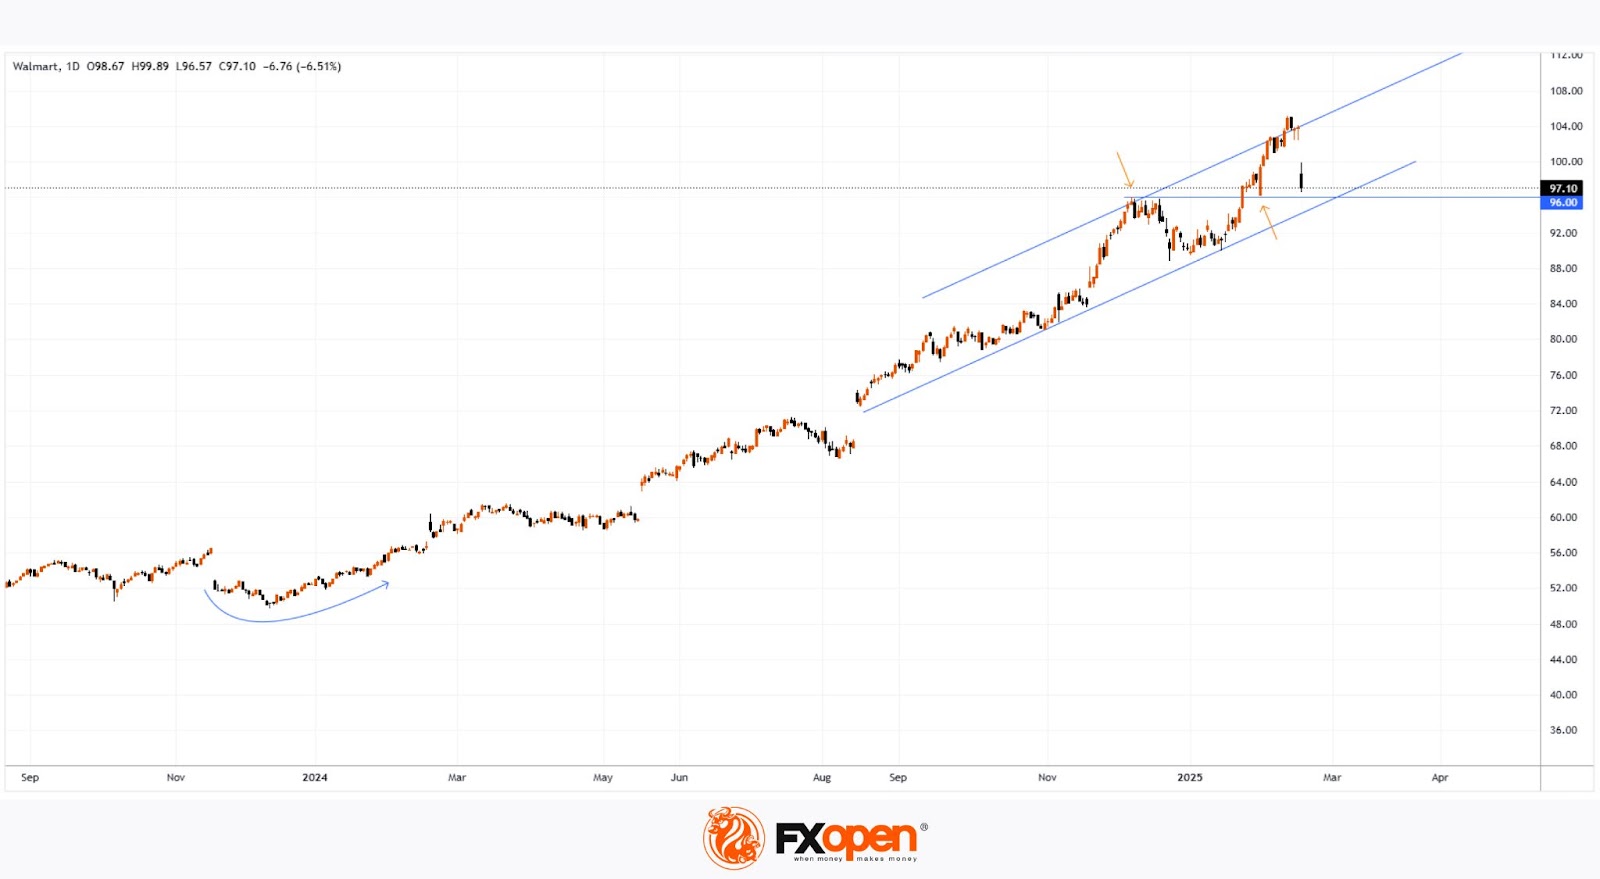
As shown in the Walmart (WMT) stock chart, trading on 20th February closed at $97.26, whereas the previous day, the stock was trading around $103. The decline of over 6% marks the largest drop in Walmart (WMT) stock price in 15 months.
Why Did Walmart (WMT) Stock Drop?
The bearish momentum emerged after Walmart’s earnings report, which was actually quite strong, as:
→ Sales growth reached 5.2%;
→ The company exceeded analysts' expectations (earnings per share were 2% higher than forecasts);
→ Walmart announced a 13% dividend increase.
However, WMT stock fell because the retail giant released a profit forecast for 2025 that came in below market expectations. This was attributed to uncertain consumer behaviour and geopolitical conditions. Additionally, investors may have been dissatisfied with increased executive compensation.
Walmart (WMT) Stock Technical Analysis
The chart shows that after the decline, the price is consolidating near support levels formed by:
→ The lower boundary of the ascending channel;
→ Former resistance around $96.
The situation resembles November 2023, when the market also reacted negatively to an earnings report. However, WMT stock later recovered, and a similar scenario could unfold in 2025.
Analytical Walmart (WMT) Stock Price Forecasts
Analysts remain optimistic. According to Yahoo Finance:
→ The average 12-month price target for WMT is $107.25;
→ Of the 42 analysts surveyed, 38 recommend buying WMT stock.
Buy and sell stocks of the world's biggest publicly-listed companies with CFDs on FXOpen’s trading platform. Open your FXOpen account now or learn more about trading share CFDs with FXOpen.
This article represents the opinion of the Companies operating under the FXOpen brand only. It is not to be construed as an offer, solicitation, or recommendation with respect to products and services provided by the Companies operating under the FXOpen brand, nor is it to be considered financial advice.
Stay ahead of the market!
Subscribe now to our mailing list and receive the latest market news and insights delivered directly to your inbox.


Latest articles

Weekly Market Insights with Gary Thomson: The Week of Central Banks and Earnings
In this video, we’ll explore the key economic events and market trends, shaping the financial landscape. Get ready for insights into financial markets to help you navigate the week ahead. Let’s dive in!
In this episode of Market

Intel at a Crossroads: Earnings Beat Meets Technical Resistance
Intel has just delivered its strongest quarter in over fifteen years, and the market reaction says it all. Q2 2026 revenue surged 25% year-over-year to $16.1 billion, crushing the consensus estimate of $14.42 billion, while adjusted EPS of

Tesla: Complex Range Structure Breaks Down Following Quarterly Earnings
Tesla released its Q2 2026 results after the market closed on 22 July. Revenue increased 26% year-on-year to $28.24 billion, while vehicle deliveries reached a record 480,126 units. However, operating margin fell sharply to 1.4%, down from