


FXOpen

On August 30, when the price of Berkshire Hathaway's Class B shares (BRK.B) surpassed $465, we noted that:
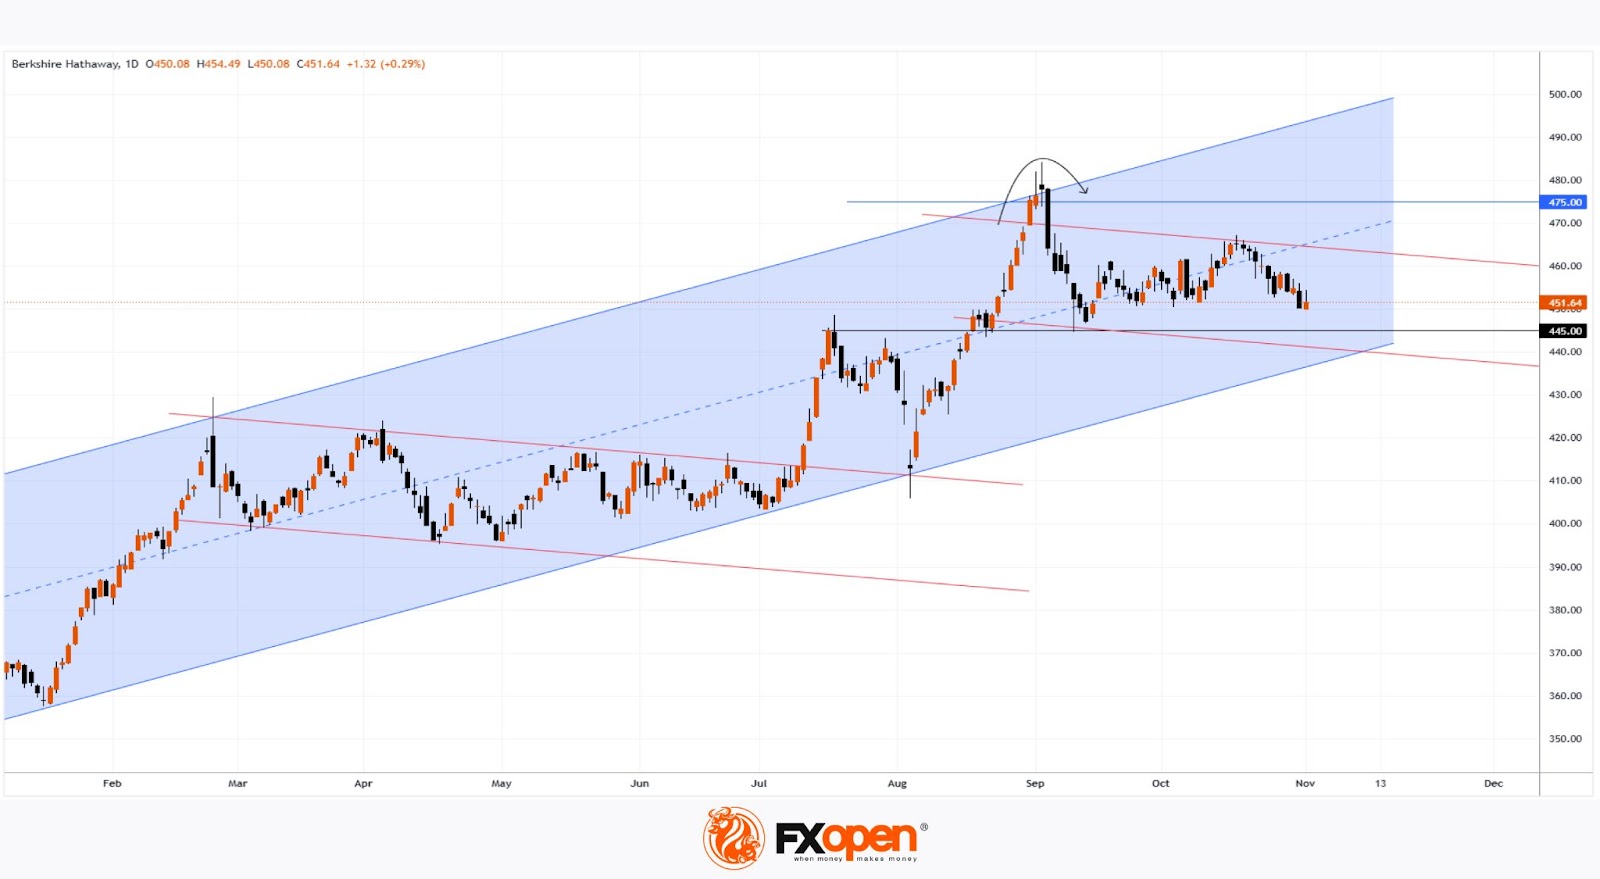
→ the stock was forming an ascending channel (shown in blue);
→ as the price neared $475, the likelihood of a slowdown in the bullish trend increased.
Since then (indicated by the arrow):
→ the price hit the upper channel boundary,
→ reversed downward after briefly exceeding $475,
→ and dropped to around $455 by November 1, when Warren Buffett’s Berkshire Hathaway reported Q3 earnings.
Analyst forecasts were close to the report’s actual figures:
→ Earnings per share: forecast = $4.9, actual = $4.7.
→ Revenue: forecast = $92.2 billion, actual = $92.9 billion.
→ Berkshire Hathaway’s investment income more than doubled year-over-year, reaching $3.5 billion for the quarter.
Meanwhile, some noteworthy news includes:
→ Berkshire significantly reduced its Apple (AAPL) holdings and refrained from new investments, even as stock indexes hover near historical highs.
→ Cash reserves reached a record $325 billion.
This has led to speculation that Buffett may believe:
→ stock prices are overvalued;
→ a market correction could be imminent.
Interestingly, Berkshire Hathaway is also holding off on buybacks—could Buffett be expecting a further price drop?
Technical analysis of the BRK.B chart suggests:
→ The price has fallen into the lower half of the blue channel, which remains relevant.
→ It’s possible that after a bearish reversal from $475 at the upper channel boundary, the stock has been in a correction phase since September (indicated by red lines), resembling the period from February 26 to July 10.
Traders may want to watch for demand around:
→ $445 (previous resistance in July),
→ the lower boundary of the ascending channel.
Buy and sell stocks of the world's biggest publicly-listed companies with CFDs on FXOpen’s trading platform. Open your FXOpen account now or learn more about trading share CFDs with FXOpen.
This article represents the opinion of the Companies operating under the FXOpen brand only. It is not to be construed as an offer, solicitation, or recommendation with respect to products and services provided by the Companies operating under the FXOpen brand, nor is it to be considered financial advice.
Stay ahead of the market!
Subscribe now to our mailing list and receive the latest market news and insights delivered directly to your inbox.


Latest articles

Market Analysis: GBP/USD Dips Further As EUR/GBP Regains Traction
GBP/USD failed to climb above 1.3500 and corrected some gains. EUR/GBP started a decent increase and might aim for more gains above 0.8700.
Important Takeaways for GBP/USD and EUR/GBP Analysis Today
· The British Pound


Market Insights with Gary Thomson: Oil, US Retail Sales & NFP in Focus
In this video, we’ll explore the key economic events and market trends, shaping the financial landscape. Get ready for insights into financial markets to help you navigate the week ahead. Let’s dive in!
In this episode of Market