


FXOpen

As the chart indicates, on Monday, the price of WTI crude oil rose by approximately 1%.
Reuters reports that the bullish sentiment is driven by:
→ the upcoming OPEC+ meeting scheduled for 2 June;
→ expectations of high fuel demand with the start of the summer driving season and holiday season in the US.
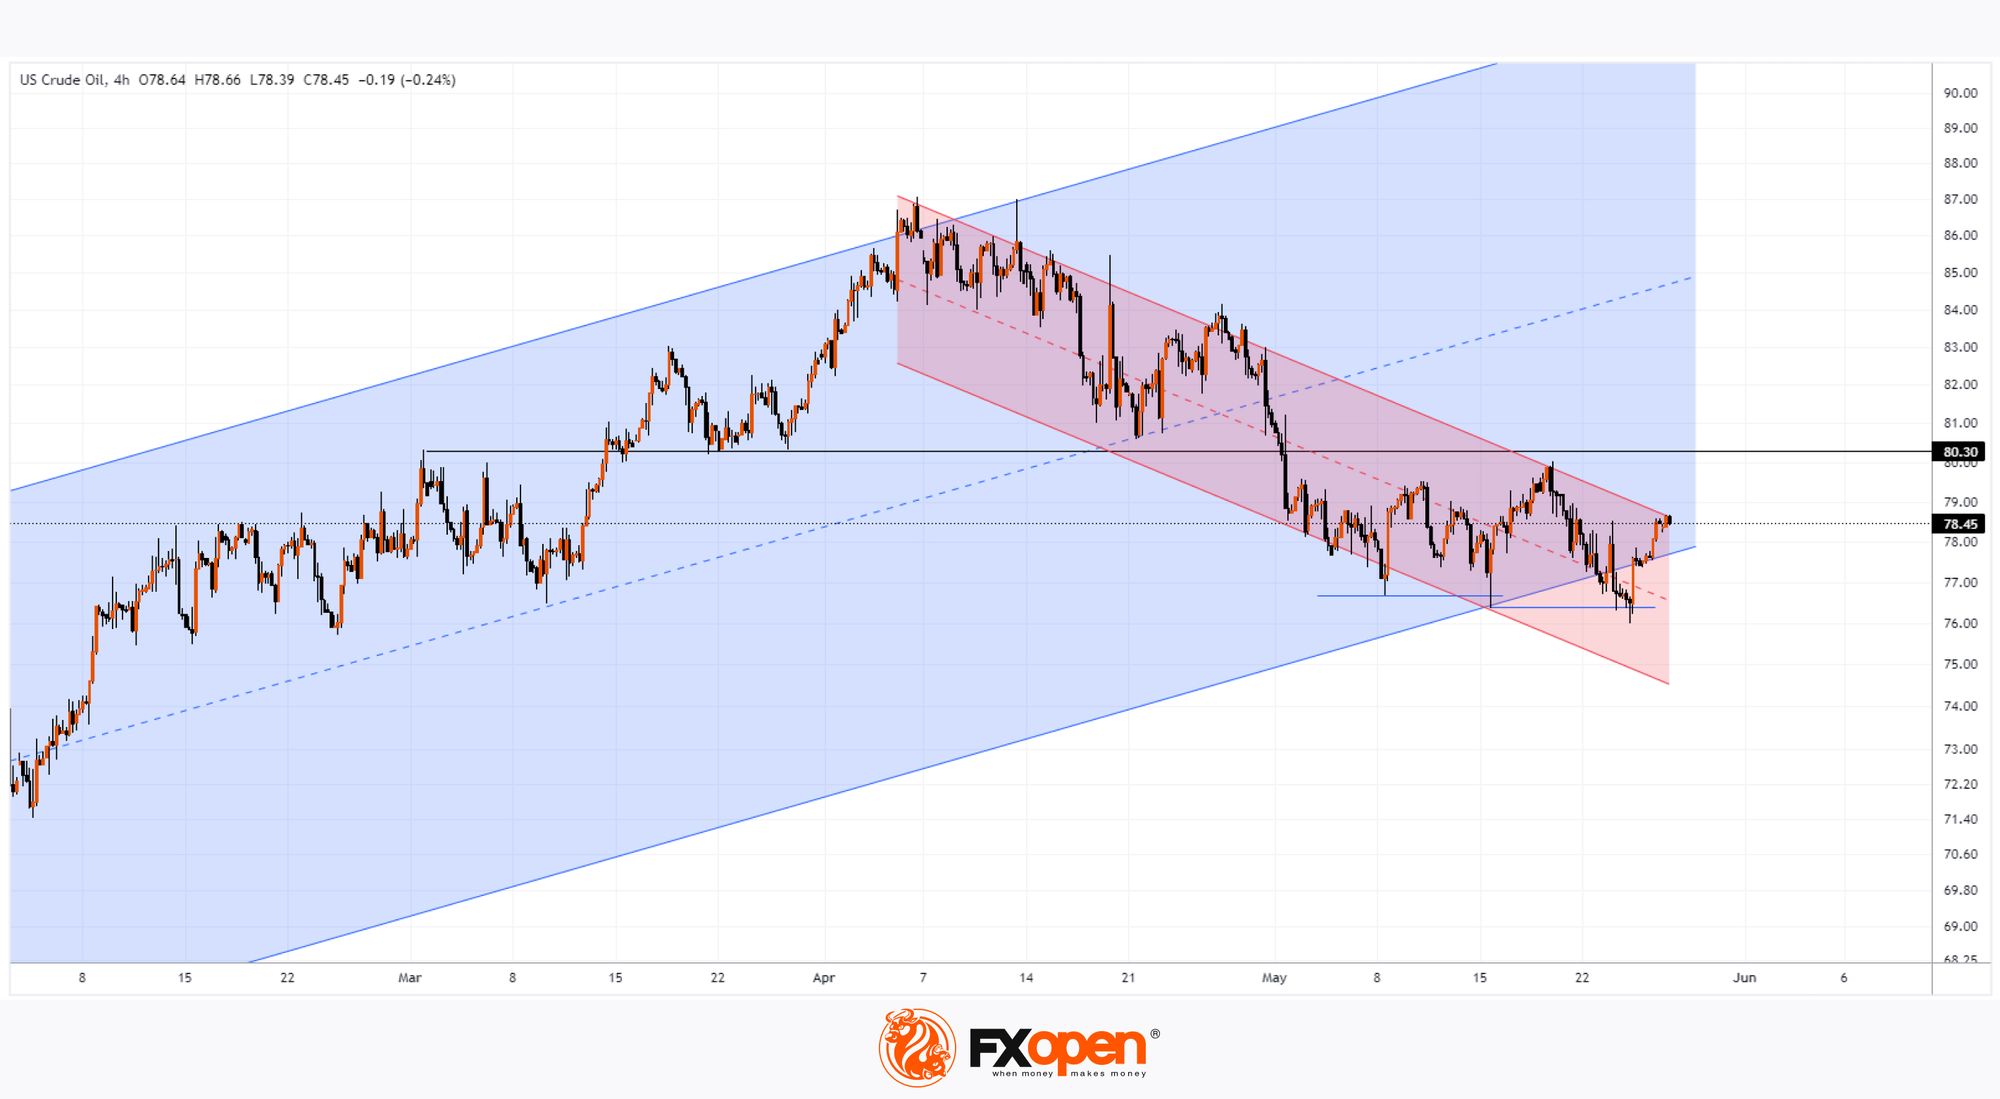
Conducting a technical analysis of WTI crude oil on 10 May, we drew an ascending channel in blue and suggested a scenario of continued price growth within this channel.
Since then:
→ the price formed a low on 15 May at the level of 76.35, but quickly recovered from it. Thus, the bears' attempt to break the low of 8 May at the level of 76.68 quickly failed. In other words, there was a false breakout of the 8 May low.
→ A similar pattern occurred on 24 May – the price dropped below the 15 May low of 76.35, but quickly recovered.
Two false bearish breakouts are a bullish sign. And the strong behaviour of WTI crude oil prices on Monday confirms this.
Analysing the XTI/USD chart today, it is important to note that:
→ the price movement in April-May forms a descending channel (shown in red);
→ this decline since 5 April may be a correction within the larger ascending blue channel;
→ the price quickly returned to the blue channel, briefly dipping below its lower boundary;
→ the price is near the upper boundary of the descending channel.
Thus, conditions are being created for the end of the corrective movement. The bears' inability to hold the WTI oil price at new lows may be used by the bulls to resume the upward trend. It is also possible that news related to the OPEC+ meeting will contribute to this development.
Start trading commodity CFDs with tight spreads (additional fees may apply). Open your trading account now or learn more about trading commodity CFDs with FXOpen.
This article represents the opinion of the Companies operating under the FXOpen brand only. It is not to be construed as an offer, solicitation, or recommendation with respect to products and services provided by the Companies operating under the FXOpen brand, nor is it to be considered financial advice.
Stay ahead of the market!
Subscribe now to our mailing list and receive the latest market news and insights delivered directly to your inbox.


Latest articles

Market Analysis: GBP/USD Dips Further As EUR/GBP Regains Traction
GBP/USD failed to climb above 1.3500 and corrected some gains. EUR/GBP started a decent increase and might aim for more gains above 0.8700.
Important Takeaways for GBP/USD and EUR/GBP Analysis Today
· The British Pound


Market Insights with Gary Thomson: Oil, US Retail Sales & NFP in Focus
In this video, we’ll explore the key economic events and market trends, shaping the financial landscape. Get ready for insights into financial markets to help you navigate the week ahead. Let’s dive in!
In this episode of Market