


WTI Oil Price Recovers Quickly From March Lows
FXOpen

On May 8, the price of WTI crude oil fell below $77 per barrel for the first time since March 11. But on the morning of May 10, it was above $79 – an increase of almost 3% in less than two days.
Several factors contributed to the significant rise in the price of WTI crude oil. According to Reuters, among them:
→ Increased oil demand from the United States. Data released on Wednesday showed a drop in US crude oil inventories, driven by increased refinery utilisation.
→ Growing demand from China. Data published on Thursday showed an increase in oil imports.
→ Ongoing concerns about possible supply disruptions due to escalating conflict in the Middle East. Negotiations to end hostilities between Israel and Hamas failed, and Israel attacked the Palestinian city of Rafah.
On April 19, we wrote about the possibility of a bearish breakdown of the ascending channel line, which would be welcomed by the US administration, where the presidential elections are getting closer and closer.
Since then, the price of oil has broken down the median line and the support line at $80.70, which may act as resistance in the future.
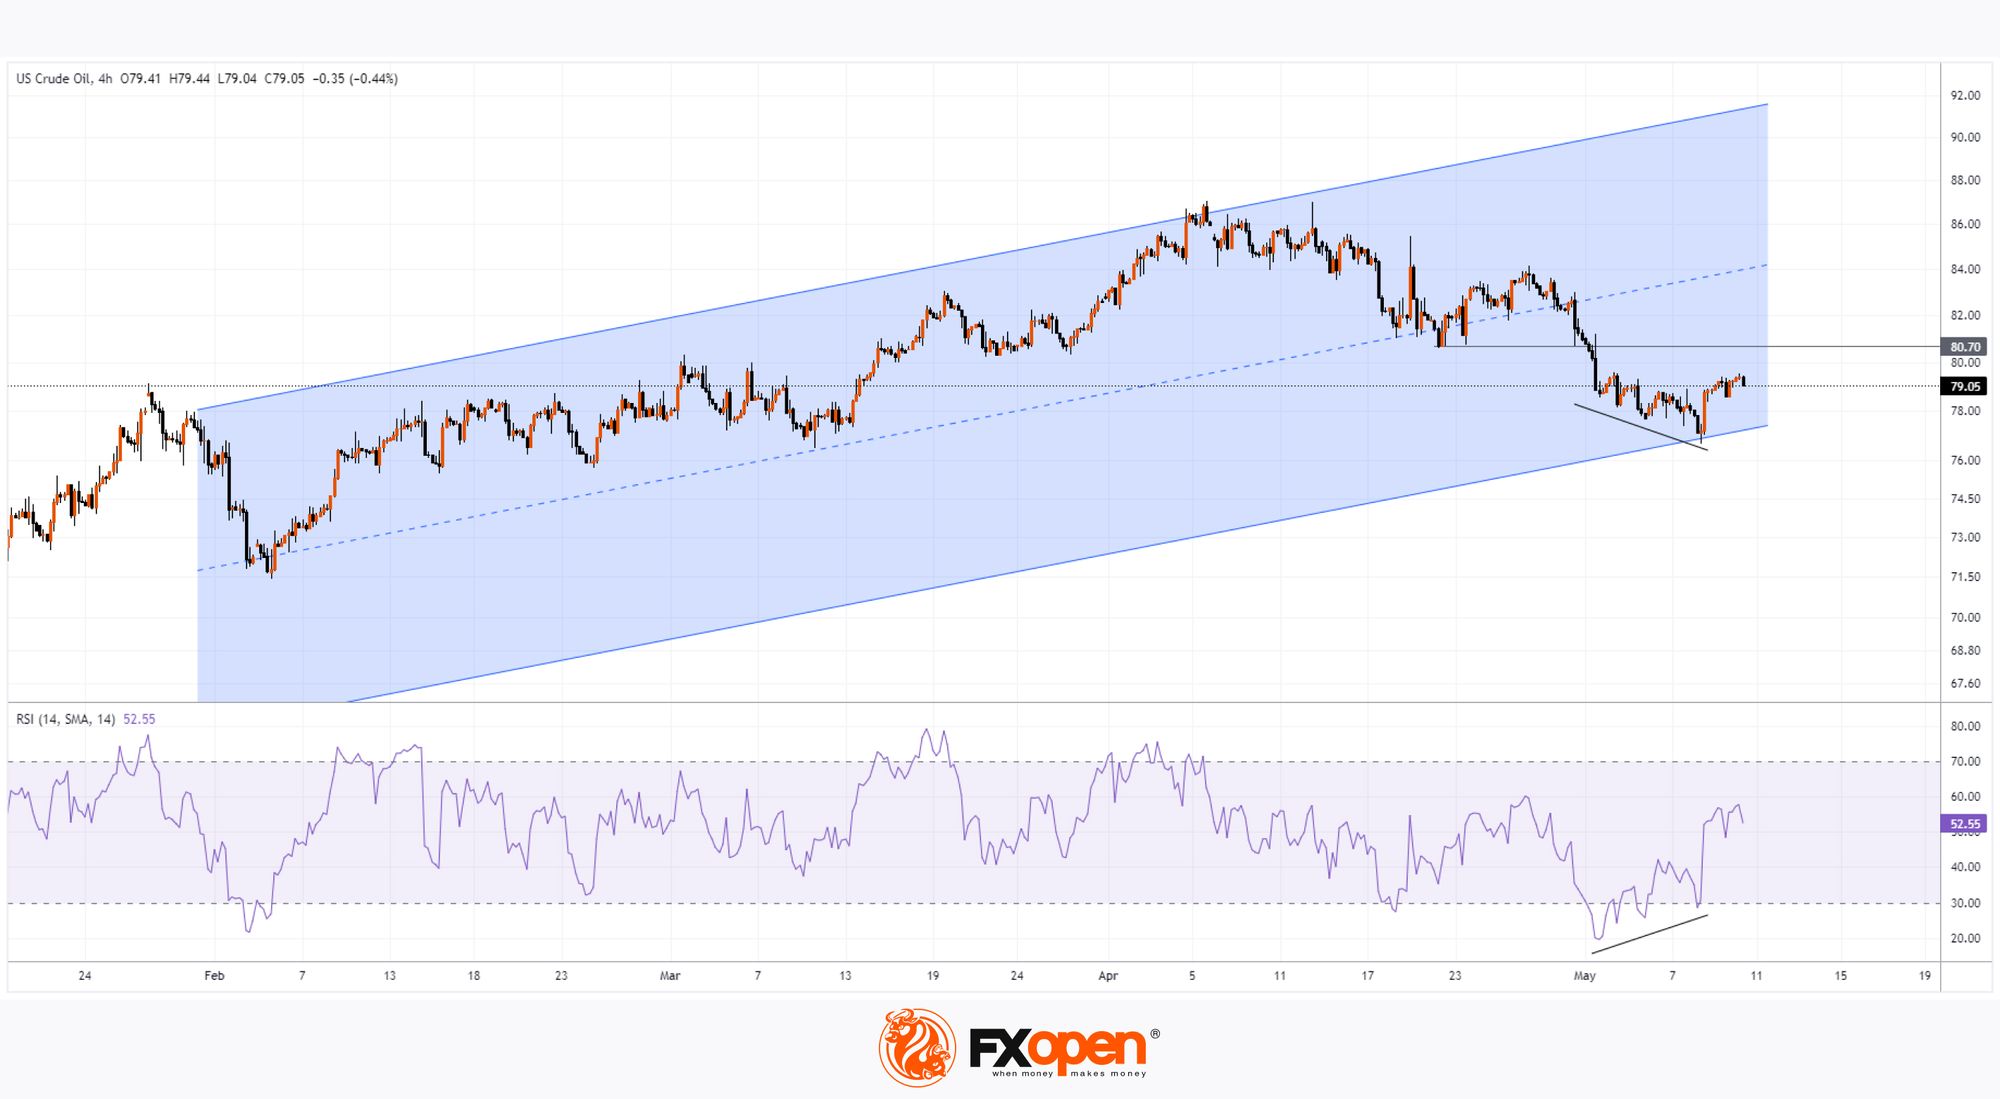
The WTI crude oil chart shows that:
→ the price is within the ascending channel, which has expanded two times since the last post according to the principle of parallel channels;
→ the bullish reversal on May 8-9 formed a test of its lower boundary;
→ the exhaustion of selling pressure was indicated by a bullish divergence on the RSI indicator.
If demand from major economies strengthens and the geopolitical environment continues to deteriorate, this could create the conditions for the WTI crude oil price movement within a sustained upward channel.
Start trading commodity CFDs with tight spreads (additional fees may apply). Open your trading account now or learn more about trading commodity CFDs with FXOpen.
This article represents the opinion of the Companies operating under the FXOpen brand only. It is not to be construed as an offer, solicitation, or recommendation with respect to products and services provided by the Companies operating under the FXOpen brand, nor is it to be considered financial advice.
Stay ahead of the market!
Subscribe now to our mailing list and receive the latest market news and insights delivered directly to your inbox.


Latest articles

AI Valuations Are Back in the Spotlight
Artificial intelligence remains the dominant investment theme of 2026, but investors are increasingly questioning whether AI stock valuations are keeping pace with reality.
💰 Big Tech continues to invest at an unprecedented scale, with hyperscaler AI spending projected to exceed $800

AUD/CAD: Months of Indecision — Is a Breakout Finally Coming?
The Australian dollar has clawed back most of its end-of-June losses, when it touched three-month lows against the greenback amid escalating Middle East tensions. Since then, sentiment has improved: the RBA's Assistant Governor Sarah Hunter signalled the board stands ready

USD/JPY: Battling at the Top of the Triangle
On 3 July, Japan's Finance Minister, Satsuki Katayama, stated that the Ministry of Finance remains in close contact with US authorities regarding developments in USD/JPY as the yen traded near its weakest level in almost 40 years. Similar verbal