


WTI Oil Price Rises Above $60
FXOpen

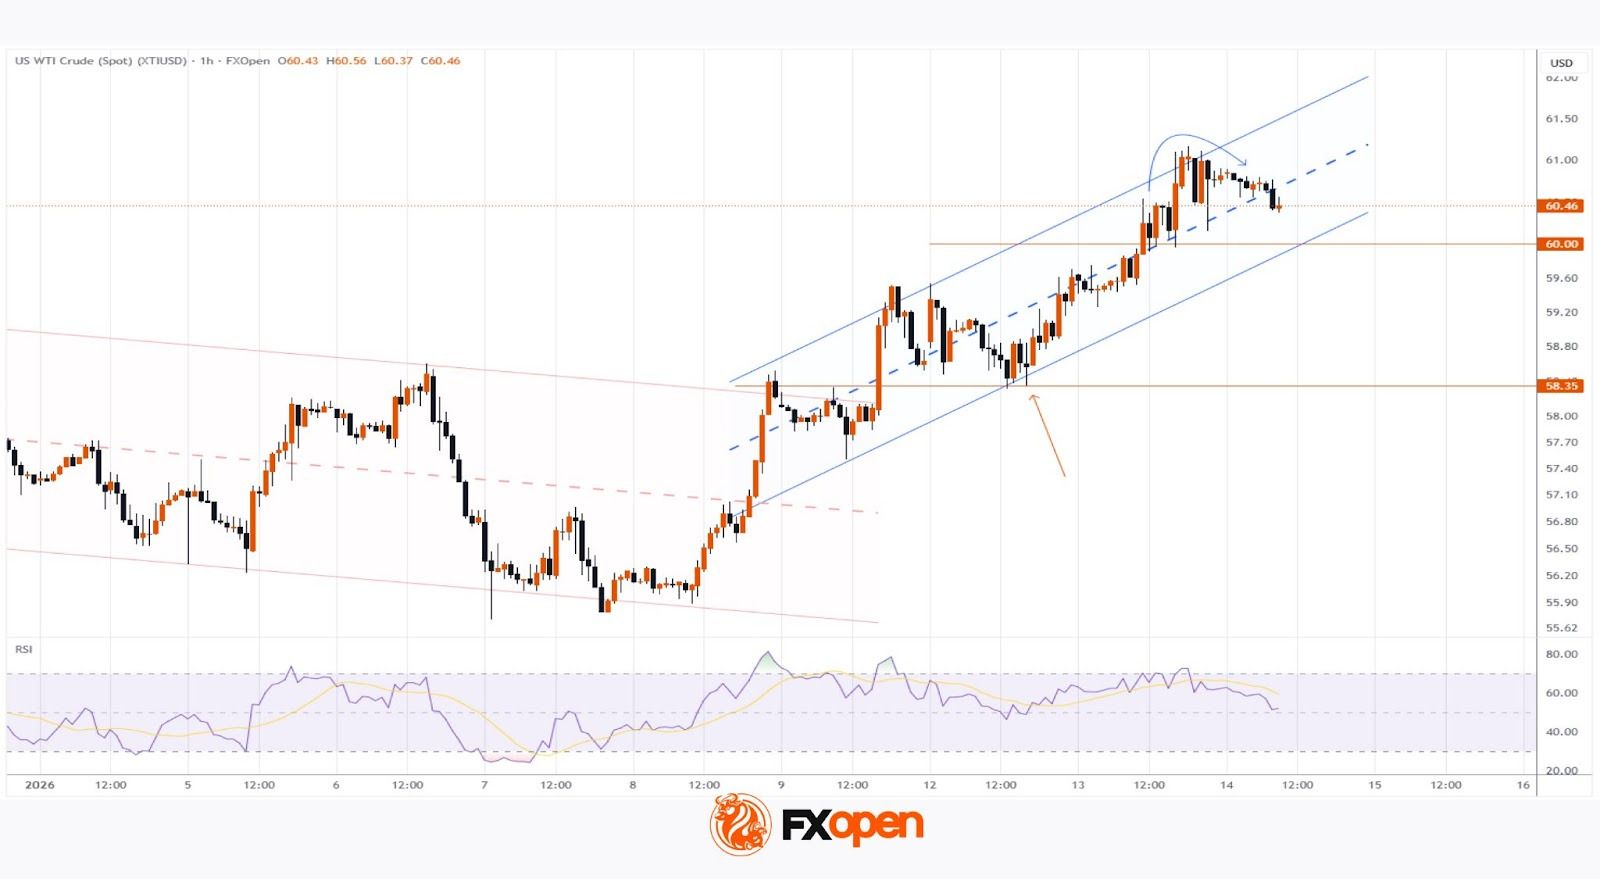
As the XTI/USD chart shows, the price of a barrel climbed above $60 this week, reaching a one-month high.
The main bullish driver has been large-scale anti-government protests in Iran, which could lead to a change of power and/or military action. Trump has voiced support for the protesters and threatened 25% tariffs on all countries trading with Iran. Market participants fear that Iranian oil supplies (around 1.5–2 mb/d) could simply disappear, or that the Strait of Hormuz could be closed.
Technical Analysis of the XTI/USD Chart
On 5 January, we:
→ used WTI price fluctuations to draw a descending channel (shown in red);
→ highlighted the long lower wicks formed when the price touched the lower boundary of the channel as evidence of strong demand (and a bear trap);
→ outlined a scenario involving a bullish impulse.
Indeed, since then the oil price has moved higher, with:
→ the upper boundary of the descending channel being broken, while the breakout level (around $58.35) subsequently acting as support (shown by the arrow);
→ fresh data providing grounds for plotting an upward trajectory.
After an attempted rise yesterday, downward momentum can be observed this morning (shown by the arrow). Given the rapid pace of WTI’s advance (around 2.7% since the start of the week), it is technically reasonable to assume that the market is vulnerable to a correction. The situation suggests that bulls may lack the strength to keep the price above the psychological $60 level. The market may also be sceptical that Trump will allow oil to remain this expensive (the President has said he wants a $53 barrel).
However, if geopolitical tensions in Iran (and other regions) intensify further, this could drive WTI prices even higher.
Start trading commodity CFDs with tight spreads (additional fees may apply). Open your trading account now or learn more about trading commodity CFDs with FXOpen.
This article represents the opinion of the Companies operating under the FXOpen brand only. It is not to be construed as an offer, solicitation, or recommendation with respect to products and services provided by the Companies operating under the FXOpen brand, nor is it to be considered financial advice.
Stay ahead of the market!
Subscribe now to our mailing list and receive the latest market news and insights delivered directly to your inbox.


Latest articles

GBP/USD and EUR/GBP Await Key Bank of England Decision
The pound strengthened following the outcome of the US Federal Reserve meeting, where the central bank, as expected, kept interest rates unchanged. However, the Fed did not provide the market with clear signals of an imminent shift towards rate cuts,

Microsoft Analysis: Earnings Beat Expectations
On 29 July 2026, Microsoft reported its results for the fourth quarter of fiscal year 2026. Revenue reached $90 billion, up 18% year-on-year, while adjusted earnings per share came in at $4.74, comfortably ahead of analysts' expectations of $4.

EUR/USD: All Eyes on the Fed as the Range Reaches Its Breaking Point
The dollar's next move hinges on tonight's Fed decision, and this time markets genuinely don't know what to expect. While economists still lean toward a hold—with CME FedWatch odds sitting near 68.5% for no change—Kevin Warsh's hawkish