


XTI/USD Chart Analysis: Oil Price Volatility on the Rise
FXOpen

Events in Venezuela over the weekend have led to a sharp increase in oil price volatility following the market open. As the chart shows, during the European session the ATR indicator rose to levels last seen before the start of the Christmas period.
It is possible that the opening of US trading could further increase price swings, with the trend potentially developing in either direction:
- Bearish scenario: if American companies gain access to Venezuela’s oil reserves (both in the ground and in storage facilities), this could lead to an increase in supply on the global market.
- Bullish scenario: risks include reactions from China, OPEC+, as well as the possibility of a guerrilla warfare scenario and other difficult-to-predict developments.
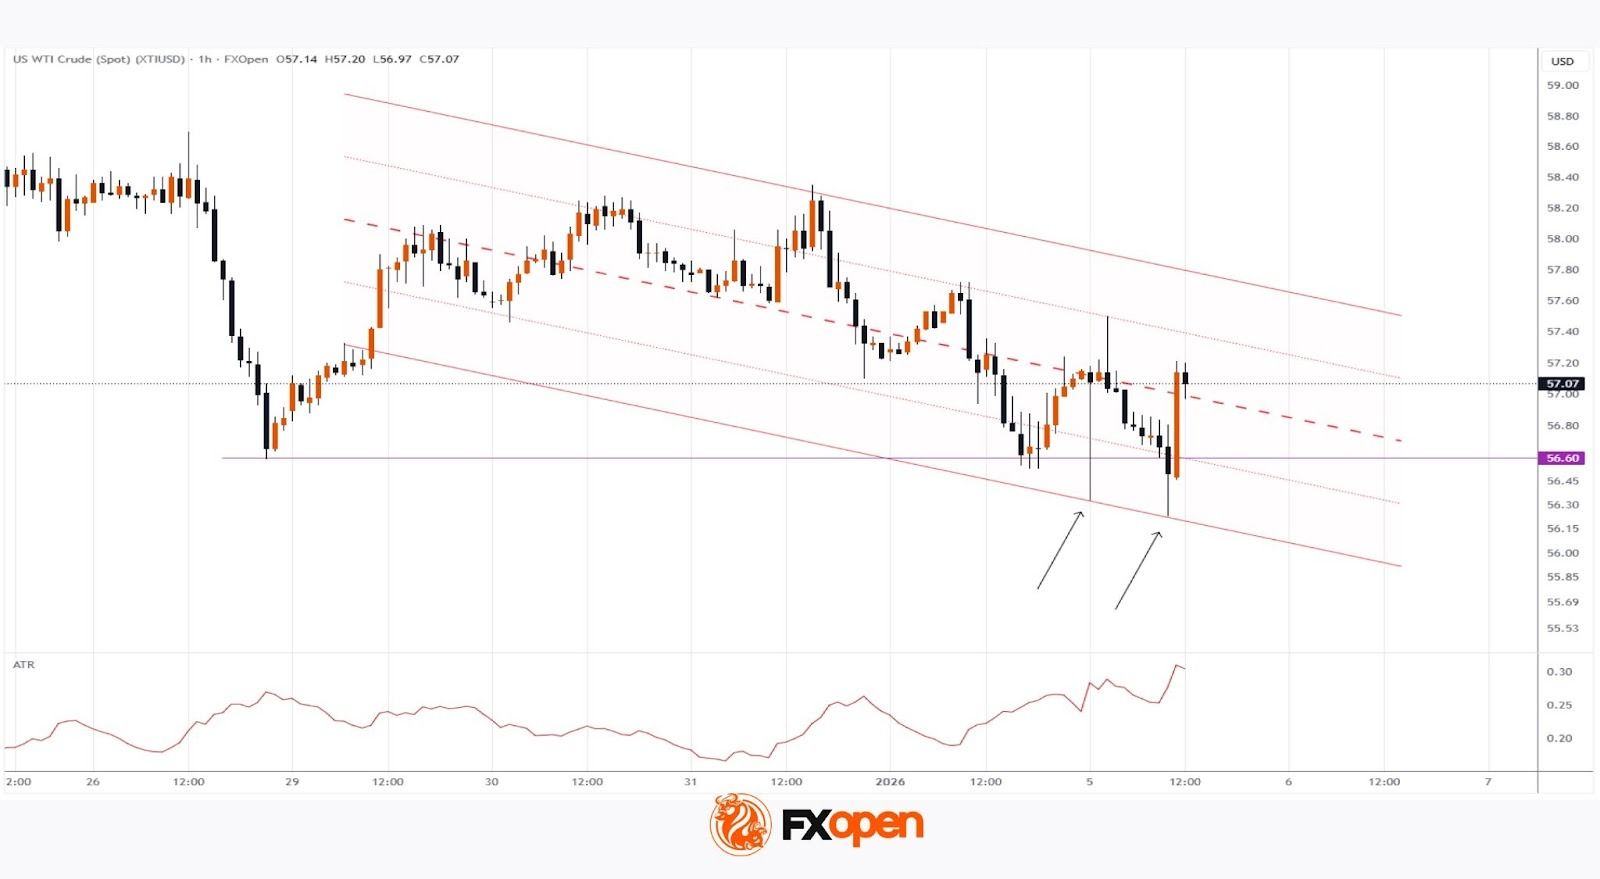
At present, WTI crude oil price is holding near the median of the descending channel (highlighted in red). Note the long lower wicks forming when the price touches the lower boundary of the channel, indicating a sharp activation of demand whenever the price falls below the 26 December low of around $56.60 per barrel.
This behaviour resembles a bear trap and could trigger a bullish impulse, potentially testing the upper boundary of the channel.
Start trading commodity CFDs with tight spreads (additional fees may apply). Open your trading account now or learn more about trading commodity CFDs with FXOpen.
This article represents the opinion of the Companies operating under the FXOpen brand only. It is not to be construed as an offer, solicitation, or recommendation with respect to products and services provided by the Companies operating under the FXOpen brand, nor is it to be considered financial advice.
Stay ahead of the market!
Subscribe now to our mailing list and receive the latest market news and insights delivered directly to your inbox.


Latest articles

GBP/USD and EUR/GBP Await Key Bank of England Decision
The pound strengthened following the outcome of the US Federal Reserve meeting, where the central bank, as expected, kept interest rates unchanged. However, the Fed did not provide the market with clear signals of an imminent shift towards rate cuts,

Microsoft Analysis: Earnings Beat Expectations
On 29 July 2026, Microsoft reported its results for the fourth quarter of fiscal year 2026. Revenue reached $90 billion, up 18% year-on-year, while adjusted earnings per share came in at $4.74, comfortably ahead of analysts' expectations of $4.

EUR/USD: All Eyes on the Fed as the Range Reaches Its Breaking Point
The dollar's next move hinges on tonight's Fed decision, and this time markets genuinely don't know what to expect. While economists still lean toward a hold—with CME FedWatch odds sitting near 68.5% for no change—Kevin Warsh's hawkish