


WTI Oil Pulls Back from Its 2026 High
FXOpen

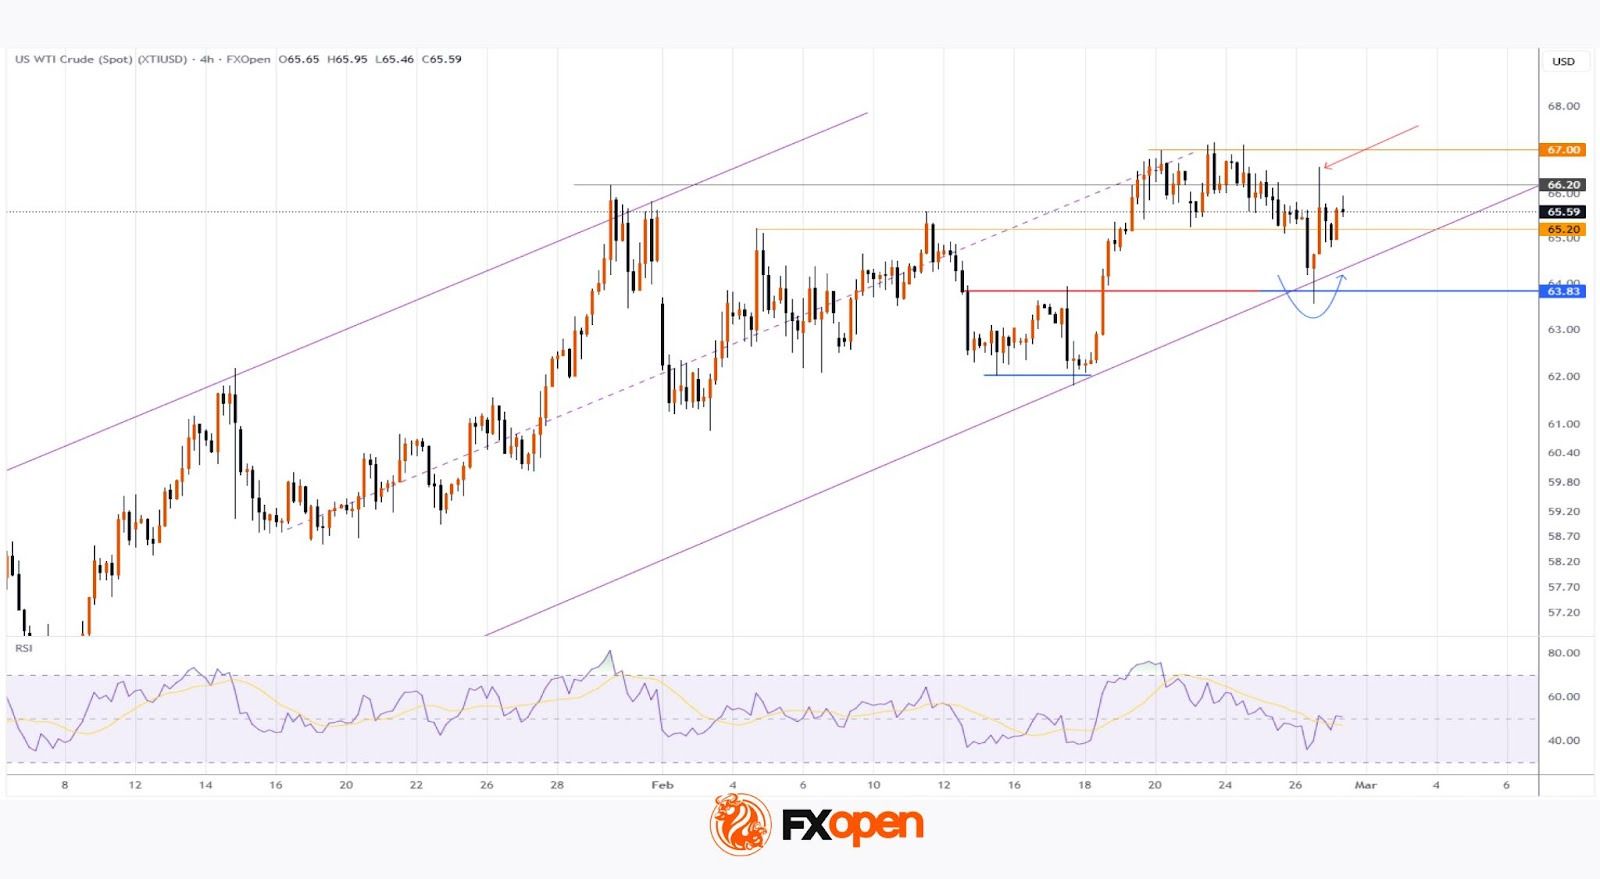
As the XTI/USD chart shows, the price of a barrel:
→ set fresh 2026 highs above $67 earlier this week;
→ but yesterday posted a sharp reversal lower (as indicated by the blue arrow).
The spike in volatility was driven by conflicting reports from Geneva, where talks between the United States and Iran were taking place:
→ some sources suggested negotiations had reached an impasse, as Washington insists on a complete halt to uranium enrichment;
→ meanwhile, according to Omani mediators, progress has been made and another round of talks is scheduled for next week.
Technical Analysis of the XTI/USD Chart
When analysing the oil price chart on the morning of 19 February, we suggested that:
→ the market could soon set a new high for the year (which materialised, with a series of highs formed between 19 and 23 February);
→ the 65.20 level would act as support (confirmed on 23 February).
Today’s chart indicates growing bearish pressure, reflected in the following:
→ WTI struggled to hold above its yearly highs, forming signs of potential bull traps;
→ yesterday’s candle (marked with a red arrow) shows a pronounced upper wick.
At the same time, bulls clearly defended the former resistance level at $63.73. The lower boundary of the ascending trajectory that has defined WTI price movements in 2026 also supports the bullish case.
It is worth noting that an OPEC+ meeting is scheduled for the weekend. According to media reports, analysts expect an increase in output from April, which could heighten concerns about oversupply — particularly after US crude inventories rose on Wednesday. As a result, Monday’s trading may open with elevated volatility.
Start trading commodity CFDs with tight spreads (additional fees may apply). Open your trading account now or learn more about trading commodity CFDs with FXOpen.
This article represents the opinion of the Companies operating under the FXOpen brand only. It is not to be construed as an offer, solicitation, or recommendation with respect to products and services provided by the Companies operating under the FXOpen brand, nor is it to be considered financial advice.
Stay ahead of the market!
Subscribe now to our mailing list and receive the latest market news and insights delivered directly to your inbox.


Latest articles


Market Repricing of Risk as Gold Loses Safe-Haven Demand
Geopolitical tensions in the Middle East had remained the primary macro driver for the gold market over recent weeks; however, on 8 April the situation shifted sharply as the United States and Iran agreed to a temporary two-week ceasefire, including

Commodity Currencies on the Rise: Market Focus Shifts to US and Canadian Data
Commodity-linked currencies continue to strengthen, while the US dollar remains under pressure amid easing geopolitical tensions and a shift in investor preference towards riskier assets. Reports of a temporary ceasefire between the US and Iran have helped stabilise sentiment and