


FXOpen

As the XAG/USD chart indicates today, the price of silver has dropped by over 5% in the past week. Bearish signs are also evident in the price of gold. According to Reuters, market participants are focusing on a series of economic data set to be released this week, which could influence expectations regarding a potential rate cut at the Federal Reserve’s September meeting.
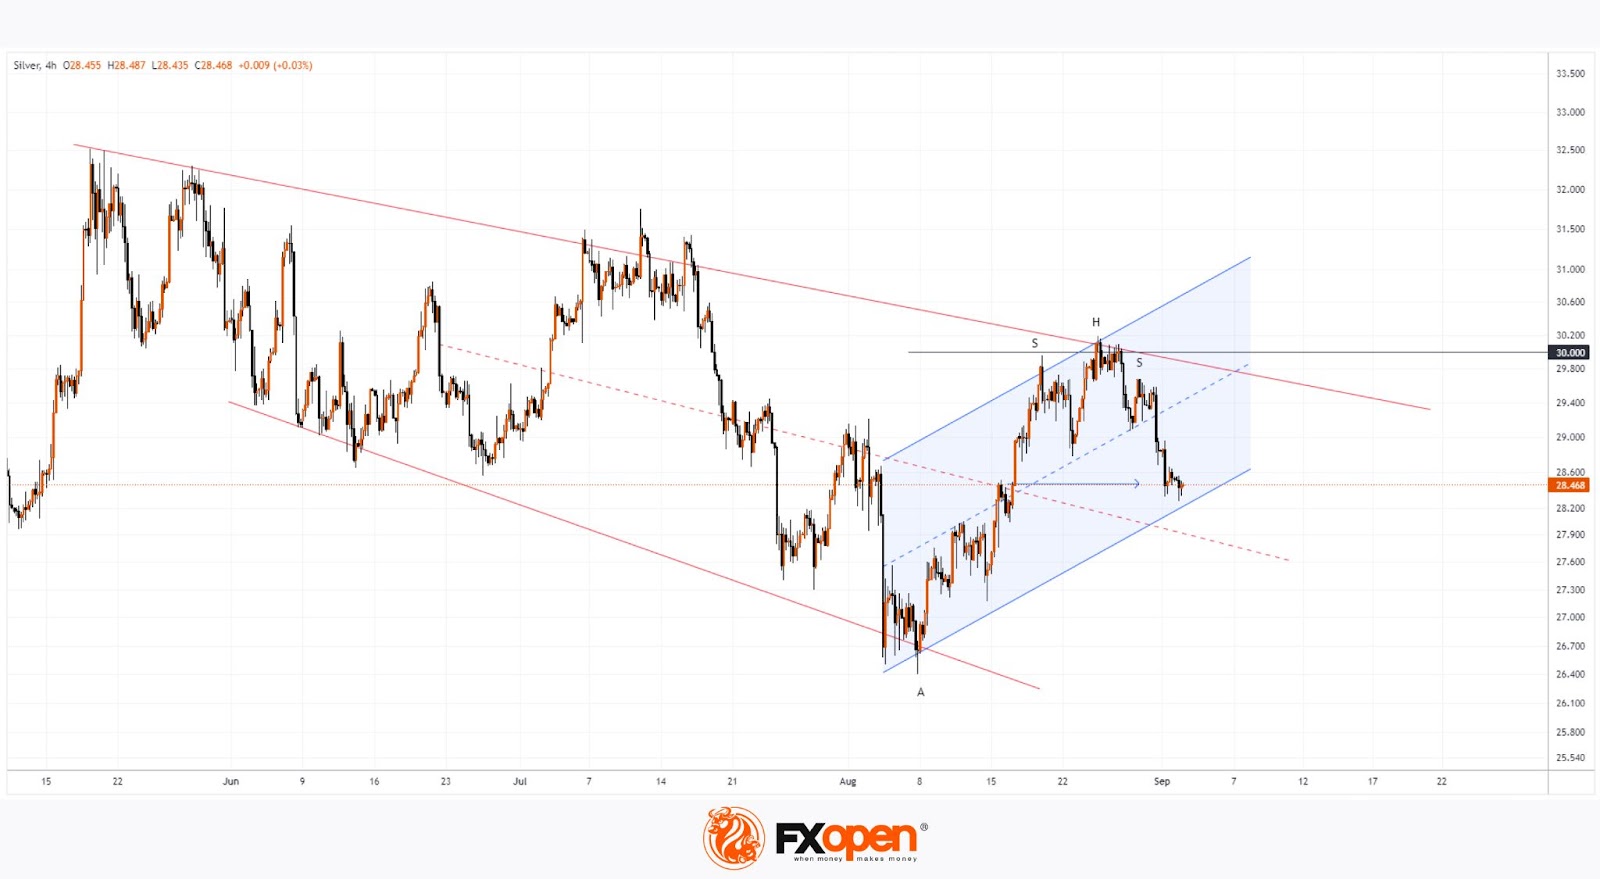
Could the price of silver continue to decline? Technical analysis of the XAG/USD chart shows that since late May, the price of silver has been forming a structure resembling a fan of three expanding lines, marked in red.
Bullish Arguments:
→ The price has broken through the red median line and moved into the upper half of the fan.
→ The price is near the bullish breakout level of the median line, which may provide support.
→ On 2-3 September, the bearish momentum slowed down, indicating potential support, which could be strengthened by the lower boundary of the rising blue channel.
→ The price is at the 50% level of the bullish A→H impulse.
Bearish Arguments:
→ Near the psychological level of $30 per ounce, a bearish head and shoulders (H&S) pattern has formed on the chart, although the potential from the neckline break has almost been exhausted.
Therefore, it is possible that the bulls may try to regain control and make a new attempt to push the price towards the $30 level. Whether this scenario plays out will largely depend on the fundamental backdrop. On Friday, 6 September, at 15:30 GMT+3, US labour market data will be released – this event could have a significant impact on the price of silver.
Start trading commodity CFDs with tight spreads (additional fees may apply). Open your trading account now or learn more about trading commodity CFDs with FXOpen.
This article represents the opinion of the Companies operating under the FXOpen brand only. It is not to be construed as an offer, solicitation, or recommendation with respect to products and services provided by the Companies operating under the FXOpen brand, nor is it to be considered financial advice.
Stay ahead of the market!
Subscribe now to our mailing list and receive the latest market news and insights delivered directly to your inbox.


Latest articles

European Currencies Decline: Pound Hits New Lows, Euro Under Pressure
European currencies continue to weaken against the US dollar amid rising geopolitical tensions and increased demand for safe-haven and liquid assets. Market participants are reducing exposure to riskier instruments, putting pressure on both the euro and the pound. Additional support

Market Analysis: GBP/USD Dips Further As EUR/GBP Regains Traction
GBP/USD failed to climb above 1.3500 and corrected some gains. EUR/GBP started a decent increase and might aim for more gains above 0.8700.
Important Takeaways for GBP/USD and EUR/GBP Analysis Today
· The British Pound
