


FXOpen

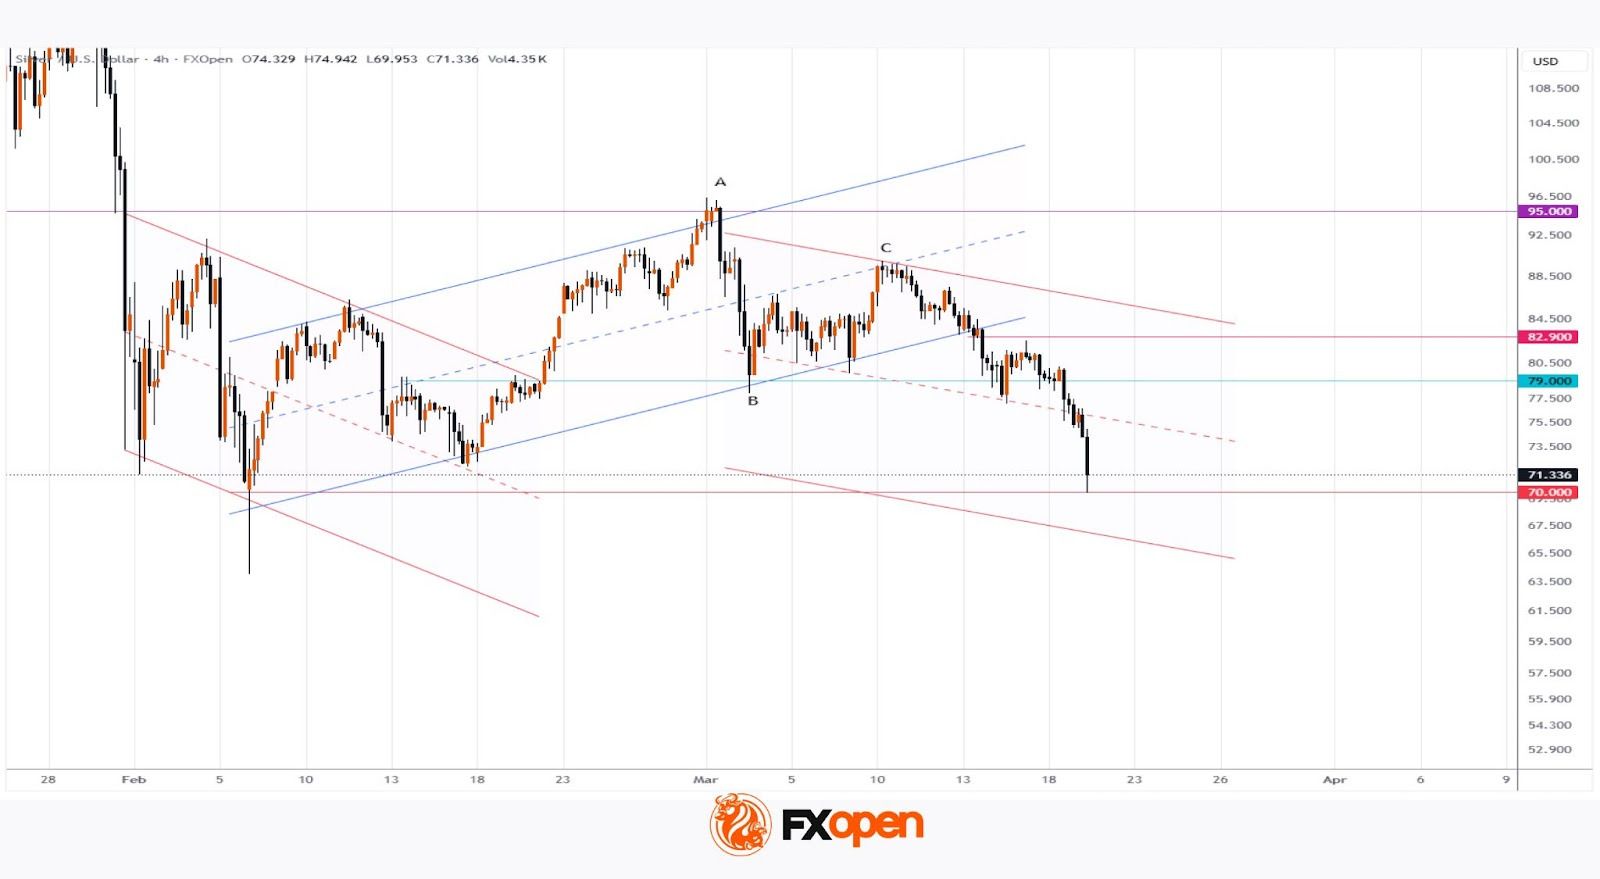
As seen on the XAG/USD chart, the price of silver fell to the $70 level and briefly pierced it, marking the lowest level since early February.
Although geopolitical tensions typically support demand for safe-haven assets, silver is under pressure from expectations of a fresh inflationary surge driven by rising energy prices (as noted earlier, Brent crude has risen above $110).
Yesterday’s “hawkish” comments from Federal Reserve Chair Jerome Powell also played a role. The Fed maintained interest rates, signalling that any future cuts would only occur if inflation stabilises.
Technical Analysis of XAG/USD
On 4 March, analysing the XAG/USD chart, we:
→ drew a blue ascending channel;
→ suggested that price action around the channel’s median could provide key signals.
Over time, the median proved to be a strong resistance. By 10 March, point C had formed, after which:
→ on 13 March, the blue channel was breached;
→ on 17 March, price showed an intraday bearish reversal from the breakout level.
Trading volume analysis indicates that the market remains under considerable pressure.
Although the long lower shadow on the candle near the psychological $70 mark indicates some buyer activity, the overall picture remains bearish. A red descending channel can be drawn on the silver price chart, with its median potentially acting as resistance in the near term, thereby confirming the validity of the constructed channel.
Start trading commodity CFDs with tight spreads (additional fees may apply). Open your trading account now or learn more about trading commodity CFDs with FXOpen.
This article represents the opinion of the Companies operating under the FXOpen brand only. It is not to be construed as an offer, solicitation, or recommendation with respect to products and services provided by the Companies operating under the FXOpen brand, nor is it to be considered financial advice.
Stay ahead of the market!
Subscribe now to our mailing list and receive the latest market news and insights delivered directly to your inbox.


Latest articles
European Currencies Strengthen: Dollar Under Pressure Following Ceasefire News
European currencies posted solid gains, while the US dollar came under pressure amid easing geopolitical tensions following reports of a two-week ceasefire agreement between the United States and Iran. Reduced demand for so-called safe-haven assets acted as the primary driver,

Brent Crude Price: Ceasefire Wipes Out the Geopolitical Premium
For several weeks, the oil market remained directly influenced by the US-Iran tensions. Threats to close the Strait of Hormuz kept Brent prices within the $97–110 range. Overnight on 8 April, the parties announced a two-week ceasefire, and the
