


FXOpen

Precious metal prices are fluctuating near multi-year highs due to safe-haven demand driven by:
→ Uncertainty surrounding the U.S. elections,
→ Ongoing tensions in the Middle East,
→ Expectations of central banks lowering interest rates.
As seen on the XAG/USD chart, silver prices:
→ Are near their highest levels in 12 years,
→ Are approaching the $35 mark,
→ Have risen by over 43% since the start of the year.
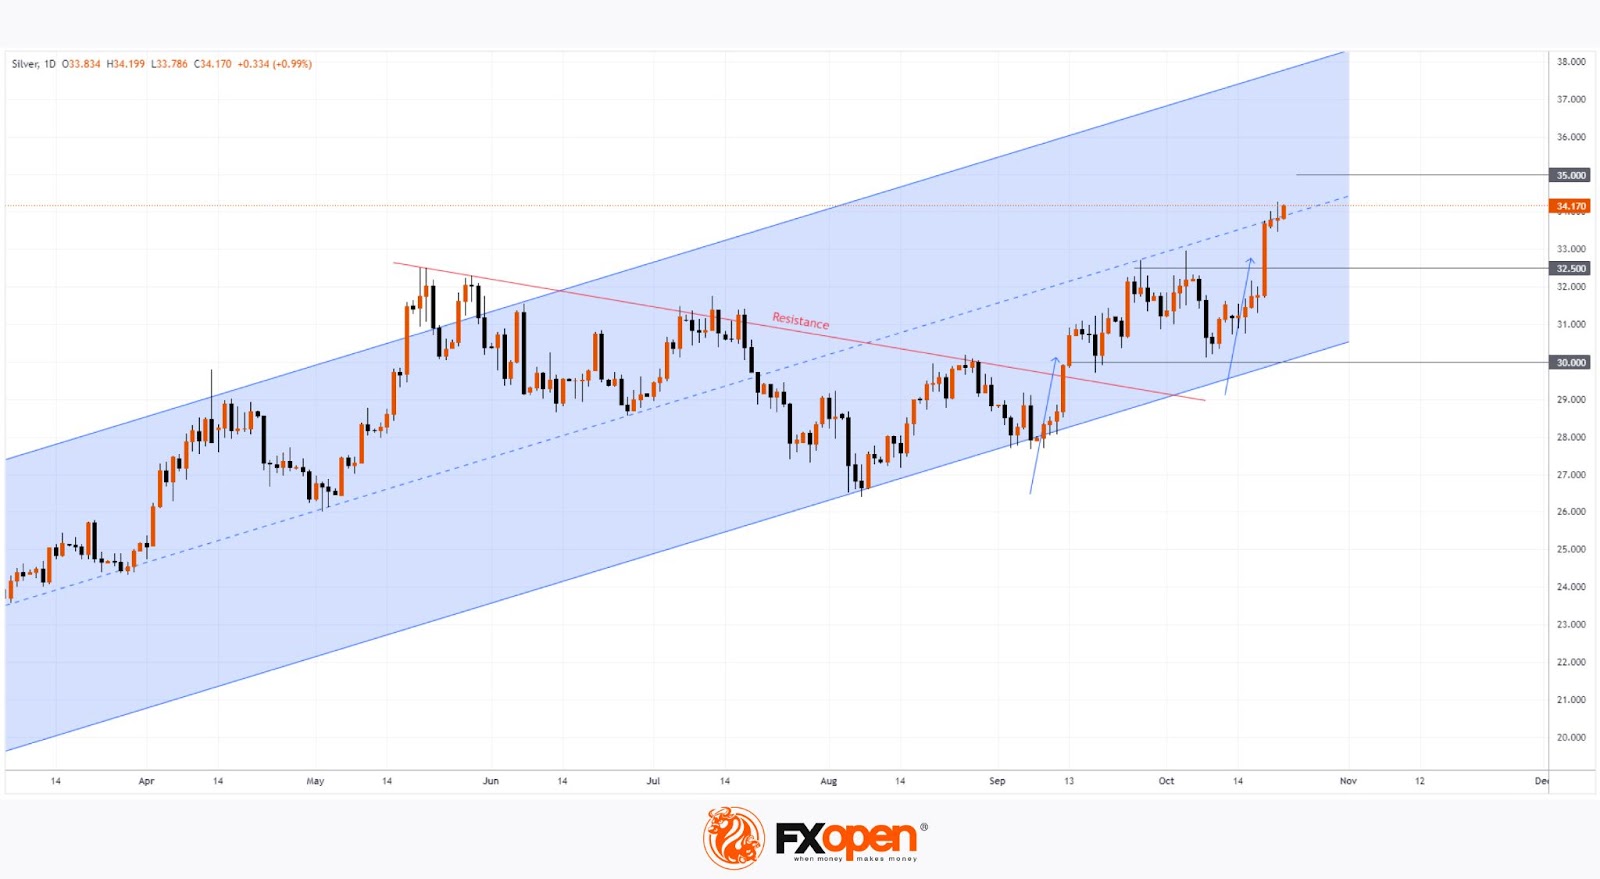
Technical analysis of the XAG/USD chart indicates that silver is following an upward trend (shown in a blue channel), with the current price near its median line. This suggests a potential balance between supply and demand, which could stabilise price fluctuations.
Key observations:
→ A red resistance line on the chart reflects a corrective phase within the blue channel.
→ Breaking through this resistance in September triggered a strong bullish impulse (marked by a blue arrow).
→ This impulse was so robust that it pushed the price above the psychological $30 level, turning it into support.
A similar pattern might emerge in the future. After another strong bullish move (marked by a second blue arrow), the $32.5 level could also become a support area.
Read analytical Silver price forecasts for 2024 and beyond.
Start trading commodity CFDs with tight spreads (additional fees may apply). Open your trading account now or learn more about trading commodity CFDs with FXOpen.
This article represents the opinion of the Companies operating under the FXOpen brand only. It is not to be construed as an offer, solicitation, or recommendation with respect to products and services provided by the Companies operating under the FXOpen brand, nor is it to be considered financial advice.
Stay ahead of the market!
Subscribe now to our mailing list and receive the latest market news and insights delivered directly to your inbox.


Latest articles

Market Analysis: GBP/USD Dips Further As EUR/GBP Regains Traction
GBP/USD failed to climb above 1.3500 and corrected some gains. EUR/GBP started a decent increase and might aim for more gains above 0.8700.
Important Takeaways for GBP/USD and EUR/GBP Analysis Today
· The British Pound


Market Insights with Gary Thomson: Oil, US Retail Sales & NFP in Focus
In this video, we’ll explore the key economic events and market trends, shaping the financial landscape. Get ready for insights into financial markets to help you navigate the week ahead. Let’s dive in!
In this episode of Market