


FXOpen

As shown on the XAG/USD chart, during the trading session on 26th September, the price of silver surpassed the previous 2024 high (set in July), reaching levels last seen in December 2012.
Key drivers of silver’s price include news related to the Federal Reserve’s policy:
→ Last month, when the Federal Reserve cut interest rates, it led to a rise in both gold and silver prices.
→ However, precious metal prices dipped slightly yesterday after Fed Chair Jerome Powell adjusted expectations regarding further rate cuts this year, stating that the Fed would not rush into making more reductions.
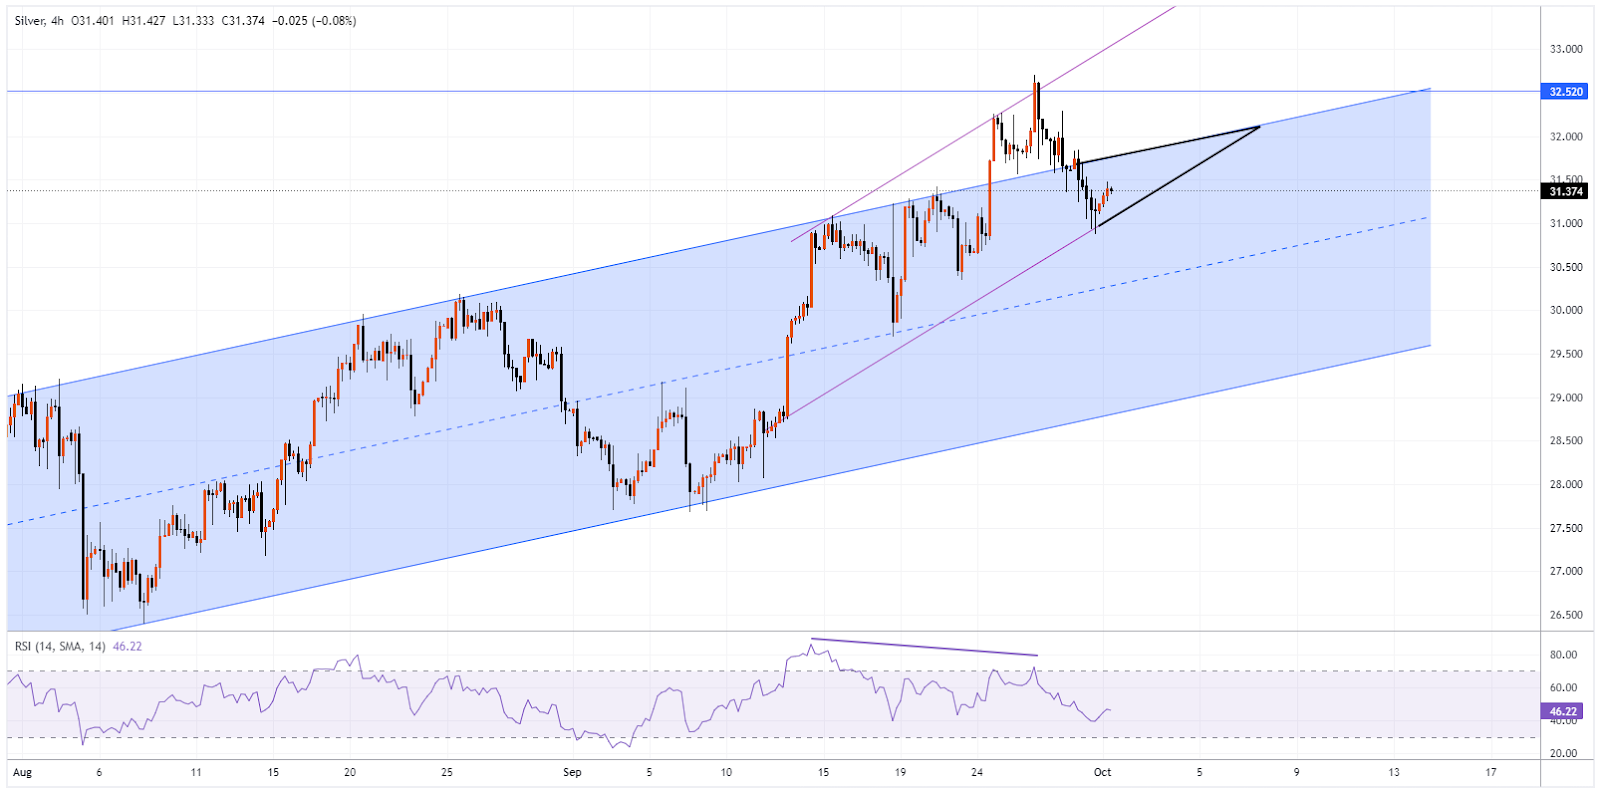
Technical analysis of the XAG/USD chart reveals:
→ Since August, the price of silver has formed an ascending channel (shown in blue). In September, bullish sentiment strengthened, establishing points for a steeper upward channel (marked by purple lines).
→ The price surge at the end of September caused the RSI indicator to form a bearish divergence, making silver vulnerable to a correction after hitting a historic high – which is what followed.
What comes next?
It largely depends on upcoming fundamental news. Currently, silver’s price appears to be in consolidation, confined by the triangle formed by the boundaries of the two channels (shown by black lines). A breakout from this triangle could potentially lead to a significant trend forming.
Start trading commodity CFDs with tight spreads (additional fees may apply). Open your trading account now or learn more about trading commodity CFDs with FXOpen.
This article represents the opinion of the Companies operating under the FXOpen brand only. It is not to be construed as an offer, solicitation, or recommendation with respect to products and services provided by the Companies operating under the FXOpen brand, nor is it to be considered financial advice.
Stay ahead of the market!
Subscribe now to our mailing list and receive the latest market news and insights delivered directly to your inbox.


Latest articles

Market Analysis: GBP/USD Dips Further As EUR/GBP Regains Traction
GBP/USD failed to climb above 1.3500 and corrected some gains. EUR/GBP started a decent increase and might aim for more gains above 0.8700.
Important Takeaways for GBP/USD and EUR/GBP Analysis Today
· The British Pound


Market Insights with Gary Thomson: Oil, US Retail Sales & NFP in Focus
In this video, we’ll explore the key economic events and market trends, shaping the financial landscape. Get ready for insights into financial markets to help you navigate the week ahead. Let’s dive in!
In this episode of Market