


XAU/USD Analysis: Gold Price Surpasses $2700 for the First Time
FXOpen

The XAU/USD chart shows that gold has reached a historic high, surpassing the psychological level of $2700.
According to Yahoo Finance:
→ Bullish momentum is being driven by central banks increasing their gold reserves;
→ Goldman Sachs analysts have raised their gold price target from $2700 to $2900.
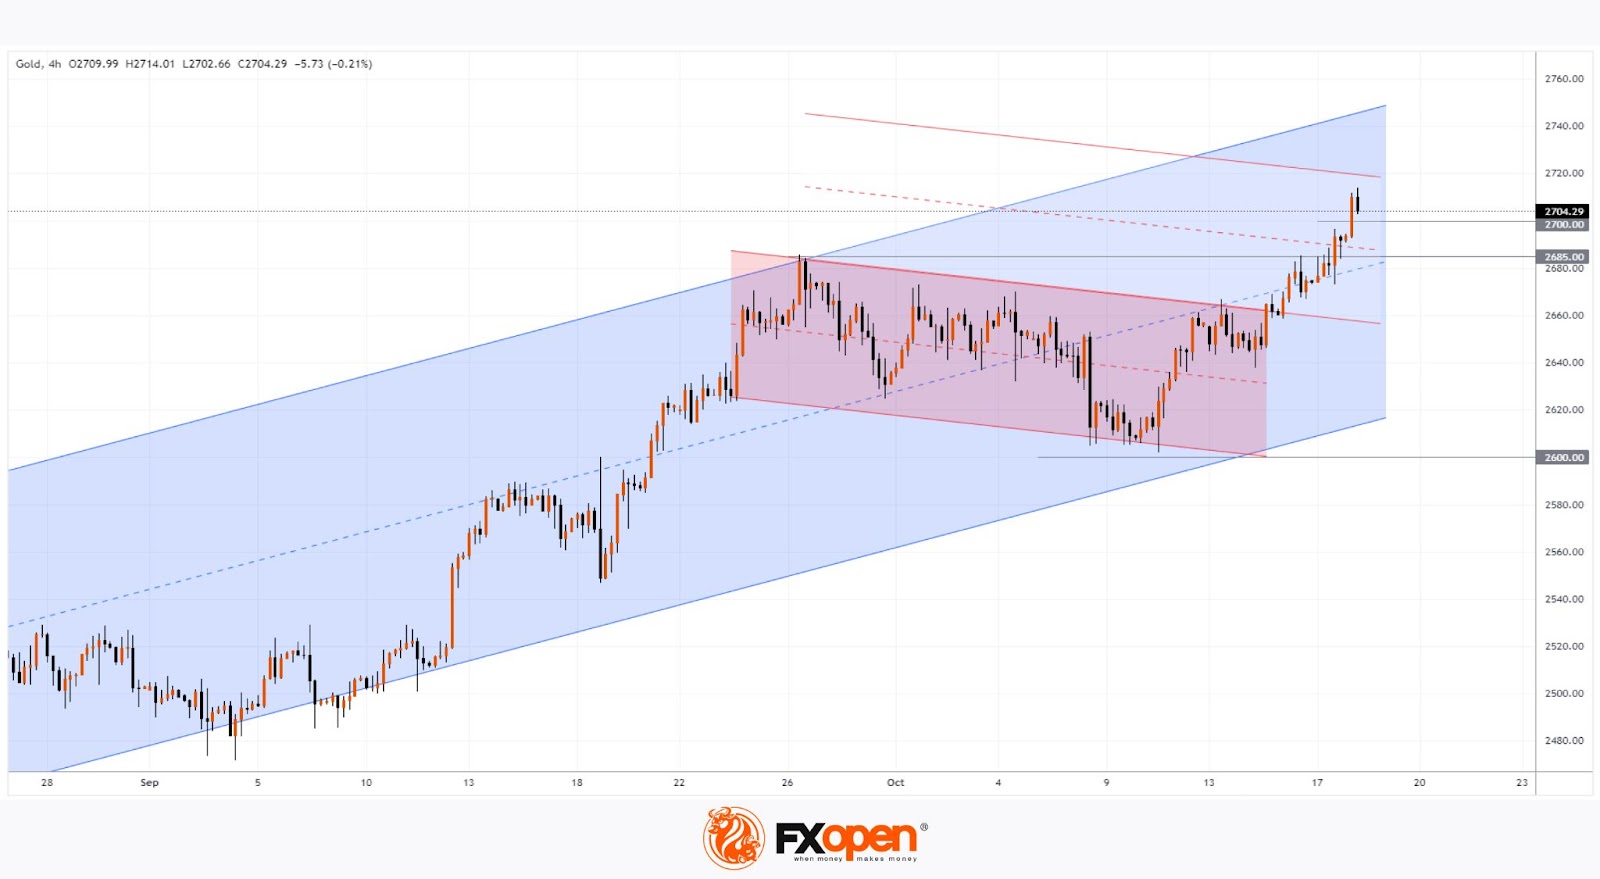
On 9 October, when analysing the gold price chart, we identified an ascending channel (shown in blue) and suggested that bulls might attempt to resume the upward trend from the $2600 level. Since then, the price has broken above a downward channel (shown in red), which could be viewed as a corrective move.
Today, a technical analysis of the XAU/USD chart indicates that gold has moved into the upper half of the blue channel, surpassing its median, signalling strong demand.
Can the rally continue?
It is possible that gold's price will continue to be supported by economic news and geopolitical instability.
From a technical perspective, the gold price has several support levels on the chart:
→ The median line of the blue channel;
→ Previous resistance near the $2685 level;
→ The psychological level of $2700.
Considering the height of the red corrective channel on the XAU/USD chart, the bulls' target could be the upper boundary of a parallel channel of the same height, projected higher.
Start trading commodity CFDs with tight spreads (additional fees may apply). Open your trading account now or learn more about trading commodity CFDs with FXOpen.
This article represents the opinion of the Companies operating under the FXOpen brand only. It is not to be construed as an offer, solicitation, or recommendation with respect to products and services provided by the Companies operating under the FXOpen brand, nor is it to be considered financial advice.
Stay ahead of the market!
Subscribe now to our mailing list and receive the latest market news and insights delivered directly to your inbox.


Latest articles

AI Valuations Are Back in the Spotlight
Artificial intelligence remains the dominant investment theme of 2026, but investors are increasingly questioning whether AI stock valuations are keeping pace with reality.
💰 Big Tech continues to invest at an unprecedented scale, with hyperscaler AI spending projected to exceed $800

AUD/CAD: Months of Indecision — Is a Breakout Finally Coming?
The Australian dollar has clawed back most of its end-of-June losses, when it touched three-month lows against the greenback amid escalating Middle East tensions. Since then, sentiment has improved: the RBA's Assistant Governor Sarah Hunter signalled the board stands ready

USD/JPY: Battling at the Top of the Triangle
On 3 July, Japan's Finance Minister, Satsuki Katayama, stated that the Ministry of Finance remains in close contact with US authorities regarding developments in USD/JPY as the yen traded near its weakest level in almost 40 years. Similar verbal