


Analysis of XAU/USD: Gold Price Drops to a Two-Week Low
FXOpen

The XAU/USD chart shows that yesterday, the price of gold fell below $2610, a level not seen since 20th September.
Bearish sentiment has been driven by the continued strengthening of the US dollar. According to Trading Economics:
→ This is due to market participants lowering expectations for an aggressive rate cut by the Federal Reserve.
→ Currently, there is an 89% probability that the Fed will decide on a 25 basis point rate cut in November.
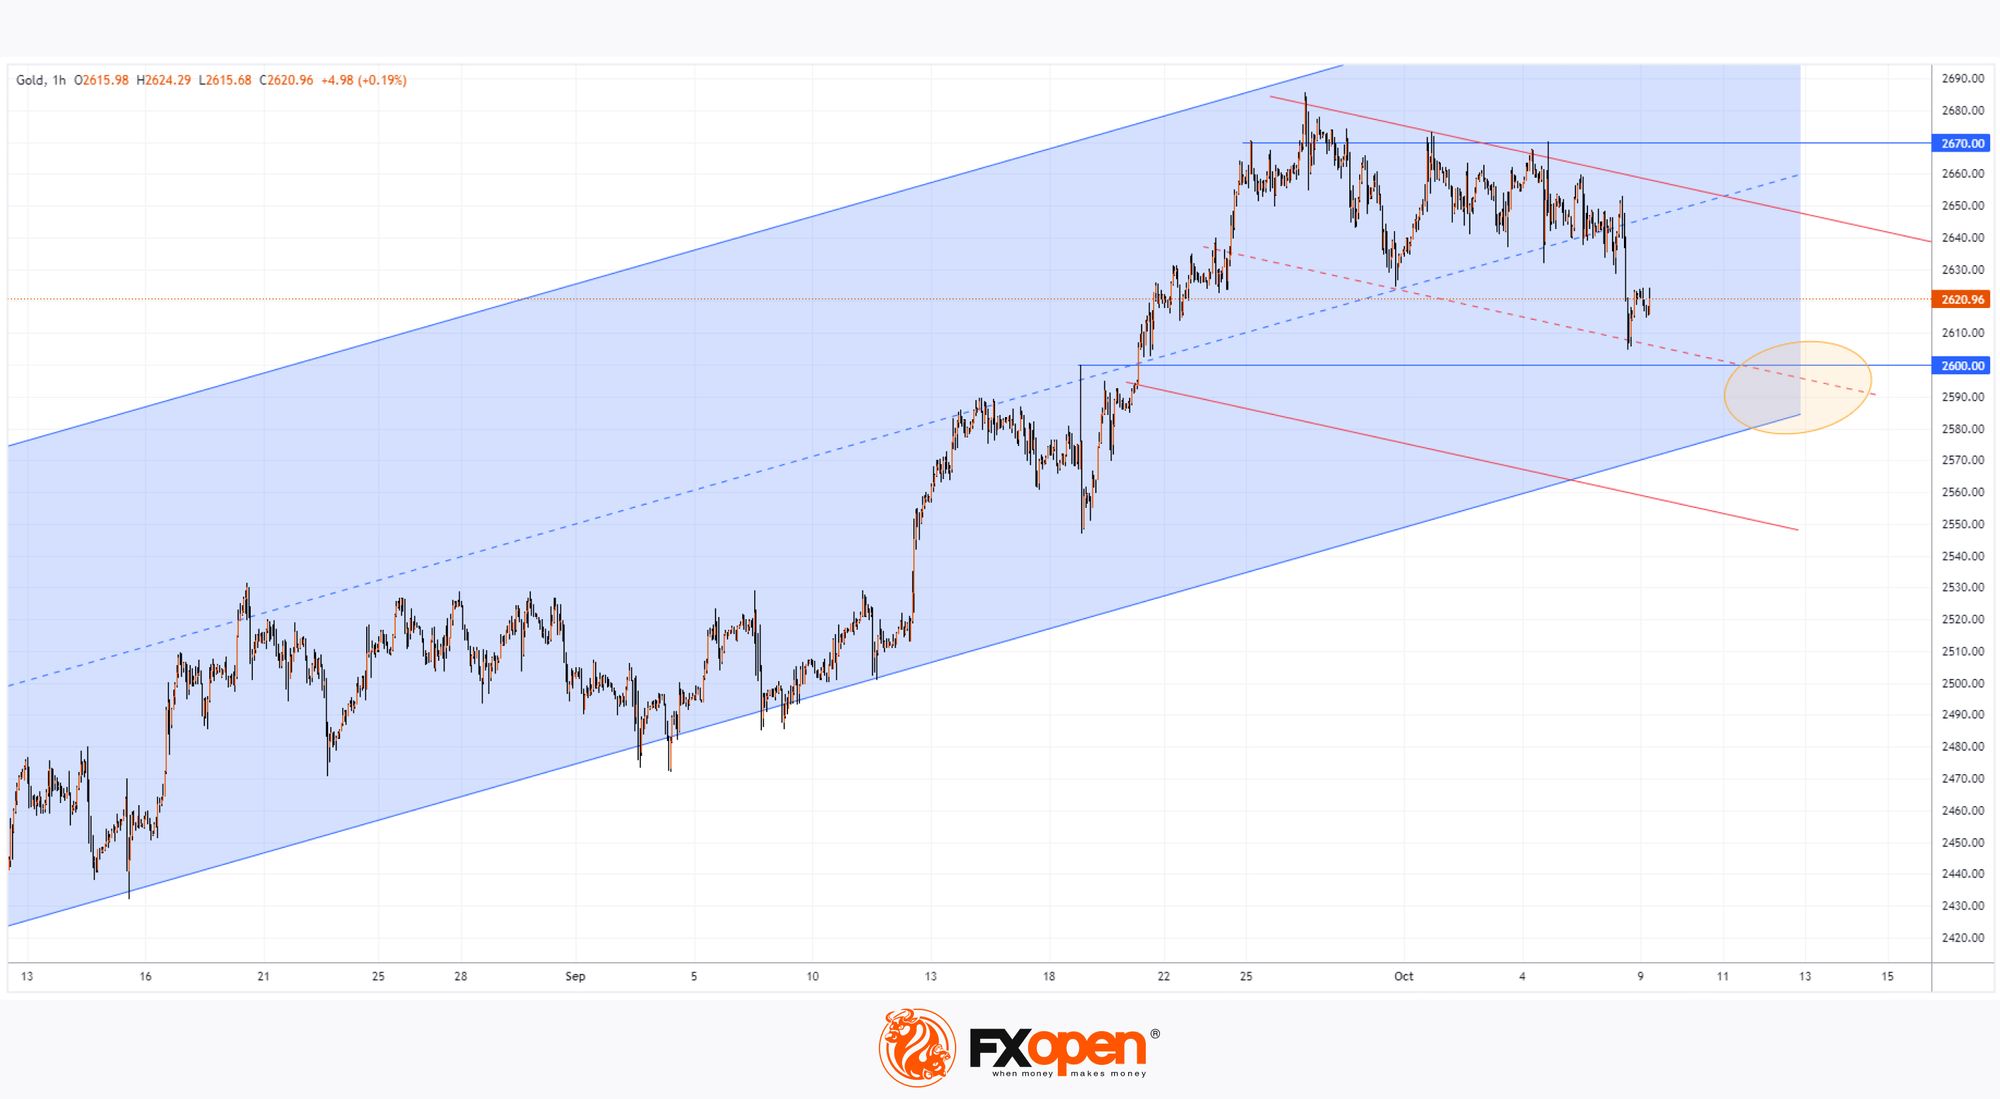
The technical analysis of the XAU/USD chart indicates that gold is still within the upward channel (shown in blue), which began in August 2024. However:
→ The gold price has broken below the median line of the blue channel.
→ The price decline from the historic peak reached on 26th September is forming a descending channel (shown in red), which can be considered a correction within the broader upward trend.
→ The $2670 level is showing signs of resistance, while the psychological level of $2600 could act as support, as seen during the bullish breakout in mid-September.
It is possible that bulls will attempt to resume the upward trend, using the area (marked by an orange circle) created by the following support levels:
→ The lower boundary of the blue channel.
→ The red channel line.
→ The psychological level of $2600.
Be prepared for potential volatility spikes. The FOMC meeting minutes will be released today at 21:00 GMT+3, which could trigger sharp movements in the gold price.
Start trading commodity CFDs with tight spreads (additional fees may apply). Open your trading account now or learn more about trading commodity CFDs with FXOpen.
This article represents the opinion of the Companies operating under the FXOpen brand only. It is not to be construed as an offer, solicitation, or recommendation with respect to products and services provided by the Companies operating under the FXOpen brand, nor is it to be considered financial advice.
Stay ahead of the market!
Subscribe now to our mailing list and receive the latest market news and insights delivered directly to your inbox.


Latest articles

AUD/CAD: Months of Indecision — Is a Breakout Finally Coming?
The Australian dollar has clawed back most of its end-of-June losses, when it touched three-month lows against the greenback amid escalating Middle East tensions. Since then, sentiment has improved: the RBA's Assistant Governor Sarah Hunter signalled the board stands ready

USD/JPY: Battling at the Top of the Triangle
On 3 July, Japan's Finance Minister, Satsuki Katayama, stated that the Ministry of Finance remains in close contact with US authorities regarding developments in USD/JPY as the yen traded near its weakest level in almost 40 years. Similar verbal

Dow Jones (DJIA): Consolidation Beyond the Trend
Federal Reserve Chair Kevin Warsh testified before Congress on 14–15 July, reaffirming the Fed's commitment to bringing inflation back to target while providing no clear guidance on the future path of interest rates. Meanwhile, June inflation data came in