


FXOpen

As the daily XAU/USD chart shows today, the ADX indicator is trending downwards following the extremely turbulent swings in October. This suggests:
→ gold price volatility is decreasing;
→ the market is finding balance around the psychological $4,000 level;
→ it recalls mid-July, when we noted a period of reduced volatility.
At that time, we:
→ drew an ascending channel;
→ observed that supply and demand were balancing each other, effectively reflecting all factors influencing the price.
Looking back, it can be noted that the market was in a consolidation phase (A) before the rally resumed (B) with renewed strength, as the price broke through the R1 resistance of the consolidation pattern.
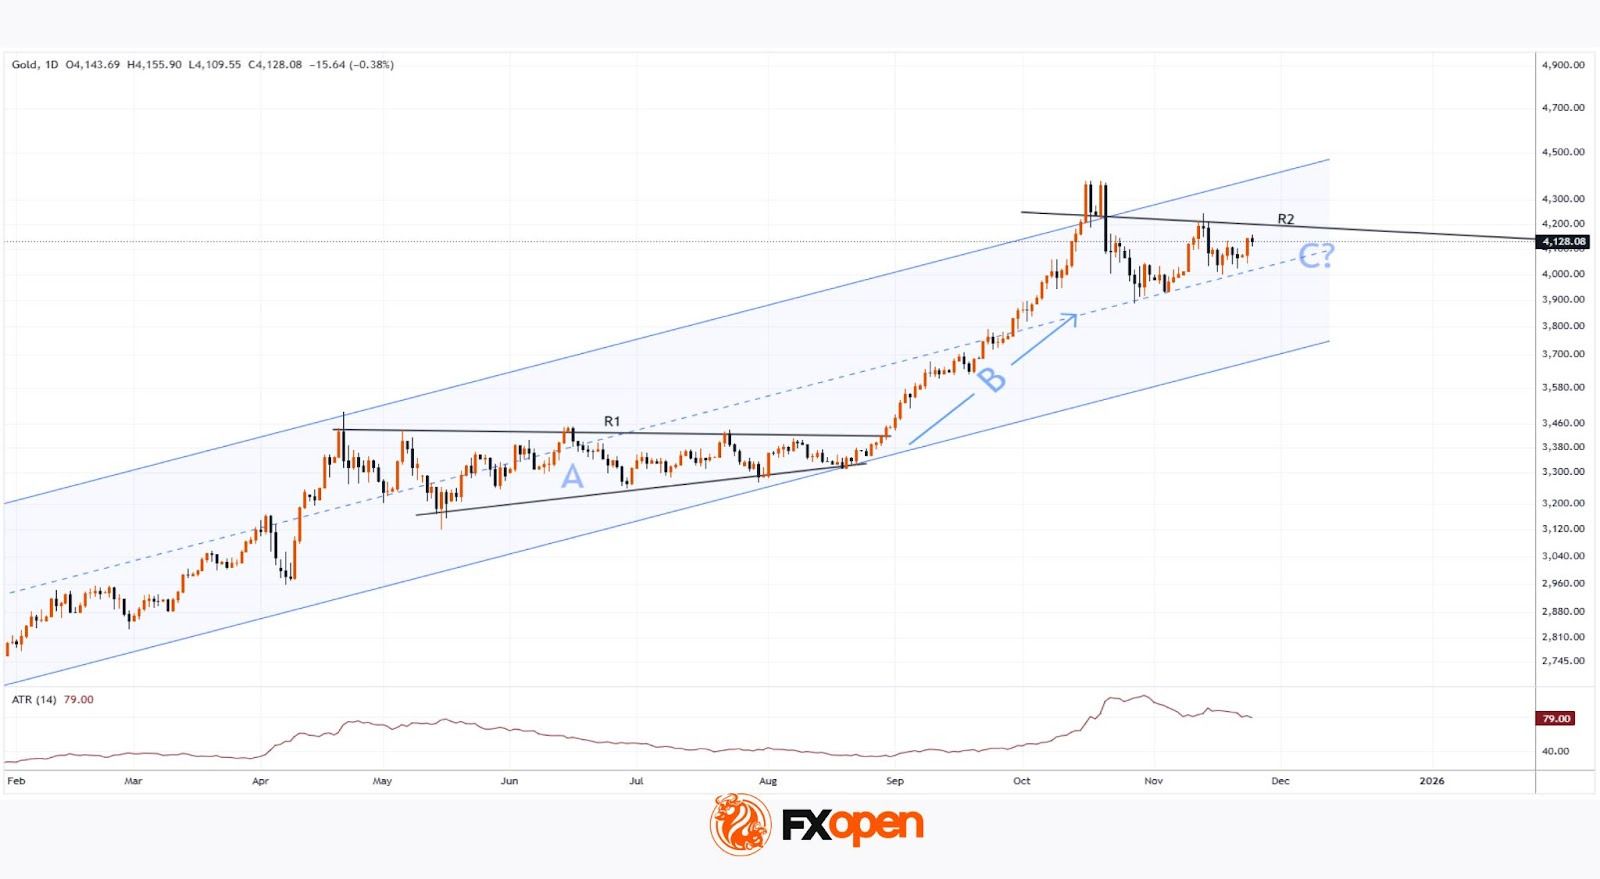
It is reasonable to suggest a similar scenario may be occurring now, with the market in a new consolidation phase (C), and price fluctuations around the psychological $4,000 level reflecting new factors, including:
→ Anticipation of Fed action: Traders are hesitant to push prices to new highs ($4,400) without assurances of further monetary easing, yet are reluctant to sell below $3,900, as the global rate-cut cycle is not yet complete.
→ Dollar strength (DXY) at the end of October – early November.
→ Stabilisation of the geopolitical backdrop.
According to analysts from JPMorgan, Goldman Sachs, and independent experts, gold may remain within a range of $3,950 – $4,150 until the end of 2025.
By analogy with the previous situation, we can expect R2 to hold, with bulls “taking a break” while gold drifts towards the lower boundary of the current channel.
Start trading commodity CFDs with tight spreads (additional fees may apply). Open your trading account now or learn more about trading commodity CFDs with FXOpen.
This article represents the opinion of the Companies operating under the FXOpen brand only. It is not to be construed as an offer, solicitation, or recommendation with respect to products and services provided by the Companies operating under the FXOpen brand, nor is it to be considered financial advice.
Stay ahead of the market!
Subscribe now to our mailing list and receive the latest market news and insights delivered directly to your inbox.


Latest articles

Tesla (TSLA) Shares Surge Following Musk’s Announcements
According to the chart, Tesla (TSLA) shares had been under significant pressure since the start of 2026: from their December high, they had lost around 25% of their value. The main bearish drivers included:
→ Intense competition from Chinese automakers, particularly

XTI/USD Analysis: WTI Oil Prices Under Pressure from Trump’s Statements
Yesterday, following a false bullish breakout above the psychological $100 level, WTI crude prices fell sharply towards the $85 area. The primary driver of this rapid decline was comments made by the US President.
According to Donald Trump:
→ the United
