


How to Measure the Trend Strength with the Average Directional Index?
FXOpen
While identifying the direction of a trend is important, knowing how strong that trend is can provide an additional edge. This is where the average directional index (ADX) comes into play. The ADX is a technical analysis tool that helps traders gauge the strength of a trend, regardless of whether the market is moving up or down. In this article, we'll explore what the ADX indicator is, and how to use it to measure trend strength, enhance your trading strategies, and make more confident trades.

What Is an Average Directional Index?
ADX, the average directional index or average directional movement index, is a technical tool developed by J. Welles Wilder in the 1970s to measure the strength of a trend. It ranges from 0 to 100, with higher values indicating a stronger trend and lower values signalling a weaker one. Unlike many technical analysis tools that focus on the direction of price movement, the ADX focuses solely on the trend's intensity. It works in conjunction with two other lines, the positive directional indicator (+DI) and negative directional indicator (-DI), to provide a more complete picture of market dynamics. A rising ADX suggests increasing trend strength, while a falling one may indicate weakening momentum.
The ADX can be used on a chart of any asset and on any timeframe. So that you can use the ADX as a stock indicator or forex tool.
The average directional index formula is highly complicated, so it’s better to use the indicator on the TickTrader platform, as this places it on the chart automatically.
How Can You Read the ADX Technical Indicator?
The index consists of a single line that fluctuates within a 0-100 range. Its values reflect the strength of market momentum. The common concept is:
If the index is below 25, there is a weak or no trend. It can fall below 25 when the price corrects or when the market is near to reverse. Therefore, traders should be cautious when seeing this signal.
If the index is above 25, there is a strong trend. The strength can also be divided into three stages: strong, very strong, and extremely strong. Look at the table below:
Note: It’s vital to remember that the index doesn’t reflect the trend direction, so it can fall in a bullish trend and rise in a bearish trend.
How to Use the ADX Indicator
There are several ways you can utilise the ADX system trading. Using these methods you can develop your own ADX trading strategy.
Note: Although the standard setting of the index is a period of 14, traders can lower the period to 7 and increase it to 30. The shorter the period, the more frequent the signals are. This allows traders to open positions more often, which can help when trading on higher timeframes. An average directional index with a longer period reduces market noise but provides delayed signals. It can be helpful to filter signals on shorter-term timeframes.
In the examples below, we use a period of 14 for an hourly chart and a period of 8 for daily and 4-hour charts.
Trend Strength
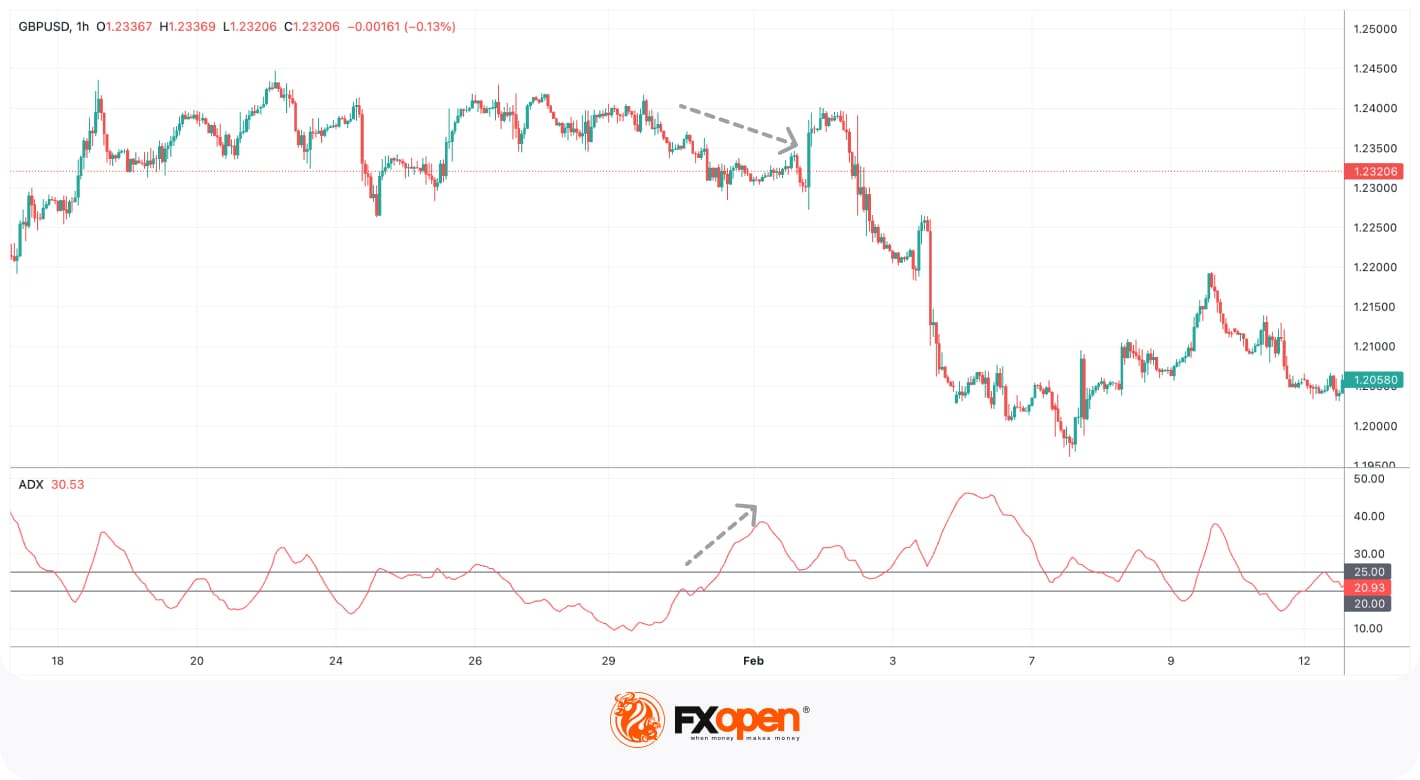
In the chart above, the price was fluctuating, and the average directional index was ranging around the 20-25 area over the second half of January. Once a downtrend started forming, the index stuck at above 25. A trader could have used this signal to open a sell position. Until the indicator fell below 20, a trader could believe the trend was in strength.
Trend Momentum
The ADX can help long-term traders to gauge the overall market momentum. The theory assumes that when the price continues moving in a solid trend, but the index forms lower highs and falls below 25, it’s a sign of a weakening momentum, so the market may reverse or pause for a while.
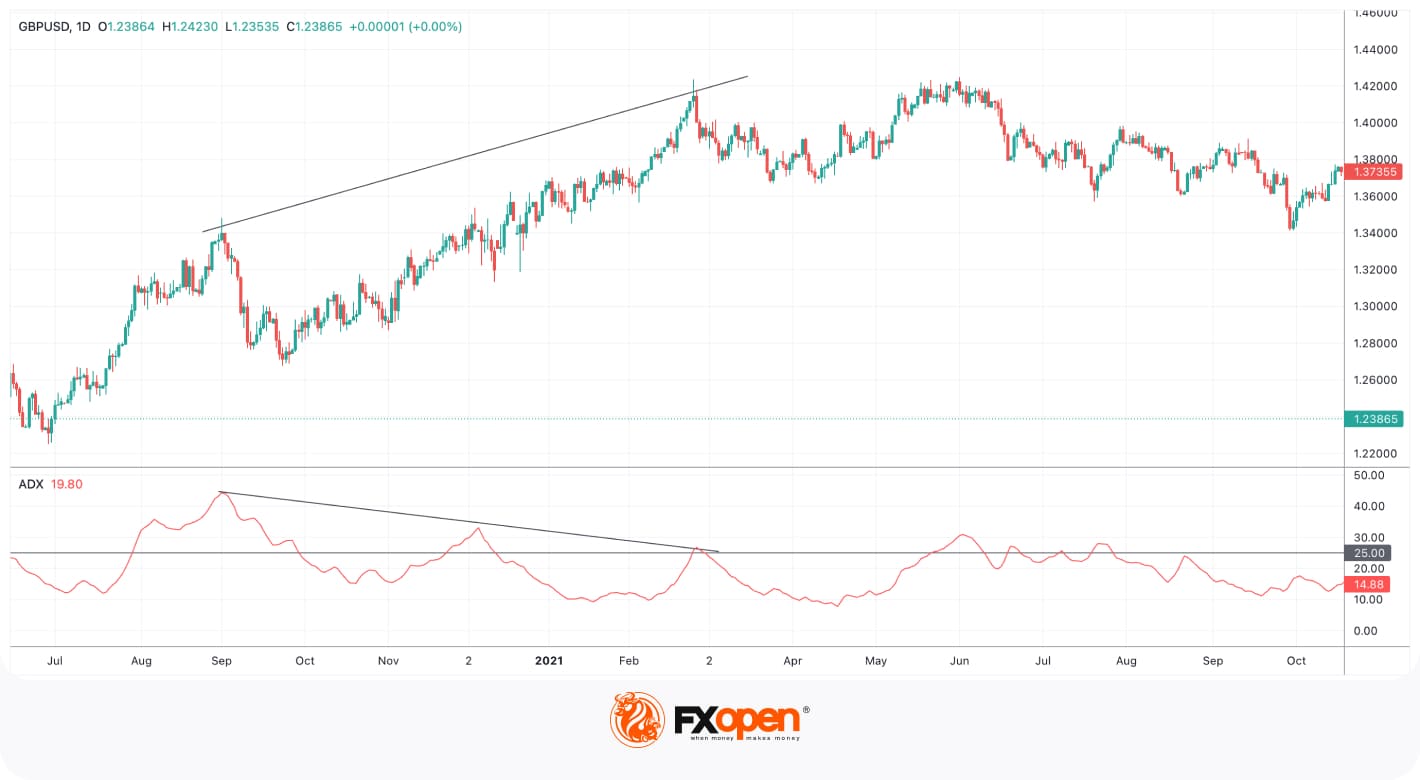
In the chart above, the price formed a higher high, but the indicator declined and fell below 25. After that, the trend started correcting. The signal wouldn’t work if the index declined but didn’t break below 25.
Note: If the indicator forms lower highs, it doesn’t necessarily mean that the price momentum is weakening. If you have a closer look at the examples above, you will notice that the indicator moves relative to recent price movements. If the price sets an extreme peak but then continues moving in the same direction but at lower levels, the ADX will decline. However, this won’t mean a market reversal.
Range Trading
As the average directional index can reflect periods with a weak or no trend, it can be used for range trading.
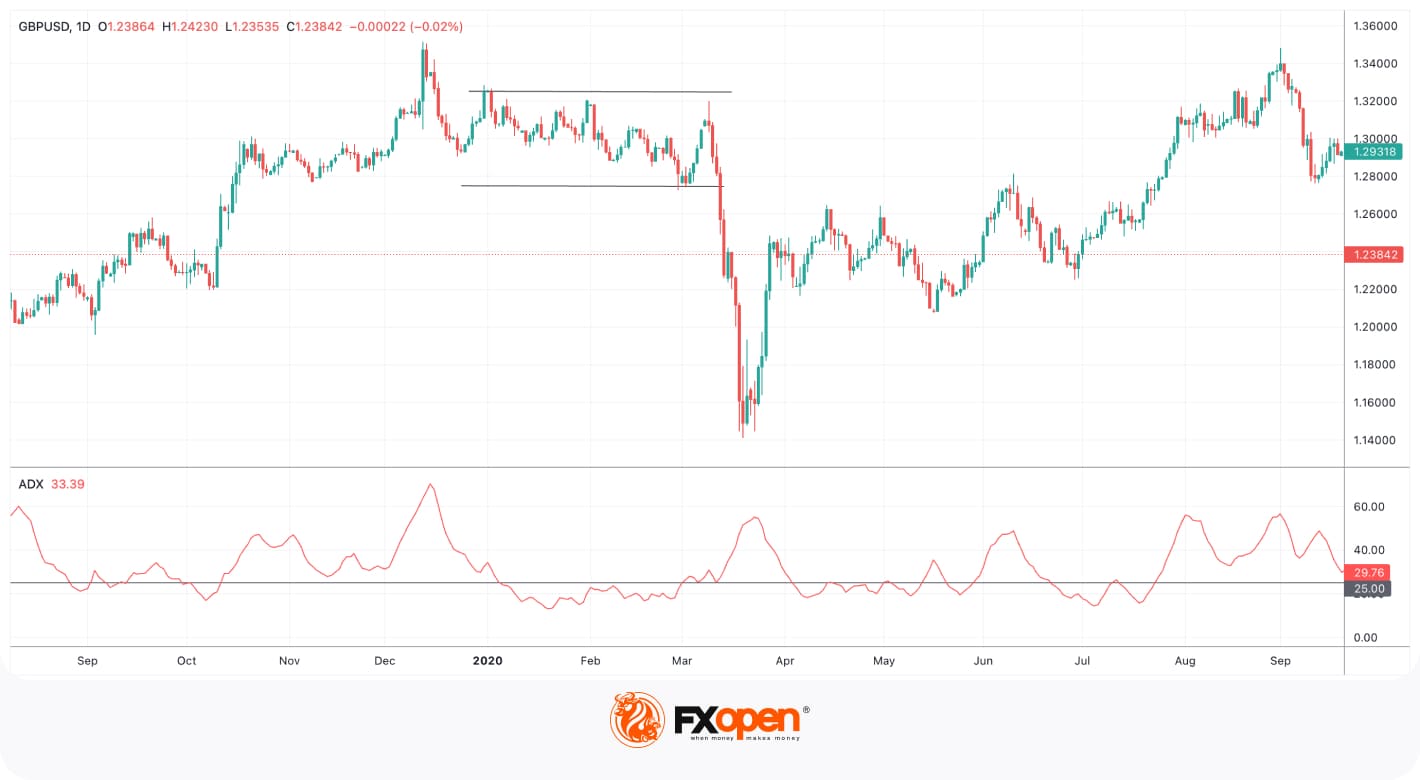
The chart above shows that the GBPUSD pair was trading within a narrow range, and the indicator was fluctuating below 25. When the price broke below the lower bound of the range, the indicator was already above 25. A trader could use the index to confirm the reliability of the breakout.
Exit Points
The indicator can also be used for medium-term trading or for partial position closure. The theory says that once the ADX reaches its peak and declines, a trader can consider closing their position (1).
A decline in the indicator usually alerts traders to a change in the price direction. So, if a trader considers medium-term trading, it’s an opportunity to exit the market with the largest potential return. If a trader considers longer-term trading in a solid trend, they can use the ADX to partially close trades. Every time the indicator sets a new peak and decline, the trader could close a trade.
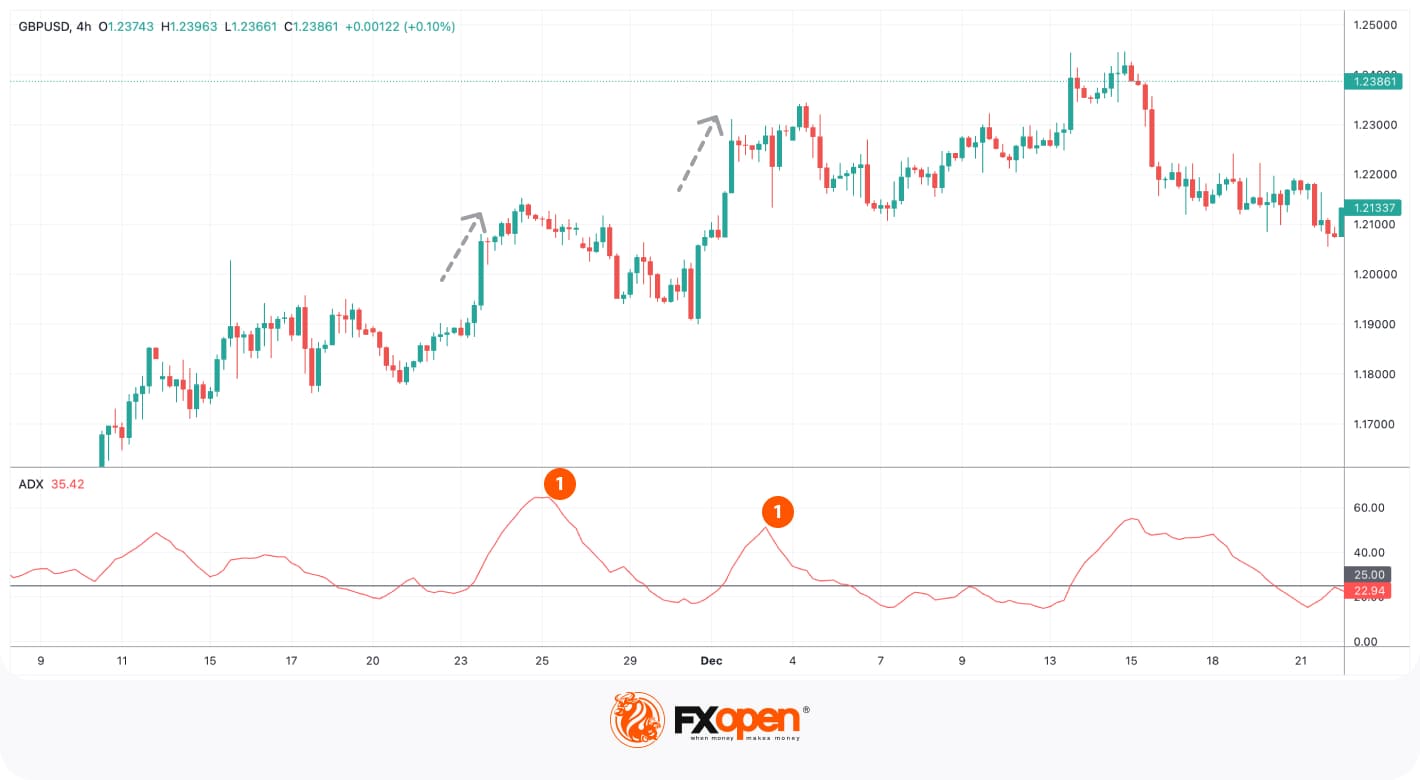
In the chart above, the ADX formed two significant highs in a solid uptrend, so a trader could close a trade partially to continue trading in a strong trend.
Note: It will require a lot of practice to find settings that allow you to limit the number of incorrect signals if you plan long-term trading. There is a free option with numerous technical analysis tools – the TickTrader platform.
Trend Direction
As the average directional index doesn’t reflect the market direction, it is commonly used with +DI (+DMI) and –DI (-DMI) lines. This combination stands for the directional movement index technical analysis tool. It’s worth noticing that the ADX indicator is considered a more comprehensive tool when it’s combined with +DI (+DMI) and –DI (-DMI) lines.
The ADX crossover rule is: when the +DI is above the -DI, the market moves up. The average directional index can confirm the strength of the rise. Conversely, when the +DI is below the -DI, the market moves down. A rising ADX confirms the strength of the decline.
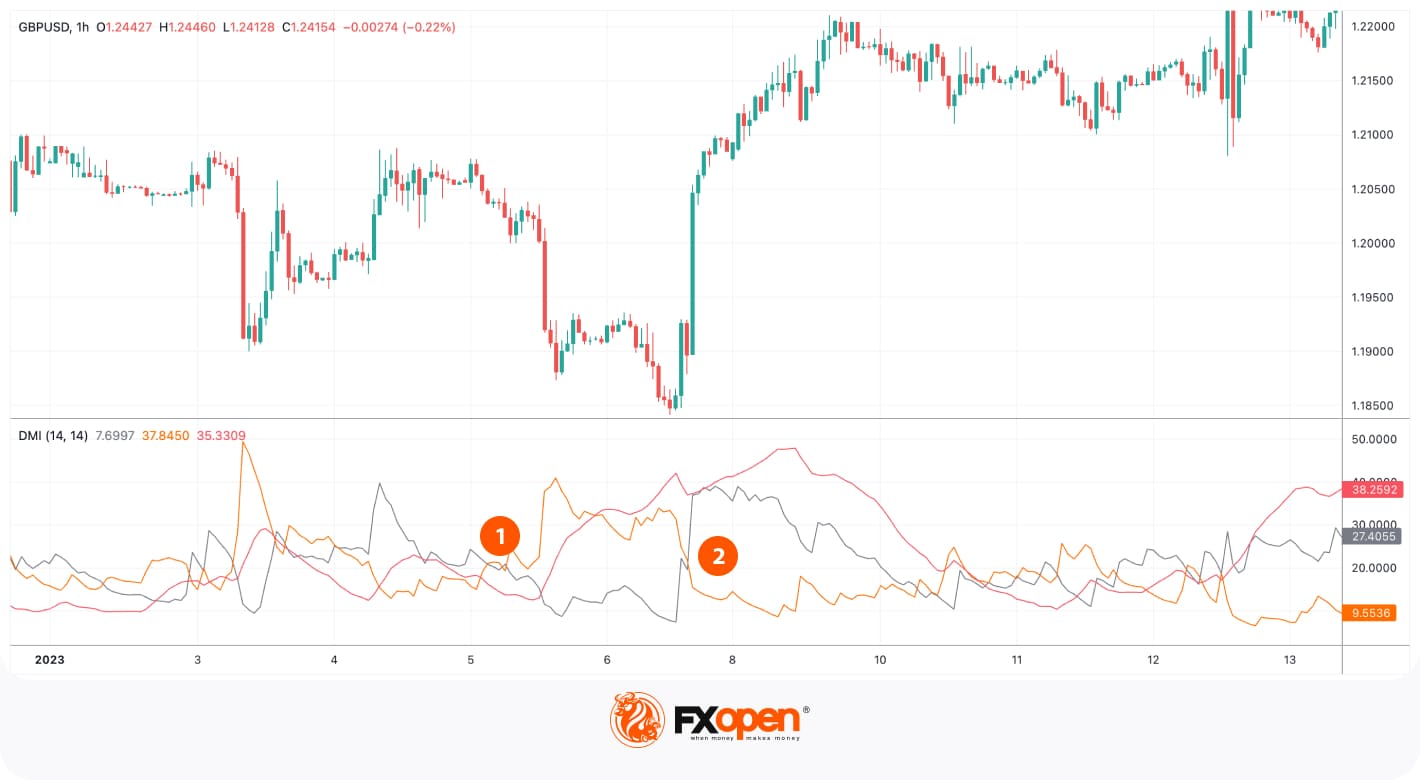
In the chart above, the +DMI (grey) was above -DMI (orange), but the index was below 20 (1). Although the price rose, it stopped soon afterwards. After that, the +DMI fell below -DMI and the average directional index rose above 25. This was a sign of a significant decline. Later, the +DMI broke above -DMI and the ADX was still above 25, so the price surged (2).
Limitations of the Average Directional Index
The average directional index is a useful tool. However, it has limitations that should be considered before you enter a live market.
It Doesn’t Work for Position Trading
Although the average directional index reflects the trend strength and a change in its momentum, it provides confusing signals when used on high timeframes. The ADX constantly moves up and down, so it’s challenging to identify whether the price direction changes or it’s a short-term correction.
Also, traders may be confused when spotting a trend. As the price fluctuates within a trend, bouncing between support and resistance levels, constant changes in the ADX value may cause traders to make incorrect decisions regarding the market direction.
It Requires Constant Changes in Parameters
Unlike indicators such as the relative strength index and the stochastic oscillator, the average directional index doesn’t work equally well with a single parameter on all timeframes of any asset. Traders spend lots of time searching for the settings that will work for their unique trading strategies.
False Signals
Although some traders believe the ADX is more effective when used with +DMI and –DMI lines, others claim this combination is ineffective. First, it’s not easy to distinguish between the lines, so traders may be confused by various signals. Second, +DMI and –DMI frequently provide incorrect alerts. Still, these reasons are subjective. There are technical analysis tools that have more lines; for instance, the Ichimoku Kinko Hyo has more lines that have difficult names, but it is considered one of the most popular tools. Also, the frequency and reliability of signals can be managed by changing the settings.
You can decide on the effectiveness of the ADX together with +DMI and –DMI lines on the TickTrader trading platform for free.
How Can You Confirm ADX Signals?
To confirm signals from the ADX trend indicator, traders typically combine it with other technical tools to improve trading decisions.
Using ADX with Price Action
Traders often look for price action patterns like breakouts, pullbacks, or reversals to confirm the signals generated by the average directional index. If it is rising above 25 and the price breaks a key support or resistance level, this can indicate a strong trend. Similarly, if the index is declining and price moves within a tight range, this could confirm a lack of a trend or range-bound trading.
Confirming with Other Technical Indicators
ADX can be used in combination with other technical indicators like moving averages, awesome oscillator, or MACD. For instance, if the index confirms a strong trend while an MACD divergence appears, it can signal that although the trend is strong, a potential reversal or weakening is on the horizon.
Final Thoughts
The average directional index is one of the most frequently used tools for identifying a trend strength. It can’t be called the simplest, as although its signals are straightforward, a trader will need to adjust its settings to increase the effectiveness of the ADX indicator strategy. However, you can open an FXOpen account today to test various ADX trading strategies on over 700 markets with more than 1,200 trading tools.
FAQ
What Is the ADX Indicator?
The average directional index (ADX) meaning refers to a technical indicator used to measure the strength of a trend, regardless of whether it’s an uptrend or downtrend. It helps traders identify if the market is trending or if it’s in a consolidation phase. The ADX is part of the Directional Movement System, which also includes the positive directional indicator (+DI) and negative directional indicator (-DI). The index value ranges from 0 to 100, with readings above 25 typically indicating a strong trend and readings below 25 suggesting weak or non-existent trends.
How to Read the ADX Indicator?
To read the average directional index, focus on the numeric value of the ADX line and how it interacts with the +DI and -DI lines:
- Values above 25 signal a strong trend.
- Values below 25 indicate a weak trend or range-bound market.
- +DI above -DI signals a potential uptrend, while -DI above +DI suggests a downtrend. A rising ADX confirms increasing trend strength, while a falling one suggests weakening momentum.
How to Use the ADX Indicator for Day Trading?
In day trading, the average directional index helps identify strong trends to follow. Traders look for values above 25 to confirm a trending market and avoid low readings, which point to sideways or choppy markets. They combine the index with other indicators or price patterns for better entry and exit signals.
This article represents the opinion of the Companies operating under the FXOpen brand only. It is not to be construed as an offer, solicitation, or recommendation with respect to products and services provided by the Companies operating under the FXOpen brand, nor is it to be considered financial advice.
Stay ahead of the market!
Subscribe now to our mailing list and receive the latest market news and insights delivered directly to your inbox.


Latest articles

EUR/USD: All Eyes on the Fed as the Range Reaches Its Breaking Point
The dollar's next move hinges on tonight's Fed decision, and this time markets genuinely don't know what to expect. While economists still lean toward a hold—with CME FedWatch odds sitting near 68.5% for no change—Kevin Warsh's hawkish

USD/JPY and USD/CAD Test Resistance Ahead of Fresh Fed Signals
The US dollar continues to hold the upper hand against most major currencies ahead of the outcome of the latest Federal Reserve meeting. While the base-case scenario remains for interest rates to stay unchanged, markets are also pricing in the

Amazon Earnings: Does the Chart Already Know Something the Numbers Don't?
All eyes are on July 30, when Amazon reports Q2 2026 earnings, with Wall Street increasingly convinced the bar has been set too low. Consensus sees EPS near $1.82-$2.26 on roughly $197 billion in revenue, but the