


XAU/USD Chart Analysis: Bulls Break Important Resistance
FXOpen

When analysing the XAU/USD chart last week, we:
→ noted that the ADX indicator had reached its lowest level since the beginning of 2025 – a clear sign of declining gold price volatility;
→ highlighted the formation of a large-scale triangle with its axis around the $3,333 level, bounded by a resistance line (marked in red) and the lower boundary of the ascending channel.
Since then, the price has climbed above $3,400 – reaching its highest level since mid-June. According to media reports, the uptick in demand may be driven by escalating geopolitical risks, renewed optimism regarding potential monetary policy easing in the US, and consistent gold buying from central banks.
This suggests that the balance has shifted in favour of the bulls, who have made an attempt to break through the resistance line – an attempt that, so far, appears promising and points towards a potential resumption of the upward trend.
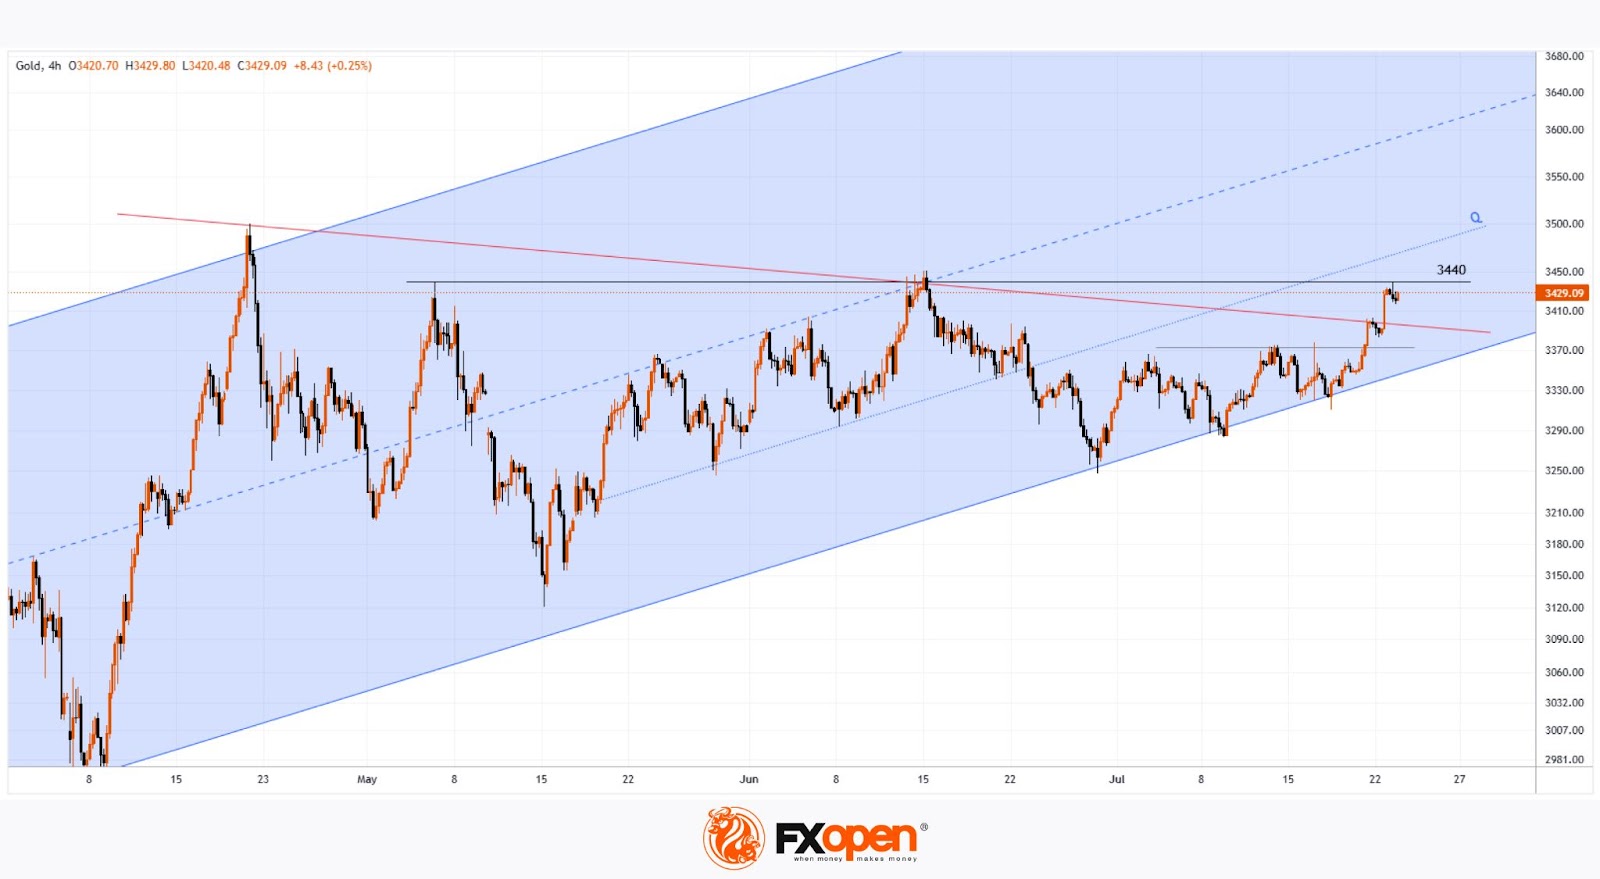
However, today's XAU/USD chart shows that the bulls are now facing a key resistance level at $3,440 – a level that has reversed gold prices downward both in May and June. What will happen in July?
It is possible that, following a prolonged consolidation near the lower boundary of the channel, the bulls have built up sufficient momentum to finally break through this critical level and push gold prices towards line Q, which divides the lower half of the long-term channel into two quarters.
Start trading commodity CFDs with tight spreads (additional fees may apply). Open your trading account now or learn more about trading commodity CFDs with FXOpen.
This article represents the opinion of the Companies operating under the FXOpen brand only. It is not to be construed as an offer, solicitation, or recommendation with respect to products and services provided by the Companies operating under the FXOpen brand, nor is it to be considered financial advice.
Stay ahead of the market!
Subscribe now to our mailing list and receive the latest market news and insights delivered directly to your inbox.


Latest articles

Nasdaq 100 Analysis: Is This The Beginning of a Deeper Correction?
As the chart shows, the Nasdaq 100 (US Tech 100 Mini on FXOpen) is down more than 6% from its recent highs, with Friday, 6 June, standing out as the defining session: a single-day loss of approximately 4.74% marked

Sterling at Key Levels as Investors Assess UK Economic Outlook
The British pound is maintaining a cautious tone following a period of elevated volatility, with market participants now focused on key upcoming UK economic data releases. Both GBP/USD and GBP/JPY are consolidating near important technical levels as investors

EUR/USD: ECB Meeting and Interest Rate Expectations
On 11 June, the ECB is holding the second day of its Governing Council meeting. The interest rate decision will be announced at 14:15 CET, followed by a press conference by Christine Lagarde at 14:45 CET. Markets are