


FXOpen

Following Israel's military operation in Lebanon, Iran launched a missile strike on Israel on October 1. Financial markets reacted sharply as soon as the first reports of the attack emerged:
→ U.S. stock indices dropped significantly, and Bitcoin also fell, with BTC/USD nearing the psychological $60,000 mark at yesterday's low.
→ Gold surged to $2670, though supply forces have since curbed the panic buying, and XAU/USD has dropped back below $2650.
Oil prices also spiked. Unlike other financial assets, there has been no correction on the XBR/USD chart today, despite the end of the missile strike on Israel. This highlights oil's heightened sensitivity to Middle Eastern tensions.
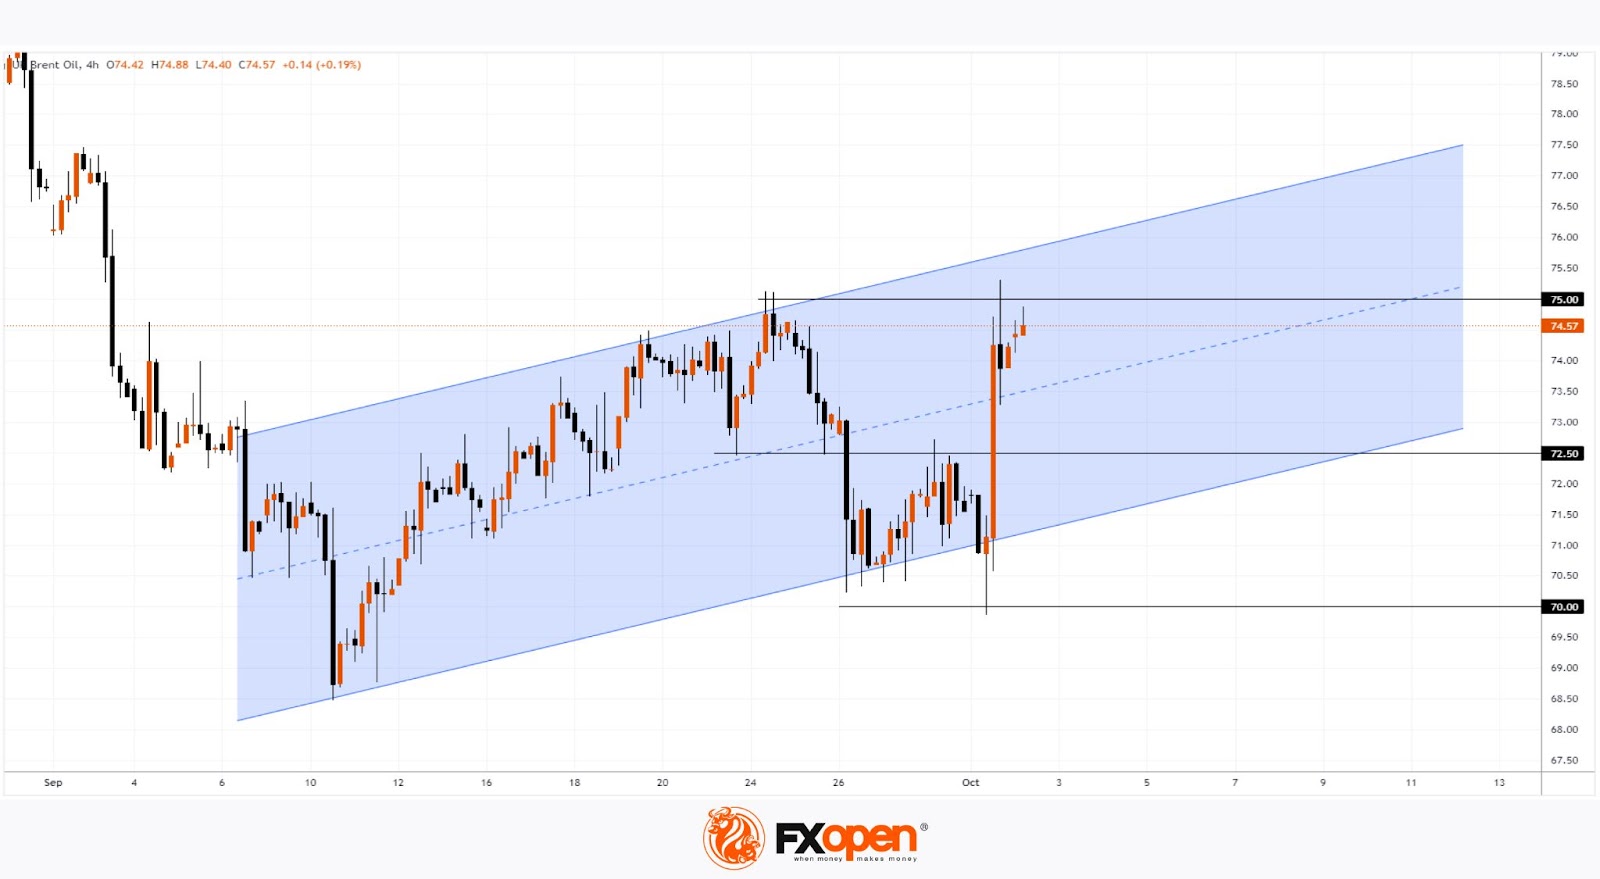
According to today’s technical analysis of XBR/USD:
→ Brent oil price movements have formed an upward channel (shown in blue), beginning in early September. Following the news of the missile attack, the price has climbed into the upper half of the channel.
→ Interestingly, just before this surge, the price had hit a multi-week low with a false bearish breakout below the psychological $70 per barrel level.
Given Israel’s vow to retaliate for Iran's strike, it’s reasonable to assume that oil demand may remain high, potentially pushing XBR/USD towards the upper boundary of the channel, surpassing the current resistance at $75.
Brent oil could find support at the median line of the blue channel and the $72.50 level.
Start trading commodity CFDs with tight spreads (additional fees may apply). Open your trading account now or learn more about trading commodity CFDs with FXOpen.
This article represents the opinion of the Companies operating under the FXOpen brand only. It is not to be construed as an offer, solicitation, or recommendation with respect to products and services provided by the Companies operating under the FXOpen brand, nor is it to be considered financial advice.
Stay ahead of the market!
Subscribe now to our mailing list and receive the latest market news and insights delivered directly to your inbox.


Latest articles

Market Analysis: GBP/USD Dips Further As EUR/GBP Regains Traction
GBP/USD failed to climb above 1.3500 and corrected some gains. EUR/GBP started a decent increase and might aim for more gains above 0.8700.
Important Takeaways for GBP/USD and EUR/GBP Analysis Today
· The British Pound


Market Insights with Gary Thomson: Oil, US Retail Sales & NFP in Focus
In this video, we’ll explore the key economic events and market trends, shaping the financial landscape. Get ready for insights into financial markets to help you navigate the week ahead. Let’s dive in!
In this episode of Market