


FXOpen
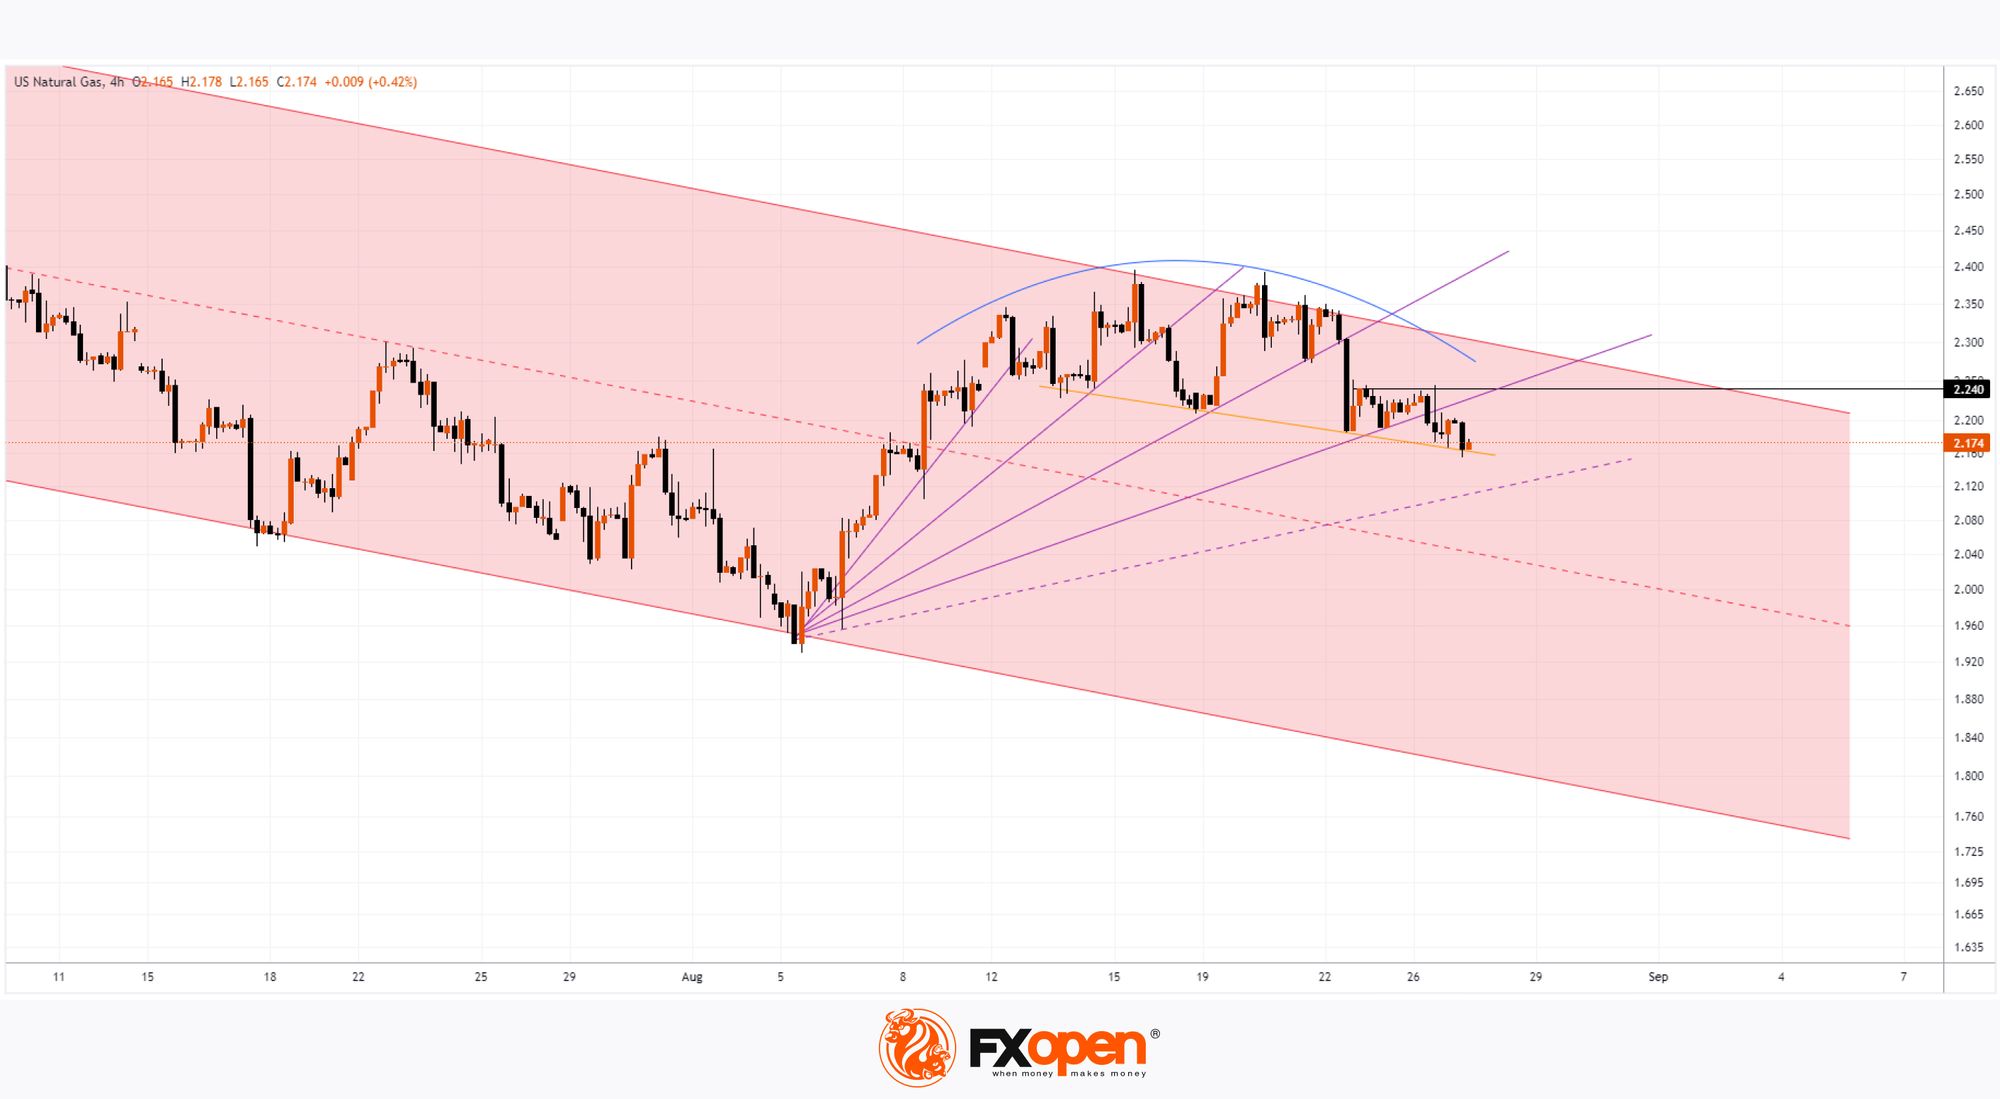
As shown on the XNG/USD chart, today, the price of natural gas fell below $2.16 for the first time since 8 August.
Bearish sentiment is being driven by the fact that: → This is the last week of summer. Gas consumption typically decreases in mid-September as the use of air conditioning declines; → Gas storage levels are abundant. According to Reuters, current stock levels exceed the seasonal average by 12%.
A technical analysis of the XNG/USD chart provides several arguments suggesting that bears hold the upper hand in the market:
→ Price action is forming a descending channel, shown in red. The upper boundary of the channel acted as resistance, with the price forming a bearish rounding reversal pattern (as indicated in blue).
→ After a large bearish candle on 22 August, the resistance level at $2.24 became more significant.
→ Support lines, forming a fan shape, are being broken one by one, with increasingly shallow angles indicating weakening demand.
Nevertheless, bulls have an opportunity to turn the situation around by using support from the trendline (shown in yellow) at least in the short term.
However, in the longer term, if the supply-demand balance remains unchanged, there is reason to believe that the price of natural gas on the XNG/USD chart may continue its downward trend within the red channel.
Start trading commodity CFDs with tight spreads (additional fees may apply). Open your trading account now or learn more about trading commodity CFDs with FXOpen.
This article represents the opinion of the Companies operating under the FXOpen brand only. It is not to be construed as an offer, solicitation, or recommendation with respect to products and services provided by the Companies operating under the FXOpen brand, nor is it to be considered financial advice.
Stay ahead of the market!
Subscribe now to our mailing list and receive the latest market news and insights delivered directly to your inbox.


Latest articles

European Currencies Decline: Pound Hits New Lows, Euro Under Pressure
European currencies continue to weaken against the US dollar amid rising geopolitical tensions and increased demand for safe-haven and liquid assets. Market participants are reducing exposure to riskier instruments, putting pressure on both the euro and the pound. Additional support

Market Analysis: GBP/USD Dips Further As EUR/GBP Regains Traction
GBP/USD failed to climb above 1.3500 and corrected some gains. EUR/GBP started a decent increase and might aim for more gains above 0.8700.
Important Takeaways for GBP/USD and EUR/GBP Analysis Today
· The British Pound
