


XTI/USD Chart Analysis: Oil Price Falls Below $60
FXOpen

Friday’s comments from President Trump about the potential introduction of 100% tariffs on trade with China pushed WTI crude oil below the $60 level for the first time in four months. The bearish sentiment stemmed from fears of a global economic slowdown amid escalating trade tensions between the world’s two largest economies.
The decline was further supported by news of peace efforts in the Middle East, which reduced the impact of geopolitical risk on oil prices.
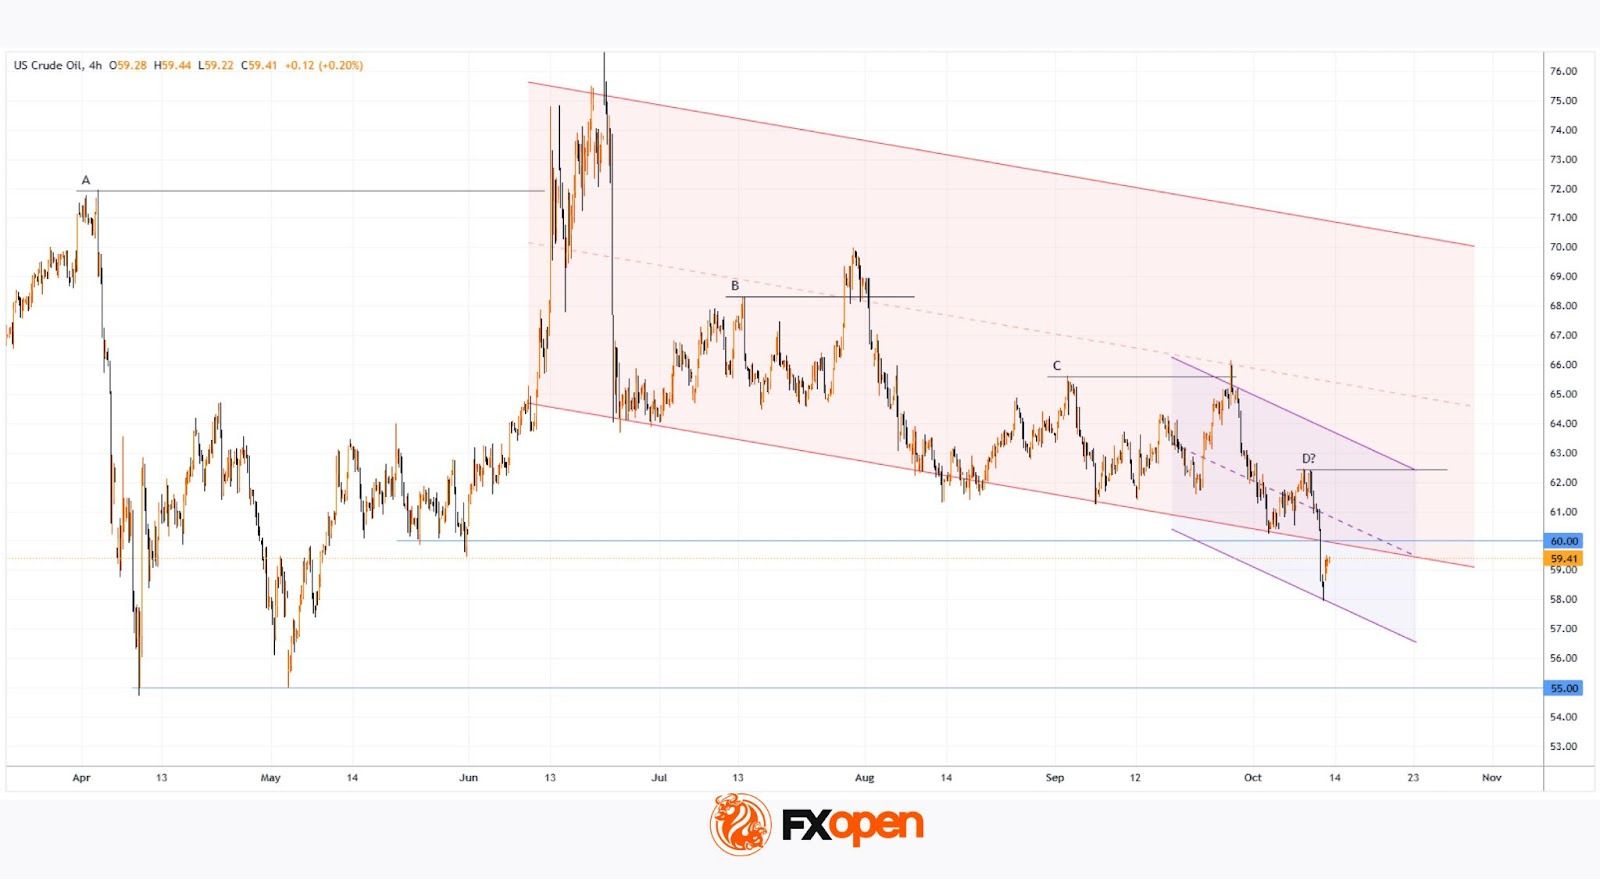
As the XTI/USD chart shows, WTI is currently trading below $60. How might the situation unfold next?
Technical Analysis of the XTI/USD Chart
In the long-term view, oil price movements (following the flare-up in the Middle East in June) have formed a descending channel shown in red — notably, the current price has fallen below its lower boundary.
In the shorter term, we can observe an acceleration of the decline, emphasised by the purple trajectory lines.
These observations suggest that selling pressure remains dominant, while any recovery attempts are likely to meet resistance near:
→ the psychological level of $60;
→ the lower boundary of the red channel;
→ the purple median line.
Given that the White House is reportedly in favour of lower oil prices (as a means of stimulating the US economy and exerting pressure on geopolitical rivals), WTI crude could drift towards the year’s low around $55.
However, from the demand-side perspective, it cannot be ruled out that the oil market, known for its false breakouts above previous highs (A, B, C), may repeat a similar move above peak D — a pattern that, in Smart Money Concept terms, would represent a liquidity grab.
Start trading commodity CFDs with tight spreads (additional fees may apply). Open your trading account now or learn more about trading commodity CFDs with FXOpen.
This article represents the opinion of the Companies operating under the FXOpen brand only. It is not to be construed as an offer, solicitation, or recommendation with respect to products and services provided by the Companies operating under the FXOpen brand, nor is it to be considered financial advice.
Stay ahead of the market!
Subscribe now to our mailing list and receive the latest market news and insights delivered directly to your inbox.


Latest articles

Nasdaq 100: 48 Hours of Chaos, One Trendline Standing in the Way
Wall Street just lived through one of its wildest 48 hours of the year. On Wednesday, the Fed held rates steady at 3.50%-3.75%, but three FOMC members broke ranks to demand a hike—an unusually hawkish dissent

Amazon Analysis: Strong Earnings Coincide with a Breakout from the Correction
On 30 July, Amazon.com reported its financial results for the second quarter of 2026, significantly exceeding market expectations. Revenue rose 20% year-on-year to $200.6 billion, compared with the consensus forecast of around $196.5 billion. The main growth

GBP/USD and EUR/GBP Await Key Bank of England Decision
The pound strengthened following the outcome of the US Federal Reserve meeting, where the central bank, as expected, kept interest rates unchanged. However, the Fed did not provide the market with clear signals of an imminent shift towards rate cuts,