


Retracements and Reversals: How Can You Distinguish Between Them?
FXOpen

In trading, distinguishing between retracements and reversals is crucial for risk management and overall trading effectiveness. This article explores these two key concepts, providing traders with insights on how to identify and respond to these different market movements. Let's delve into the intricacies of retracements and reversals and the difference between the two.

Understanding Trends
Let us remind you that market trends refer to the general direction in which the price of an asset is moving. Traders classify these trends as upward (bullish), downward (bearish), or sideways (range-bound).
Upward trends are characterised by higher highs and higher lows, indicating growing market confidence. Downward trends display lower highs and lower lows, signalling declining market sentiment. Sideways trends show horizontal movement, reflecting uncertainty or consolidation in the market. The trend concept is important, as it’s critical in establishing whether a move is a retracement or reversal.
Retracement: Definition
So, what is a retracement in trading? In the realm of financial markets, a retracement refers to a temporary turnaround in the direction of an asset’s price that goes against the prevailing trend.
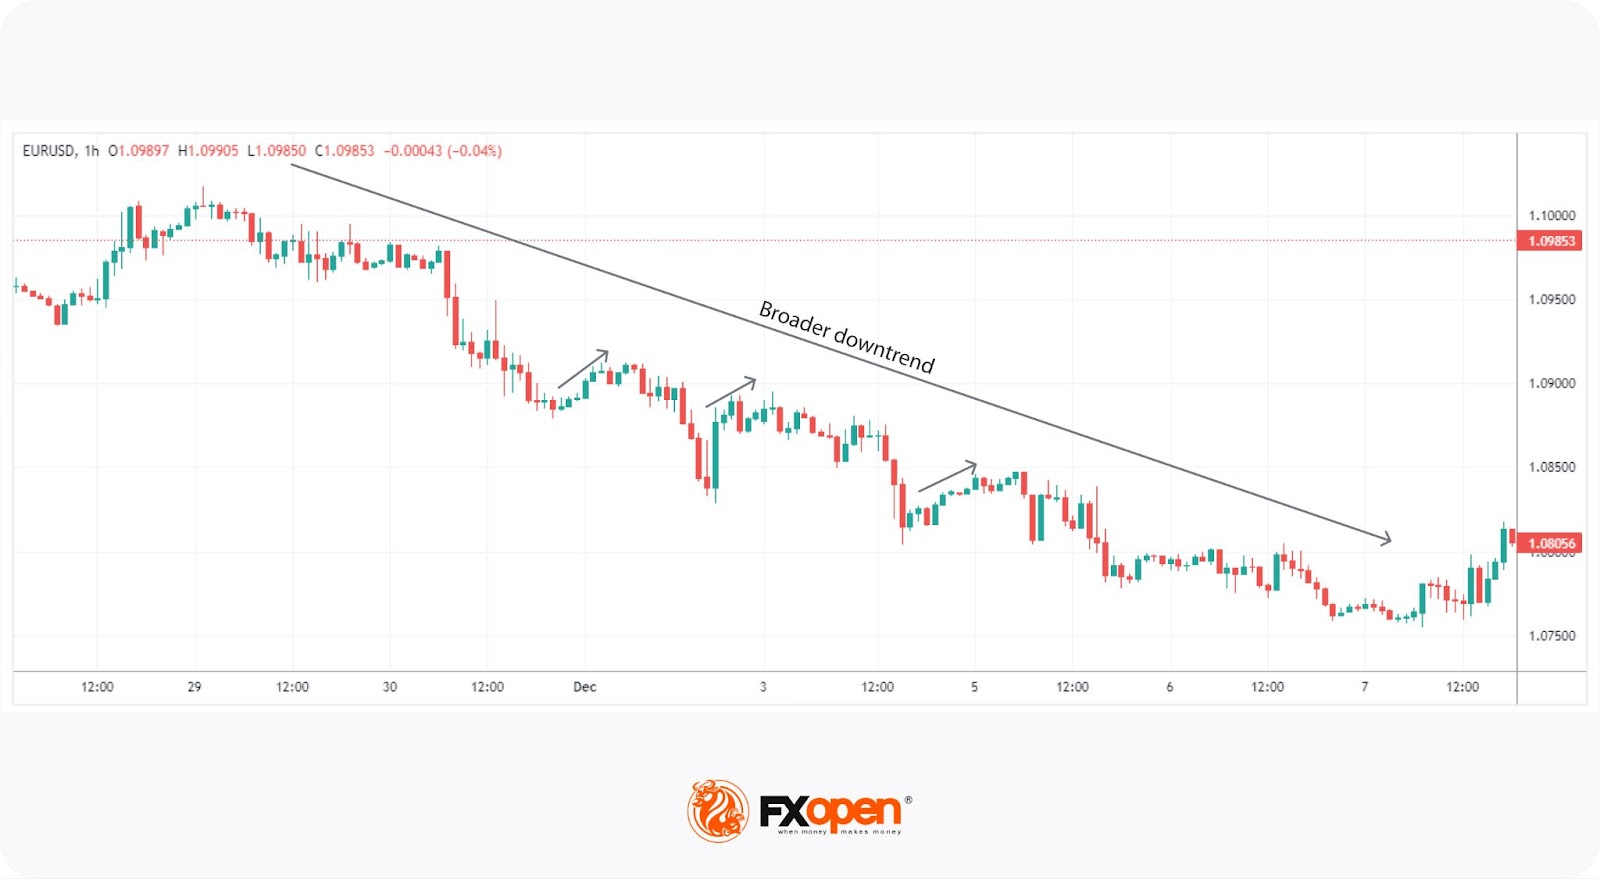
For example, in an uptrend, a retracement might see the asset falling slightly before it resumes its upward trajectory. Similarly, in a downtrend, it may temporarily rise before continuing its descent.
Retracements are considered natural and healthy corrections, offering traders opportunities to enter the market at more favourable prices, assuming the larger trend will resume.
Importantly, a retracement generally won’t break the broader trend’s structure. In a bullish retracement, for instance, the price won’t typically fall below the last higher low before continuing the uptrend.
Reversal: Definition
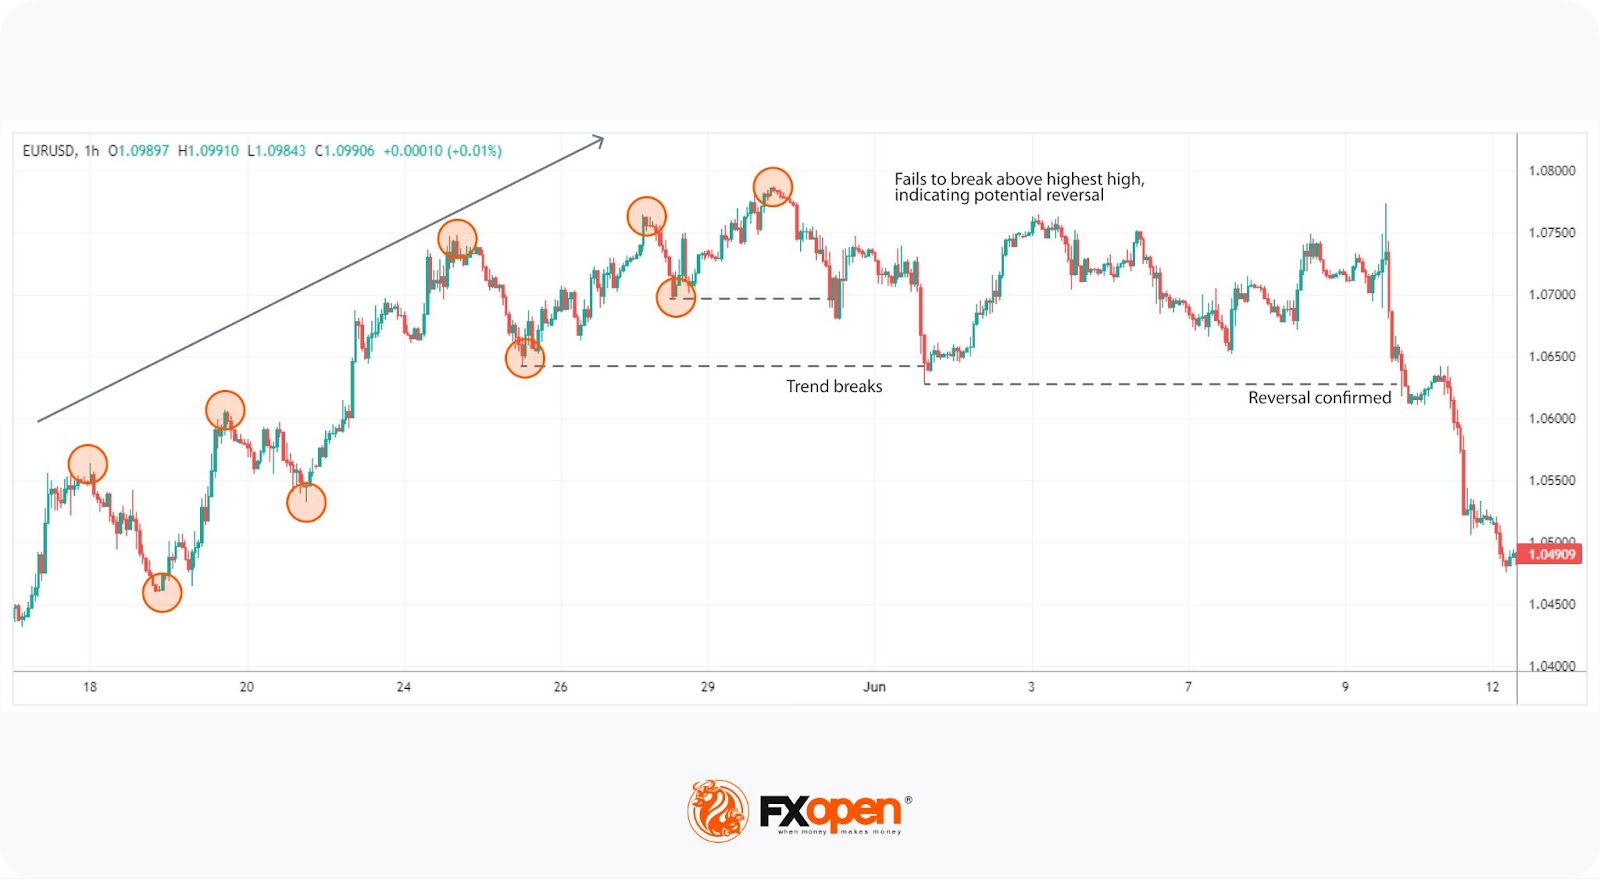
In contrast to retracements, meaning a temporary blip against the current trend, reversals signify a fundamental change in the direction of a trend. A reversal occurs when the price movement shifts so significantly that it alters the established structure, indicating a change in sentiment.
For instance, in an upward trend, a reversal would be characterised by the price making lower lows and lower highs, diverging from the previous pattern of higher highs and higher lows, as seen in the example of a reversal above. This shift reflects a transition from bullish to bearish sentiment. Conversely, in a downward trend, a reversal is marked by higher highs and higher lows.
Identifying these turning points is critical for traders, as they indicate a potential long-term change in direction, allowing us to establish a new directional bias. Unlike pullbacks, reversals reflect a substantial shift in investor outlook and often lead to a new trend formation.
Key Differences Between Retracements and Reversals
Retracements and reversals may appear similar at first glance, but they serve very different roles in trading. Understanding their distinctions is essential for effective market analysis.
- Duration: Retracements are short-term pauses or corrections within a trend, whereas reversals indicate a long-term change in the trend’s direction.
- Impact on Trend Structure: Retracements temporarily disrupt a trend without altering its overall direction, while reversals lead to a complete shift in the trend and redefine the market’s course.
- Market Sentiment: Retracements reflect temporary shifts in market sentiment but do not indicate a fundamental change. In contrast, reversals signal a significant shift in investor sentiment and mark the start of a new trend.
- Volume and Momentum: Retracements often show a decline in trading volume and weakening momentum. Reversals, however, are typically accompanied by a sustained increase in volume and stronger momentum.
Tools and Indicators for Establishing the Difference Between a Retracement and Reversal
Differentiating between a retracement vs a reversal in trading is crucial. Besides observing trend structure, several tools and indicators can assist traders in making this distinction. To take advantage of these tools, head over to FXOpen’s free TickTrader platform.
- Fibonacci Retracement: This tool helps identify potential levels where the price might find support or resistance and bounce back in the direction of the prevailing trend. Common retracement levels include 38.2%, 50%, and 61.8%. If a price exceeds these levels, especially the 61.8% mark, it might indicate a reversal rather than a pullback.
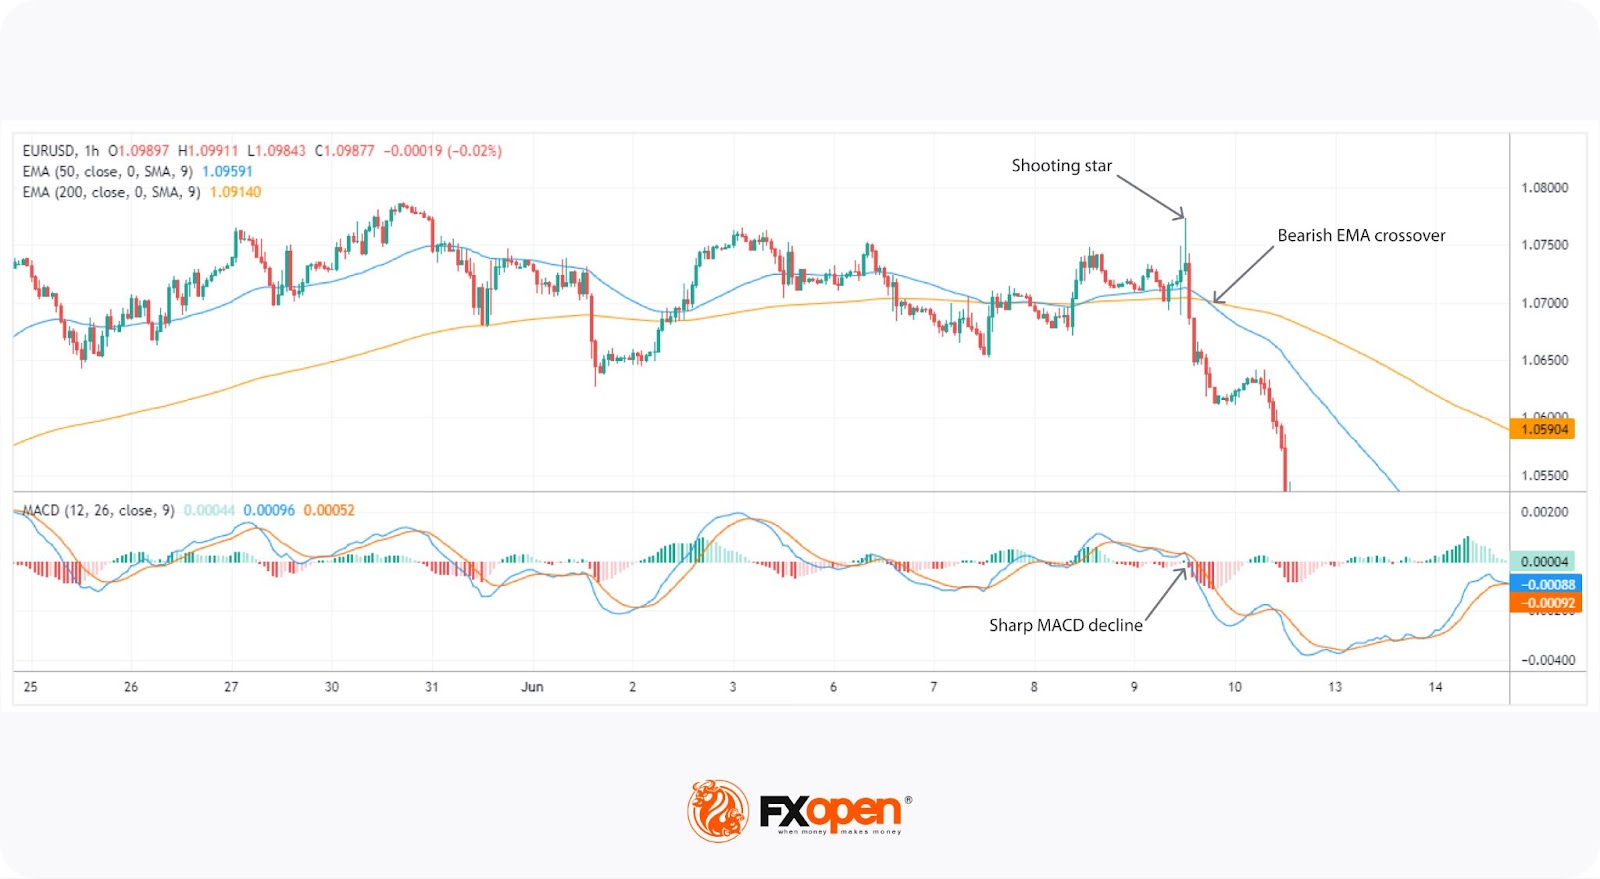
- Moving Averages: Moving averages can be a valuable trend reversal indicator. They’re used to smooth out price action and identify the market’s direction. A potential reversal can be indicated if short-term moving averages cross over long-term averages.
- Volume Analysis: A sudden increase in volume may signal a change in trend. During a retracement, volumes may surge temporarily but decline gradually when it nears its conclusion. However, if this volume increase is sustained over a period, it could indicate a full-blown reversal.
- Candlestick Patterns: Specific patterns, such as engulfing patterns or shooting star candles, may indicate a potential reversal, especially when they occur at significant support or resistance levels. During a pullback, candlestick charts might show indecision with long tails, whereas a reversal often features more definitive reversing patterns.
- Momentum Indicators: Momentum indicators can provide clues about the strength of the trend. In a reversal, these indicators tend to show weakening momentum or divergence from the price action, indicating a possible change in trend direction.
Practical Application and Strategies
The practical application of distinguishing between retracements and reversals lies in aligning trading strategies with the identified market phase. If a movement is identified as a retracement within a prevailing trend, traders might consider it an opportunity to enter the market in the direction of the trend. For instance, buying on a retracement in an uptrend or selling on a retracement in a downtrend. These entry points are often seen as offering a favourable risk/reward ratio, as the trader is aligning with the established trend.
Conversely, if a movement is identified as a reversal, it signals a potential change in the overall direction. Traders may then look to close out positions that are against the new trend or initiate new trades in the direction of the reversal. Here, the focus shifts to capitalising on the early stages of a new trend and managing risks associated with the change in the market direction.
In a reversal or retracement trading strategy, employing stop-loss orders is crucial for risk management as they can potentially limit losses if the market does not move as anticipated.
Common Mistakes and How You Can Avoid Them
In trading, misinterpreting retracements and reversals can lead to costly errors. Some of the most common mistakes include:
- Misinterpreting Early Signals: One of the most frequent errors is confusing a brief retracement with the beginning of a reversal. Jumping to conclusions too quickly can lead to premature exits or entries that go against the larger trend.
- Ignoring Trend Strength: Failing to assess the underlying strength of a trend often results in overreacting to minor price movements. This can cause traders to miss out on the broader trend by mistaking a healthy correction for a trend change.
- Overreliance on Indicators: While technical indicators are valuable tools, relying on them too heavily without considering the broader context can lead to misjudgments. Indicators can sometimes give conflicting signals, leading to misguided decisions.
- Neglecting Market Sentiment: Overlooking the broader sentiment is another common mistake. A minor pullback may look like a reversal if one fails to account for the overall market environment, such as economic news or geopolitical events.
The Bottom Line
Understanding the nuances between retracements and reversals is pivotal for informed trading decisions. Whether capitalising on retracements or adjusting strategies for reversals, these insights are integral to risk management and effective trading. For those looking to apply these strategies in real markets, opening an FXOpen account can be a practical step towards leveraging these insights. Enjoy trading with spreads as tight as 0.0 pips and low commissions from $1.50 per lot.
FAQ
What Is and How Does a Retracement Work in Forex?
The retracement meaning in forex refers to a temporary reversal in the direction of a pair’s price within a larger trend. During an uptrend, for example, the price might decline slightly before continuing its upward movement. Retracements are seen as normal corrections, offering potential entry points for traders looking to align with the prevailing direction.
How Can You Trade Retracements?
Retracement trading involves identifying temporary price corrections within a trend and using these moments to enter the market. A retracement forex strategy might see traders use tools like Fibonacci retracement levels to pinpoint where the price may reverse back in the direction of the trend. The goal is to take advantage of these short-term price moves while staying aligned with the overall trend.
What Is the Difference Between a Retracement and a Reversal?
The key difference between a retracement and a reversal lies in duration and impact. The former is a short-term correction that doesn’t change the overall direction. In contrast, a reversal signals a long-term change in trend direction and indicates a fundamental shift in market sentiment.
What Is the Difference Between a Pullback and Retracement?
"Pullback" and "retracement" are often used interchangeably, both referring to temporary price movements against the prevailing trend. However, "pullback" typically applies to short-term declines in an uptrend, while "retracement" can describe any temporary move against the larger trend in either direction.
This article represents the opinion of the Companies operating under the FXOpen brand only. It is not to be construed as an offer, solicitation, or recommendation with respect to products and services provided by the Companies operating under the FXOpen brand, nor is it to be considered financial advice.
Stay ahead of the market!
Subscribe now to our mailing list and receive the latest market news and insights delivered directly to your inbox.


Latest articles

GBP/USD and EUR/GBP Await Key Bank of England Decision
The pound strengthened following the outcome of the US Federal Reserve meeting, where the central bank, as expected, kept interest rates unchanged. However, the Fed did not provide the market with clear signals of an imminent shift towards rate cuts,

Microsoft Analysis: Earnings Beat Expectations
On 29 July 2026, Microsoft reported its results for the fourth quarter of fiscal year 2026. Revenue reached $90 billion, up 18% year-on-year, while adjusted earnings per share came in at $4.74, comfortably ahead of analysts' expectations of $4.

EUR/USD: All Eyes on the Fed as the Range Reaches Its Breaking Point
The dollar's next move hinges on tonight's Fed decision, and this time markets genuinely don't know what to expect. While economists still lean toward a hold—with CME FedWatch odds sitting near 68.5% for no change—Kevin Warsh's hawkish