


FXOpen
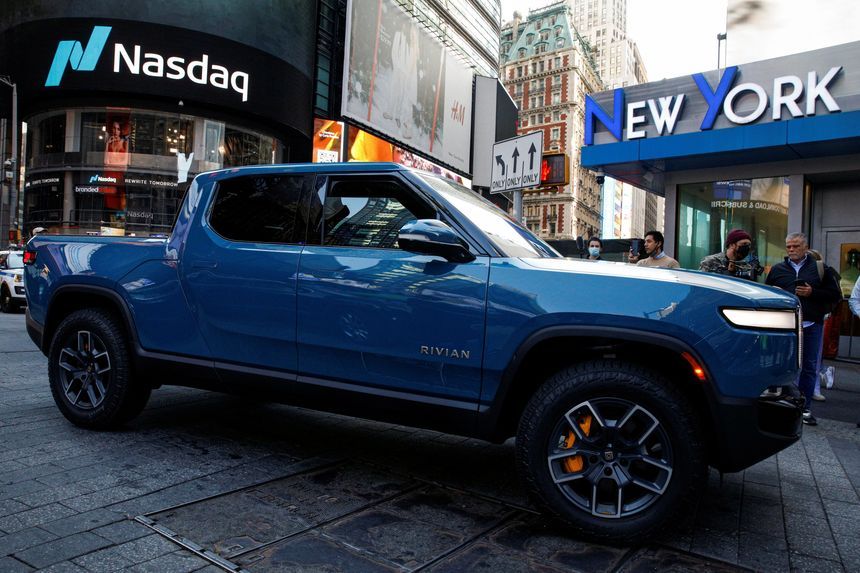
Electric vehicle manufacturer Rivian Automotive has been displaying the sort of volatile share price that is perhaps to be expected from a recently-listed company which went to market after being a relatively unknown quantity in the motoring world and having done so with such an inflated valuation.
Initially, Rivian stock appeard to show no sign of investor concern and it headed for the skies, but its recent performance has been subject to a sudden crash in value which took place in March this year, from which it never really recovered.
For those electric vehicle drivers among us who have ever experienced 'range anxiety' - that unnerving feeling when the battery level indicator shows that there is not much electricity left and the nearest charging station appears to be long in the distance - the roller coaster ride that Rivian stock has taken has been a similar journey.
In the spring of 2022, when Rivian stock collapsed in value from $67.50 on February 28 to $35.83 just one day later on March 1, almost 50% of the value of Rivian stock was lost.
This has not yet recovered, and in fact the value has declined even further, however things are perhaps beginning to look up, even if it is very slightly.
Rivian stock climbed gradually to $34.30 by close of the US market on Friday July 29, which represents a 1-month high point for the NASDAQ-listed stock.
That is still lower than the $35.83 it crashed to in its initial decline in March this year, but it is an 8.6% climb over the past six months from the depths it plumbed during the summer months.
On Friday alone, Rivian stock gained 1.34% in value, and has climbed 33.4% in the last 30 days, which is interesting, however this climb was made after a very slow return to some degree of popularity after a very low value in May of just $20 per share.
Unlike some disruptive companies, especially those which went to public market during the electric vehicle boom over the past year, Rivian actually took the traditional route to market, and did not go down the Special Purchase Acquisition Company (SPAC) route as some of its rivals did.
This perhaps instilled a degree of confidence at the time, as it means that proper due diligence has been conducted on the corporate structure of Rivian Automotive itself rather than a shell company which writes a blank check and bypasses the traditional listing procedures which are long and invasive.
At the time of listing in Autumn 2021, Rivian looked to show a market cap of $100 billion which is astonishing even post-IPO.
The volatility which has ensued is perhaps interesting, however it is a lesson that not every potential superstar gets off to a stellar start.
The close of business on Friday was, however, a step in the right direction.
Buy and sell stocks of the world's biggest publicly-listed companies with CFDs on FXOpen’s trading platform. Open your FXOpen account now or learn more about trading share CFDs with FXOpen.
This article represents the opinion of the Companies operating under the FXOpen brand only. It is not to be construed as an offer, solicitation, or recommendation with respect to products and services provided by the Companies operating under the FXOpen brand, nor is it to be considered financial advice.
Stay ahead of the market!
Subscribe now to our mailing list and receive the latest market news and insights delivered directly to your inbox.

Latest articles

Weekly Market Wrap With Gary Thomson: Nasdaq, EUR/USD, USD/CHF, Brent Crude Oil, Googl Shares
Get the latest scoop on the week's hottest headlines, all in one convenient video. Join Gary Thomson, the COO of FXOpen UK, as he breaks down the most significant news reports and shares his expert insights.
- Nasdaq Composite: Worst Session

Analysis of AUD/USD: Exchange Rate Falls to Early May Low
As indicated by the 4-hour AUD/USD chart today:
→ the rate fell below 0.652, a level last seen on May 2;
→ the RSI indicator dropped below 15, a level last seen during the panic over the spread of COVID-19

Analysis of AMZN Stock: Price at 1.5-Month Low
As shown in the AMZN chart, the stock price dropped below:
→ the psychological level of $180;
→ the mid-June interim low.
The last time AMZN traded below $180 was in early June.
Thus, AMZN has faced sell-offs, similar to other tech