


Rounding Bottom Pattern: Examples and How to Trade It
FXOpen
In the trading world, it's crucial to identify patterns that signal potential market reversals. The rounding bottom is one of them. It indicates a shift from a bearish to a bullish trend. In this article, we will discuss the rounding bottom pattern, find out how to identify it and learn how to trade it effectively using technical analysis and risk management strategies.
What Is the Rounding Bottom Pattern?
A rounding bottom is a price action pattern that has a "U" shape and highlights a reversal in a bearish trend. Depending on the selected timeframe, it may take anything from a few minutes to several months for it to form completely. As it is quite rare, traders need to have good knowledge of technical analysis to identify it on a price chart. Market participants may require volume and other indicators to confirm the reversal.
With FXOpen, you can trade the rounding bottom on multiple financial instruments, including forex, stock, ETF, index, cryptocurrency*, and commodity CFDs.
How Can You Identify a Rounding Bottom Pattern?
The rounding bottom appears when a price forms a trough in a bearish trend and rebounds, creating a gradual curve that becomes more pronounced as the rally progresses. It is usually confirmed when the security breaks above its resistance level, known as the neckline.
The resistance, or the neckline, is a technical level of resistance that forms a horizontal line connecting the high points in the rounding bottom, where the market has struggled to break above.

A rounding bottom formation on the M30 chart of EURUSD. Traders can classify it into three main areas: a decline towards the short side, consolidation, and a reversal to the top.
In contrast to a rounding bottom, there is a rounding top pattern which is formed in an uptrend and signals a reversal.

Above, you can see a rounding top price action on the hourly chart of USDJPY. It resembles an upside-down "U" and is formed when the price of an asset rises to a peak, then begins to consolidate and forms a series of lower highs and lower lows. There will be a support neckline instead of a resistance which can be placed by connecting the two or more lowest points of the rounding top with a horizontal line.
Rounding Bottom vs Cup and Handle Pattern
The rounding bottom and cup and handle formations look similar; however, there are specific differences that you should note to avoid confusing them with each other. The former points to a trend reversal, while the latter signals a trend continuation. That is, the rounding bottom is a bullish reversal setup, and the cup and handle is generally a bullish continuation formation. To distinguish between them, look for a handle – the rounding bottom does not have one.

In the cup and handle setup, the price forms a trough in a bullish trend and then rises to resistance, but the uptrend doesn’t continue before a handle is formed. Only a breakout above the handle signals the continuation of the uptrend.
The rounding bottom formation does not have a handle. Instead, the market continues straight to the bullish trend.
You can use the FXOpen TickTrader platform to examine the rounding bottom and cup and handle formations for free before you enter the live market.
Trading with the Rounding Bottom Pattern
Traders can observe the pattern on all timeframes, i.e., weekly, daily, 1 minute, etc. After identifying the rounded bottom chart pattern, wait for the price to close above the neckline. The stop-loss order is usually placed below the neckline, but its distance depends on the risk-reward ratio and market conditions. For a take-profit level, traders measure the distance between the trough and the neckline and use that same value from the neckline towards the top.

In the chart above, the price forms a rounding bottom pattern. The stop-loss level is placed just below the neckline. The take-profit target is the same as the distance from the trough to the neckline, equivalent to 16 pips towards the bullish side.
How to Confirm the Pattern
Traders never use patterns alone, as they can fail. A high rising volume during a rounded bottom breakout above the neckline can be used as one of the tools to validate the signal.
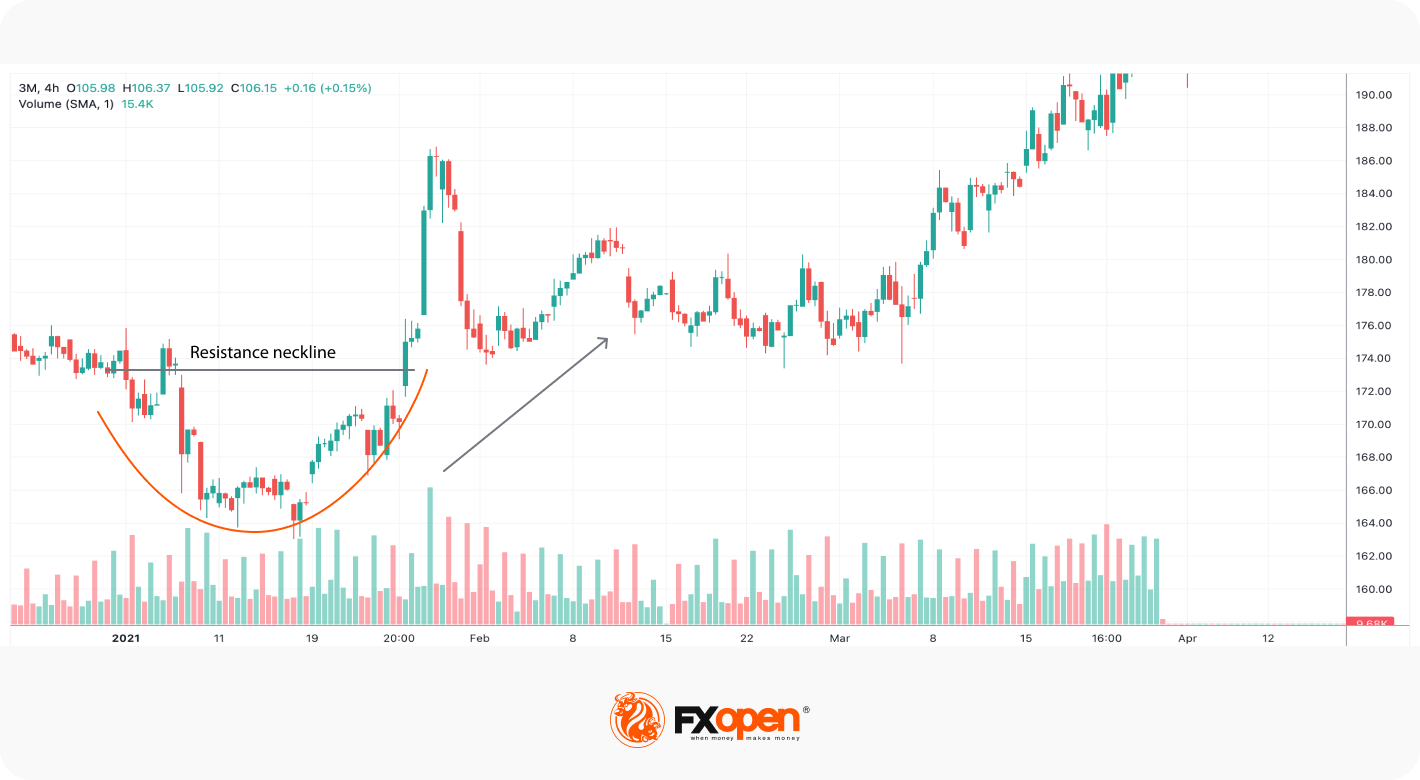
The chart above shows a rounding bottom stock pattern. The breakout above the resistance occurs with high bullish volumes. This provides confirmation of a bullish move.
Special Consideration
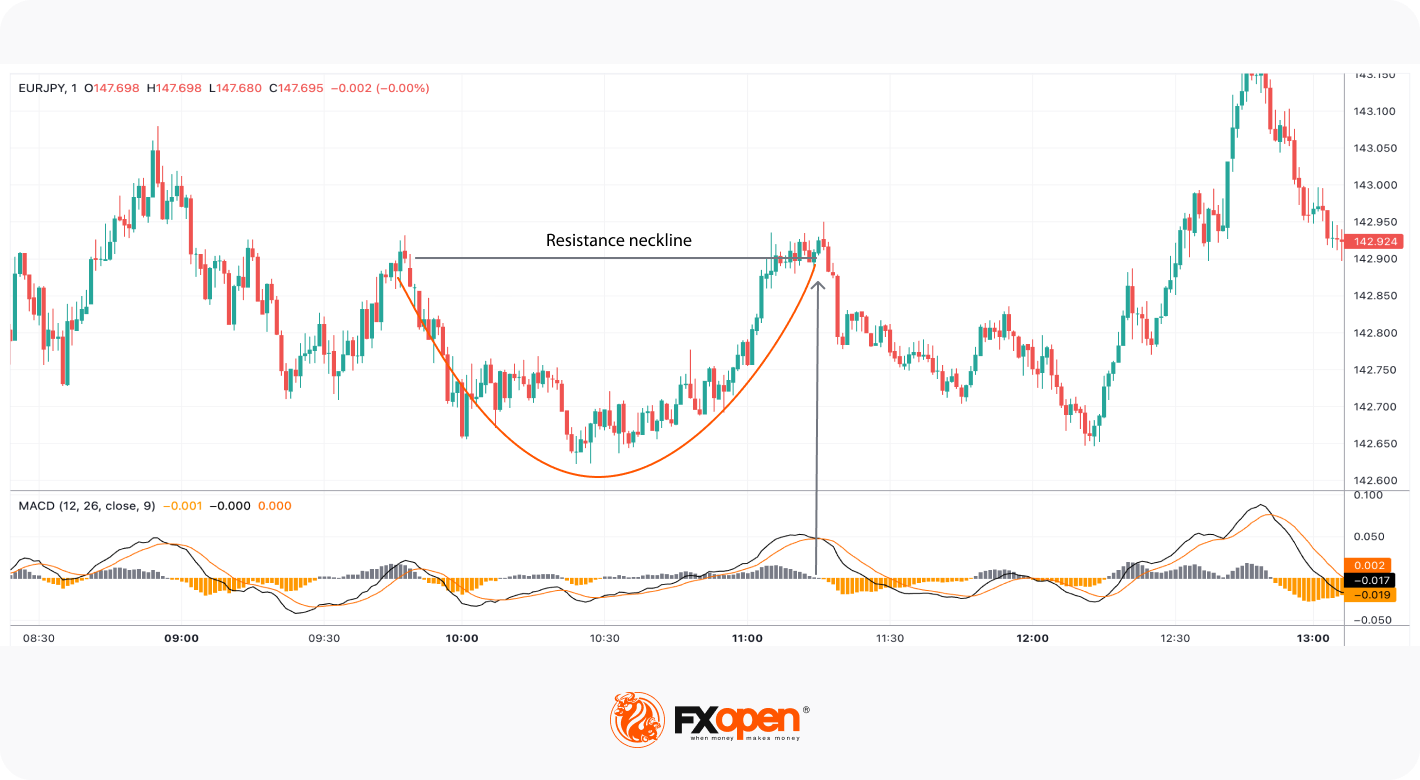
Traders can validate the rounding bottom signals and identify when they will fail. In the chart above, the MACD indicator broke above 0 at the trough, which confirmed a bullish move. However, soon after the price faced strong resistance, the MA cross signalled a price decline, and the histogram broke below 0. As a result, the downtrend continued.
Final Thoughts
Employing proper risk management strategies and keeping a good mindset while trading is vital. While the rounding bottom can provide effective trading signals, it is vital to note that it can provide incorrect signals too. Investors must perform careful analysis and seek confirmation from other indicators before making a trading decision. You can open an FXOpen Account to start analysing the markets.
*At FXOpen UK and FXOpen AU, Cryptocurrency CFDs are only available for trading by those clients categorised as Professional clients under FCA Rules and Professional clients under ASIC Rules, respectively. They are not available for trading by Retail clients.
This article represents the opinion of the Companies operating under the FXOpen brand only. It is not to be construed as an offer, solicitation, or recommendation with respect to products and services provided by the Companies operating under the FXOpen brand, nor is it to be considered financial advice.
Stay ahead of the market!
Subscribe now to our mailing list and receive the latest market news and insights delivered directly to your inbox.


Latest articles

GBP/CHF: Trendline or RSI — Which One Is Lying?
Sterling enters this week on firmer footing, with political uncertainty fading fast after Andy Burnham's confirmation as Labour leader eased investor concerns over the succession to Keir Starmer. Markets reacted further to reports pointing to Shabana Mahmood as the frontrunner

Silver Attempts to Break Out of Its Range
Silver continues to balance between its dual role as an industrial metal and so-called refuge asset, and this combination largely explains the lack of a clear trend in recent weeks. Shifting expectations for central bank interest rates can influence the

Nasdaq 100: Is This the Correction Traders Have Been Waiting For?
The Nasdaq 100 (US Tech 100 Mini on FXOpen) remains caught between two opposing forces: cooling inflation on one side, and persistent geopolitical instability on the other. On 14 July, June's CPI print came in softer than expected, easing near-term