


Currencies Consolidate Awaiting Bank of Canada and ECB Verdicts
FXOpen

The last full trading week of January is highly saturated with important fundamentals. This morning, the Bank of Japan held its meeting, tomorrow, the Bank of Canada will announce its verdict, and on Thursday, the ECB's press conference is scheduled. Major currency pairs, in anticipation of the mentioned events, continue to trade within narrow corridors formed earlier.
USD/CAD
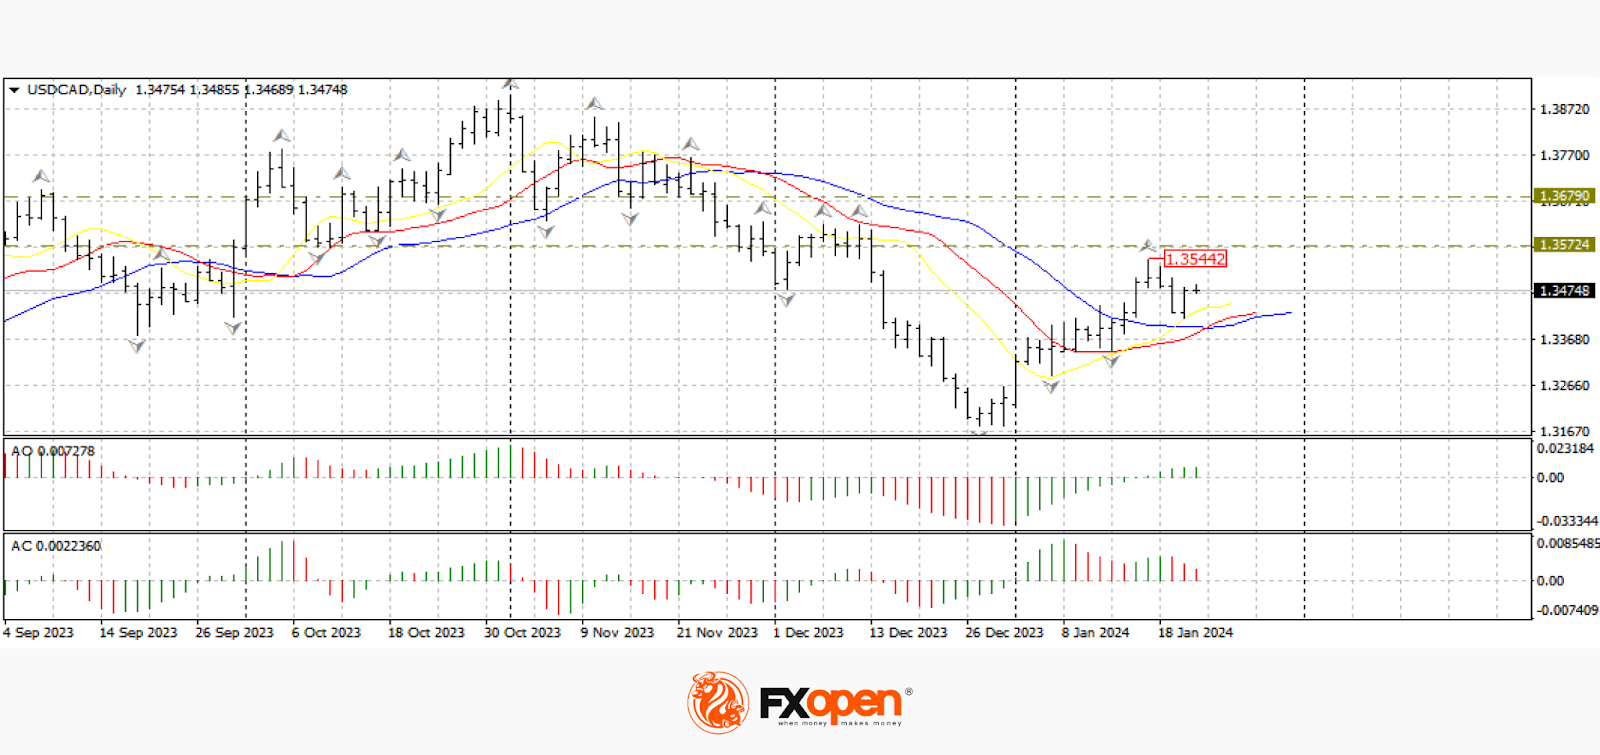
The USD/CAD chart shows that the currency pair is trading near recent highs at 1.3520-1.3480. After an early-year rise, the pair retreated to support at the alligator lines on the daily timeframe. Yesterday, the price dropped to 1.3420 but interrupted the downward correction and rose to 1.3480 by evening. With a corresponding fundamental background, the pair may break the upper fractal at 1.3540 and continue to rise towards 1.3680-1.3570. The cancellation of the upward scenario may be considered with a confident fixation below 1.3400.
At 16:30 GMT+3 today, we await the publication of data on the new housing price index in Canada for December. Tomorrow at 18:00 GMT+3, the Bank of Canada will announce its decision on the base interest rate. Analysts predict that officials will leave the rate unchanged. For market participants, the Canadian regulator's comments on credit and monetary policy for the current year will be crucial.
GBP/USD
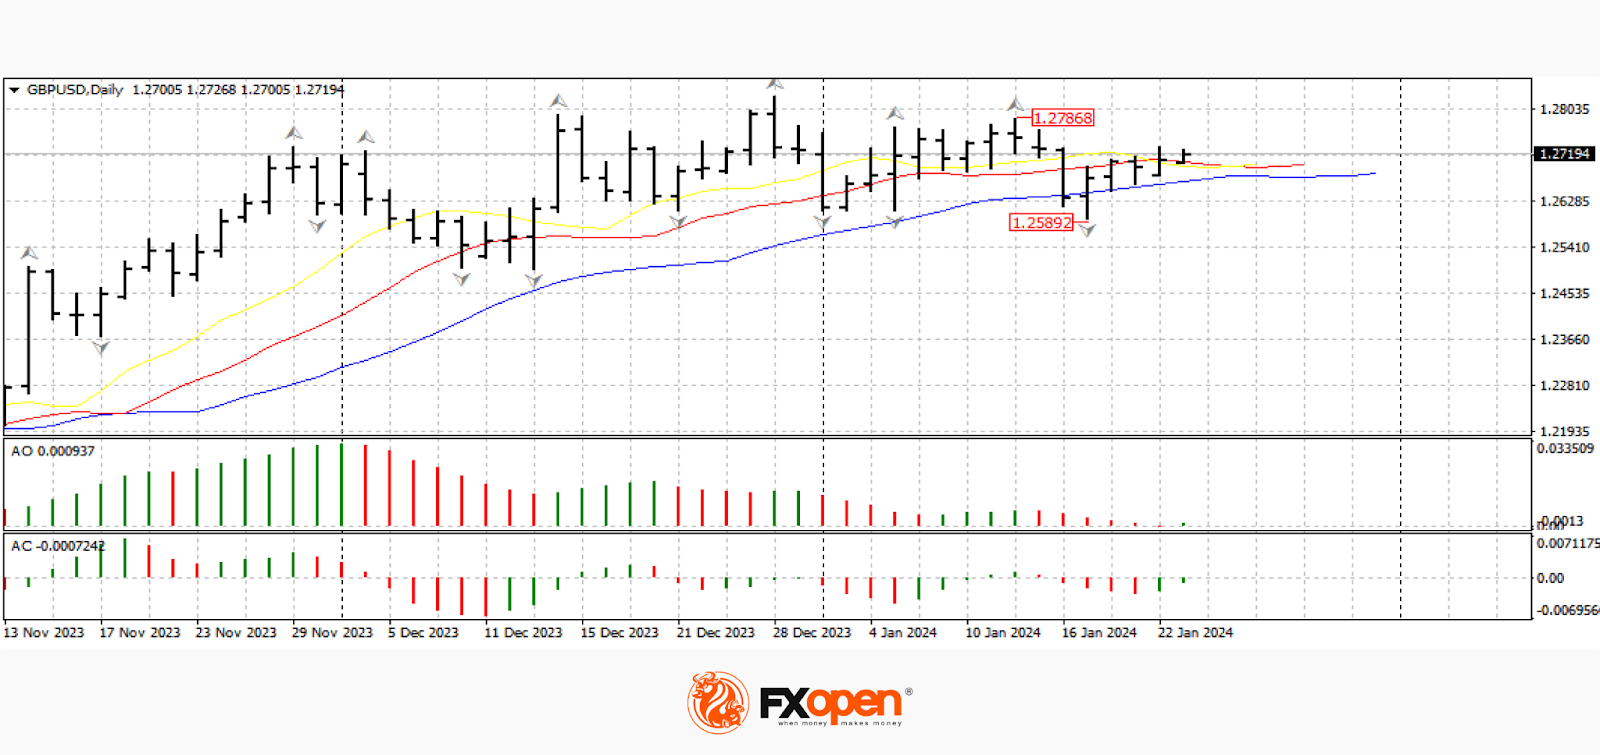
The GBP/USD chart shows the currency pair has held within a relatively narrow range for several days, between 1.2720 and 1.2600. Uncertainty in the credit and monetary policies of the Bank of England and the Federal Reserve keeps investors from both buying and selling the GBP/USD pair.
Tomorrow at 12:30 GMT+3, attention should be paid to the publication of data on the Purchasing Managers' Index (PMI) for the manufacturing sector in the UK for January. Also, tomorrow at 17:45 GMT+3, a block of important macroeconomic data will be released from the US, including the PMI for the services sector and the PMI for the manufacturing sector for the same period.
EUR/USD
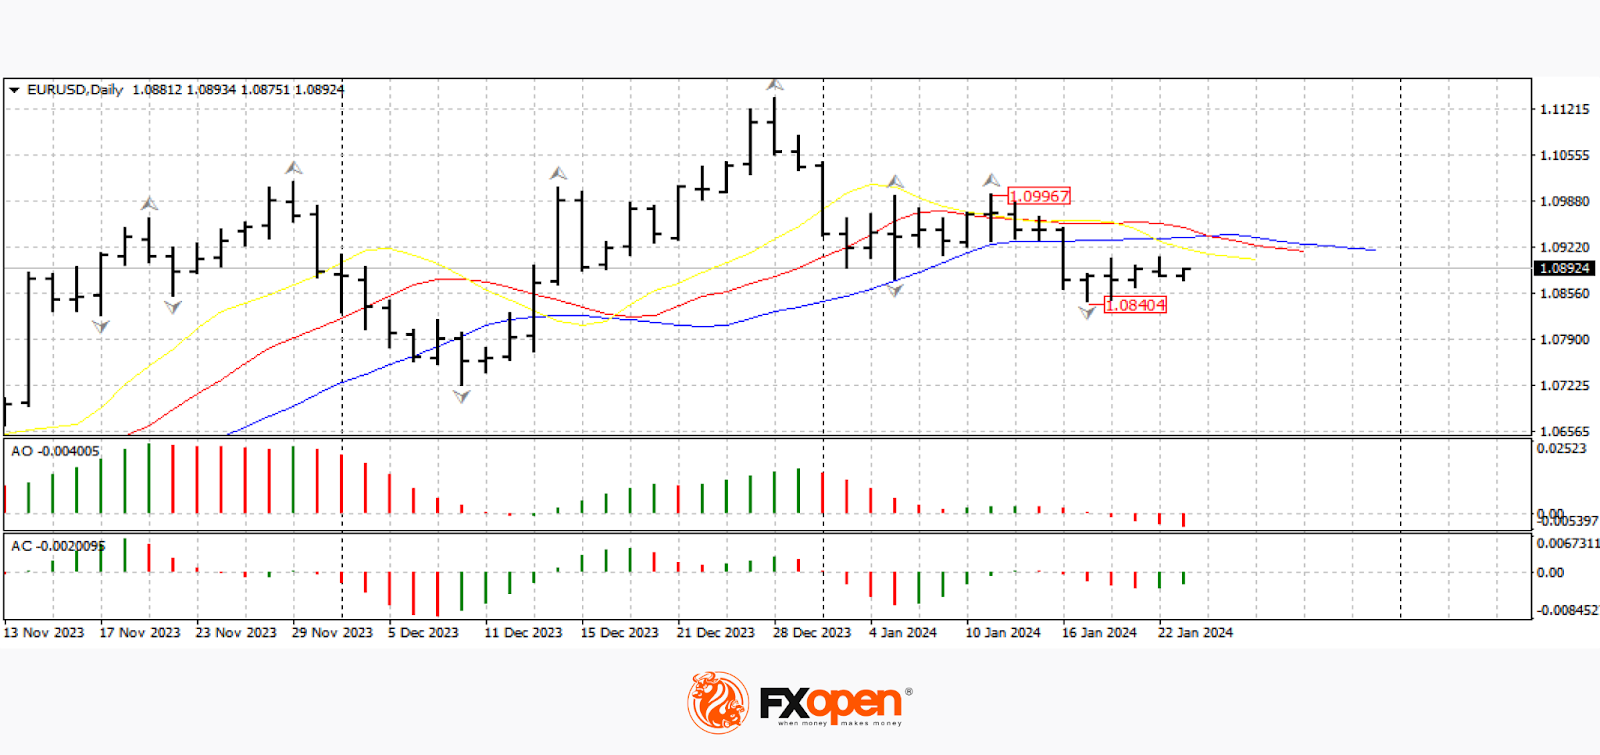
The euro, after breaking the support at 1.0920, has been trading below the alligator lines on the daily timeframe for about a week. However, technical analysis of EUR/USD today suggests that there are no pronounced downward dynamics after the breakthrough of important levels: the price is trapped between 1.0900 and 1.0840.
Traders are likely awaiting the ECB's verdict; the European regulator's meeting is scheduled for Thursday. If officials' forecasts for the economic recovery of the Eurozone for the current year turn out to be pessimistic, the price may break support at 1.0840 and resume the downward movement towards 1.0700-1.0600. The breakdown of the downward scenario may be expected after a confident fixation above 1.1000.
Trade over 50 forex markets 24 hours a day with FXOpen. Take advantage of low commissions, deep liquidity, and spreads from 0.0 pips (additional fees may apply). Open your FXOpen account now or learn more about trading forex with FXOpen.
This article represents the opinion of the Companies operating under the FXOpen brand only. It is not to be construed as an offer, solicitation, or recommendation with respect to products and services provided by the Companies operating under the FXOpen brand, nor is it to be considered financial advice.
Stay ahead of the market!
Subscribe now to our mailing list and receive the latest market news and insights delivered directly to your inbox.


Latest articles

Weekly Market Insights with Gary Thomson: The Week of Central Banks and Earnings
In this video, we’ll explore the key economic events and market trends, shaping the financial landscape. Get ready for insights into financial markets to help you navigate the week ahead. Let’s dive in!
In this episode of Market

Intel at a Crossroads: Earnings Beat Meets Technical Resistance
Intel has just delivered its strongest quarter in over fifteen years, and the market reaction says it all. Q2 2026 revenue surged 25% year-over-year to $16.1 billion, crushing the consensus estimate of $14.42 billion, while adjusted EPS of

Tesla: Complex Range Structure Breaks Down Following Quarterly Earnings
Tesla released its Q2 2026 results after the market closed on 22 July. Revenue increased 26% year-on-year to $28.24 billion, while vehicle deliveries reached a record 480,126 units. However, operating margin fell sharply to 1.4%, down from