


Dollar On the Rise amid Strong US Employment Data
FXOpen

The dollar weakened last week as Treasury yields fell, even after Fed Chairman Jerome Powell said Wednesday that a March rate cut was unlikely. On Friday the situation changed. Nonfarm payrolls increased by 353,000 last month, beating economists' expectations of a gain of 180,000. Average hourly wages rose 0.6% after rising 0.4% in December. That sent the dollar soaring across the board, with the dollar index, which tracks the currency against six peers, rising 0.8%.
EUR/USD
The EUR/USD pair shows mixed dynamics, remaining close to 1.0775. Immediate resistance can be seen at 1.0813, a break higher could trigger a move towards 1.0897. On the downside, immediate support is seen at 1.0767, a break below could take the pair towards 1.0750.
Trading participants are in no hurry to open positions, waiting for new drivers to emerge. At the same time, the single currency remains under pressure after the publication of the January report on the US labour market on Friday. The focus of trading today will be on January statistics on business activity in the EU from S&P Global. It is predicted that business activity indices in the service sector and manufacturing sector will remain at the levels of 48.4 points and 47.9 points, respectively. Data on manufacturing inflation will also be presented: the producer price index in December is expected to decline by 0.8% month-on-month and 10.5% year-on-year after -0.3% and -8.8% in the previous month.
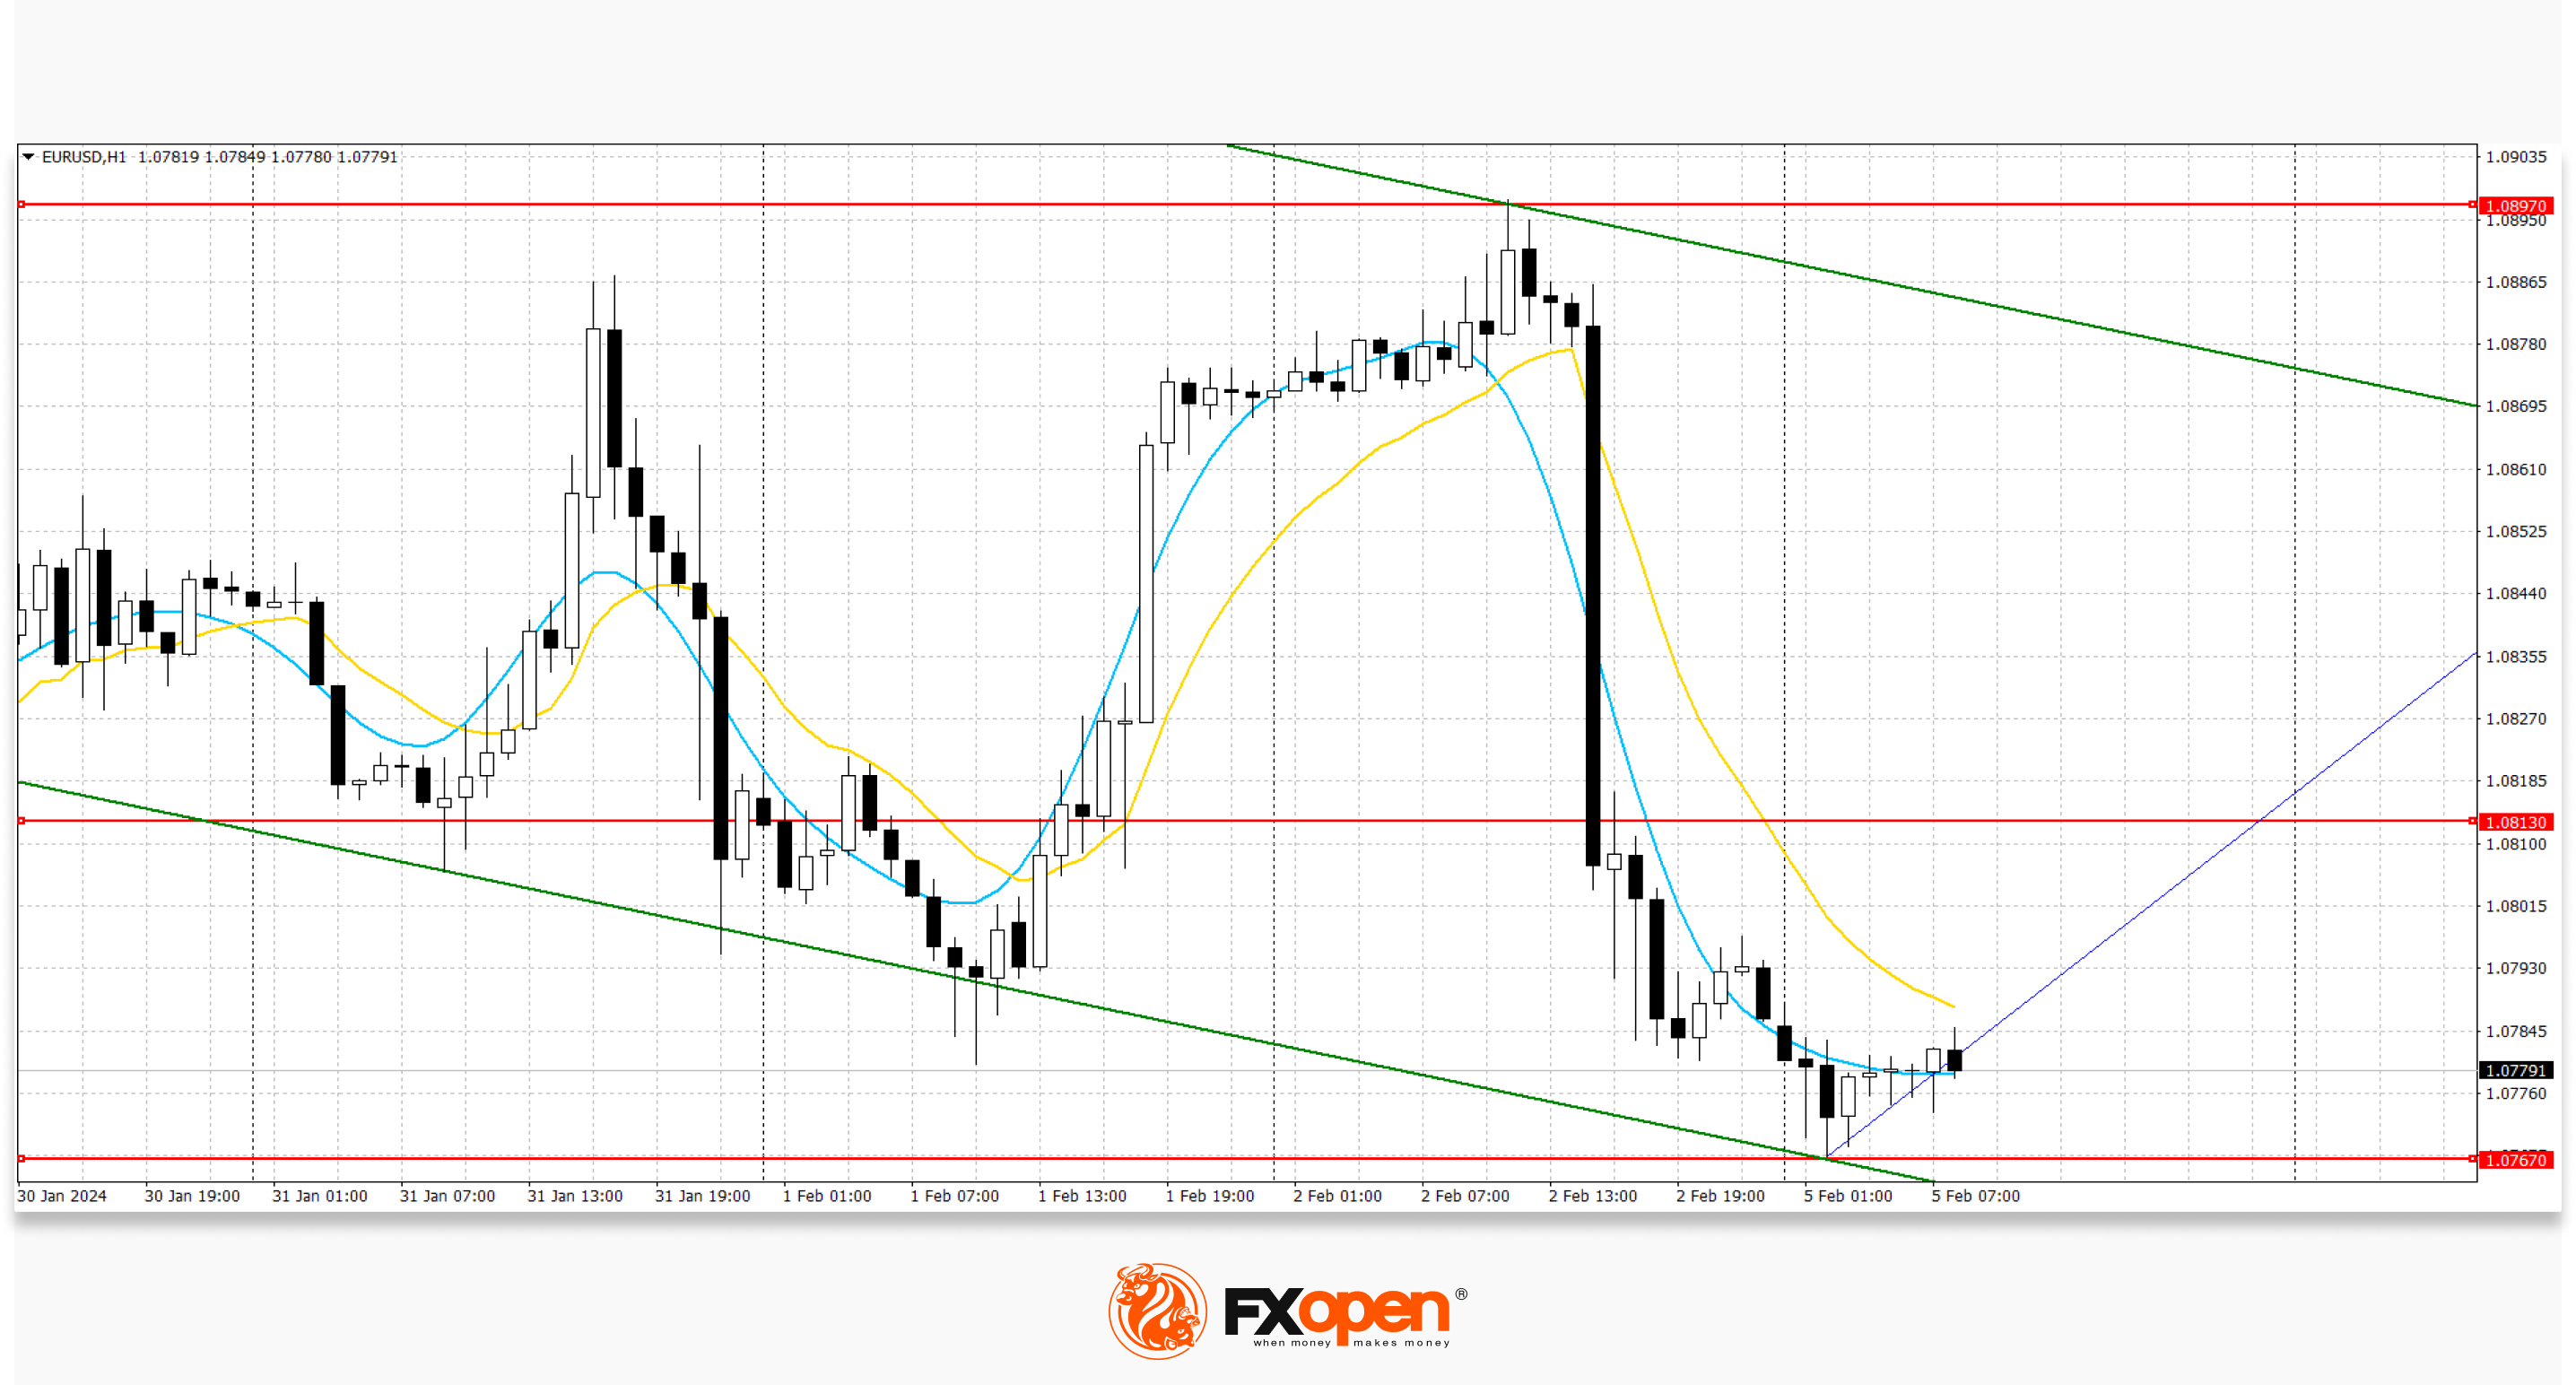
Technical analysis of EUR/USD shows that a new downward channel has formed based on last week’s lows. Now the price has moved away from the lower boundary and may continue to rise.
GBP/USD
The GBP/USD pair is trading with downward dynamics, developing a strong bearish impulse formed last Friday in response to the publication of a report on the US labor market. Immediate resistance on the GBP/USD chart can be seen at 1.2667, a breakout to the upside could trigger a rise towards 1.2772. On the downside, immediate support is seen at 1.2598, a break below could take the pair towards 1.2560.
Today, investors will focus on January statistics on business activity in the services sector in the US and UK. It is predicted that the American indicator will remain at the same level of 52.9 points, and the British one at 53.8 points. At the same time, data on activity in the USA from the Institute for Supply Management (ISM) suggests an increase in the index from 50.6 points to 52.0 points.
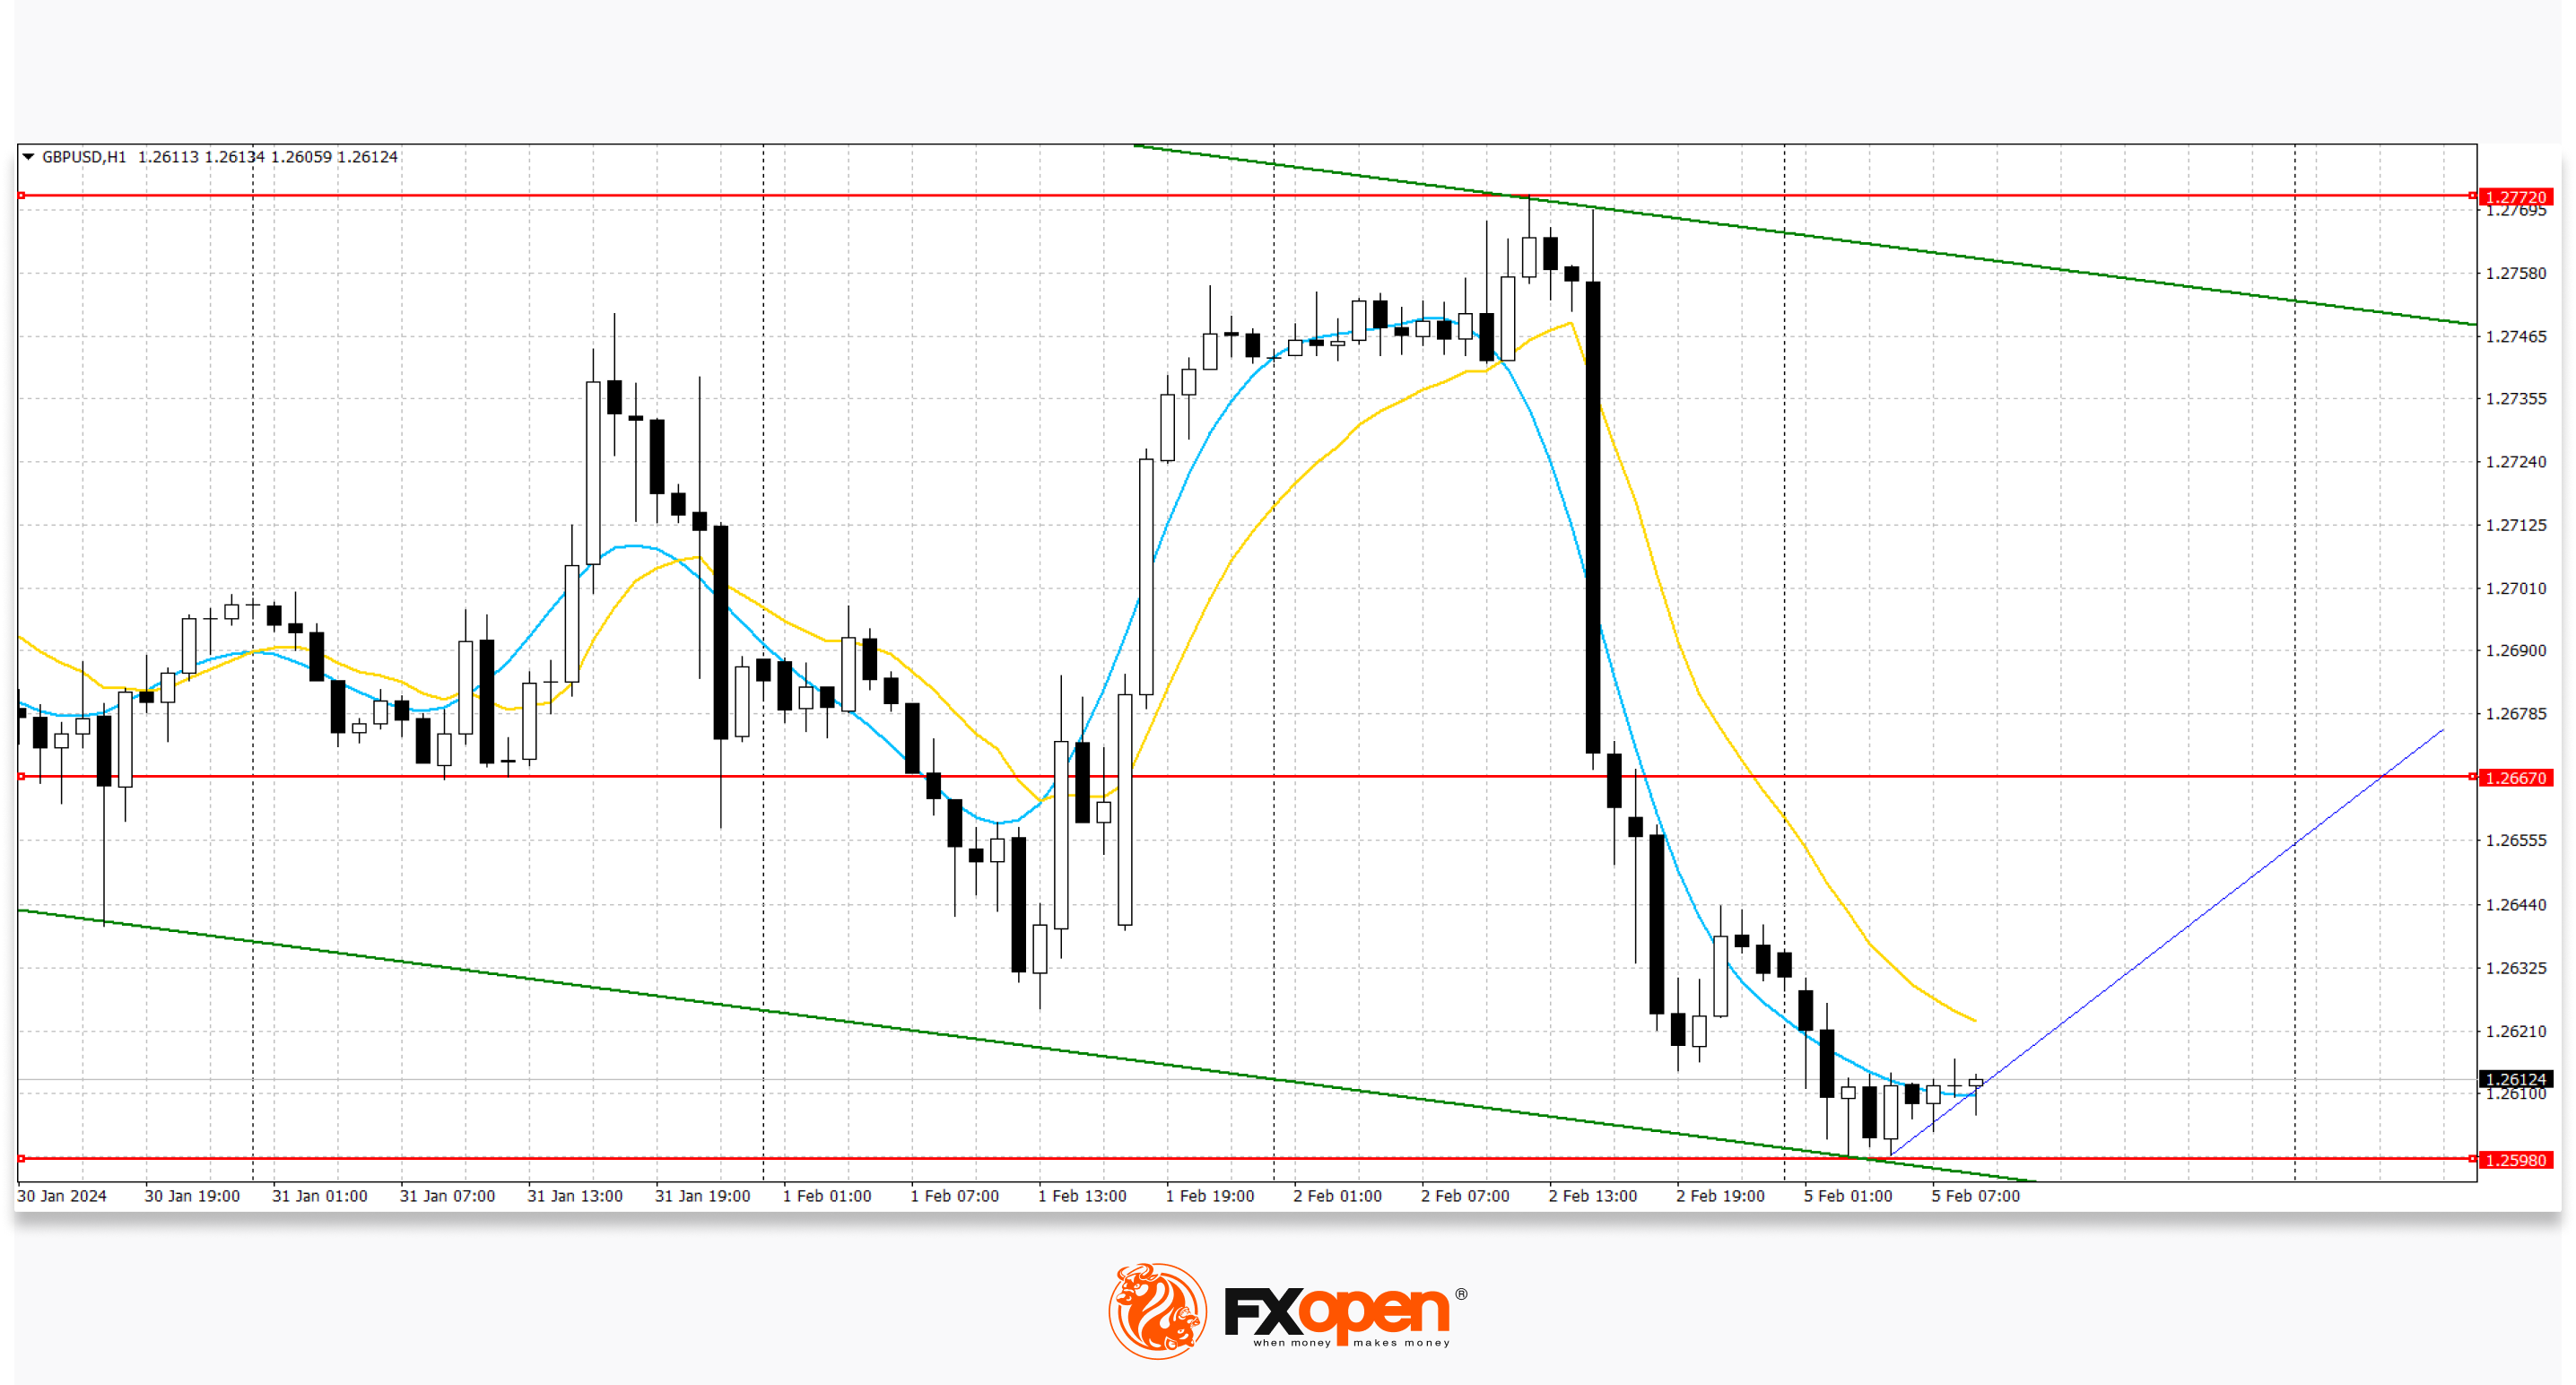
Based on last week's lows, a new downward channel has formed. Now the price has rebounded from the lower border and may continue to rise.
USD/JPY
The USD/JPY pair is developing a strong bullish momentum in the area of 148.32, which formed on Friday after the publication of American macroeconomic statistics on the labour market. Traders reacted to the data by adjusting their expectations regarding the imminent reduction of interest rates by the US Federal Reserve, not excluding it in March, but counting more on a May or even June meeting of the regulator. Strong resistance on the USD/JPY chart can be seen at 148.82, a breakout to the upside could trigger a rise towards 149.68. On the downside, immediate support is seen at 147.88. A break below could take the pair towards 147.12.
The yen is slightly supported by data from Japan: the business activity index from S&P Global in January increased from 52.7 points to 53.1 points, while most forecasts assumed the indicator to remain unchanged. At its January meeting, the Bank of Japan kept interest rates at -0.10%. Governor Kazuo Ueda gave few hints as to when the bank might shift to hawkish rhetoric for the first time since 2007, but the quarterly report showed the likelihood of hitting the 2.0% inflation target gradually increasing and the economic outlook remaining positive. Thus, analysts at Morgan Stanley MUFG and BNP Paribas said they predicted changes in borrowing costs in March.
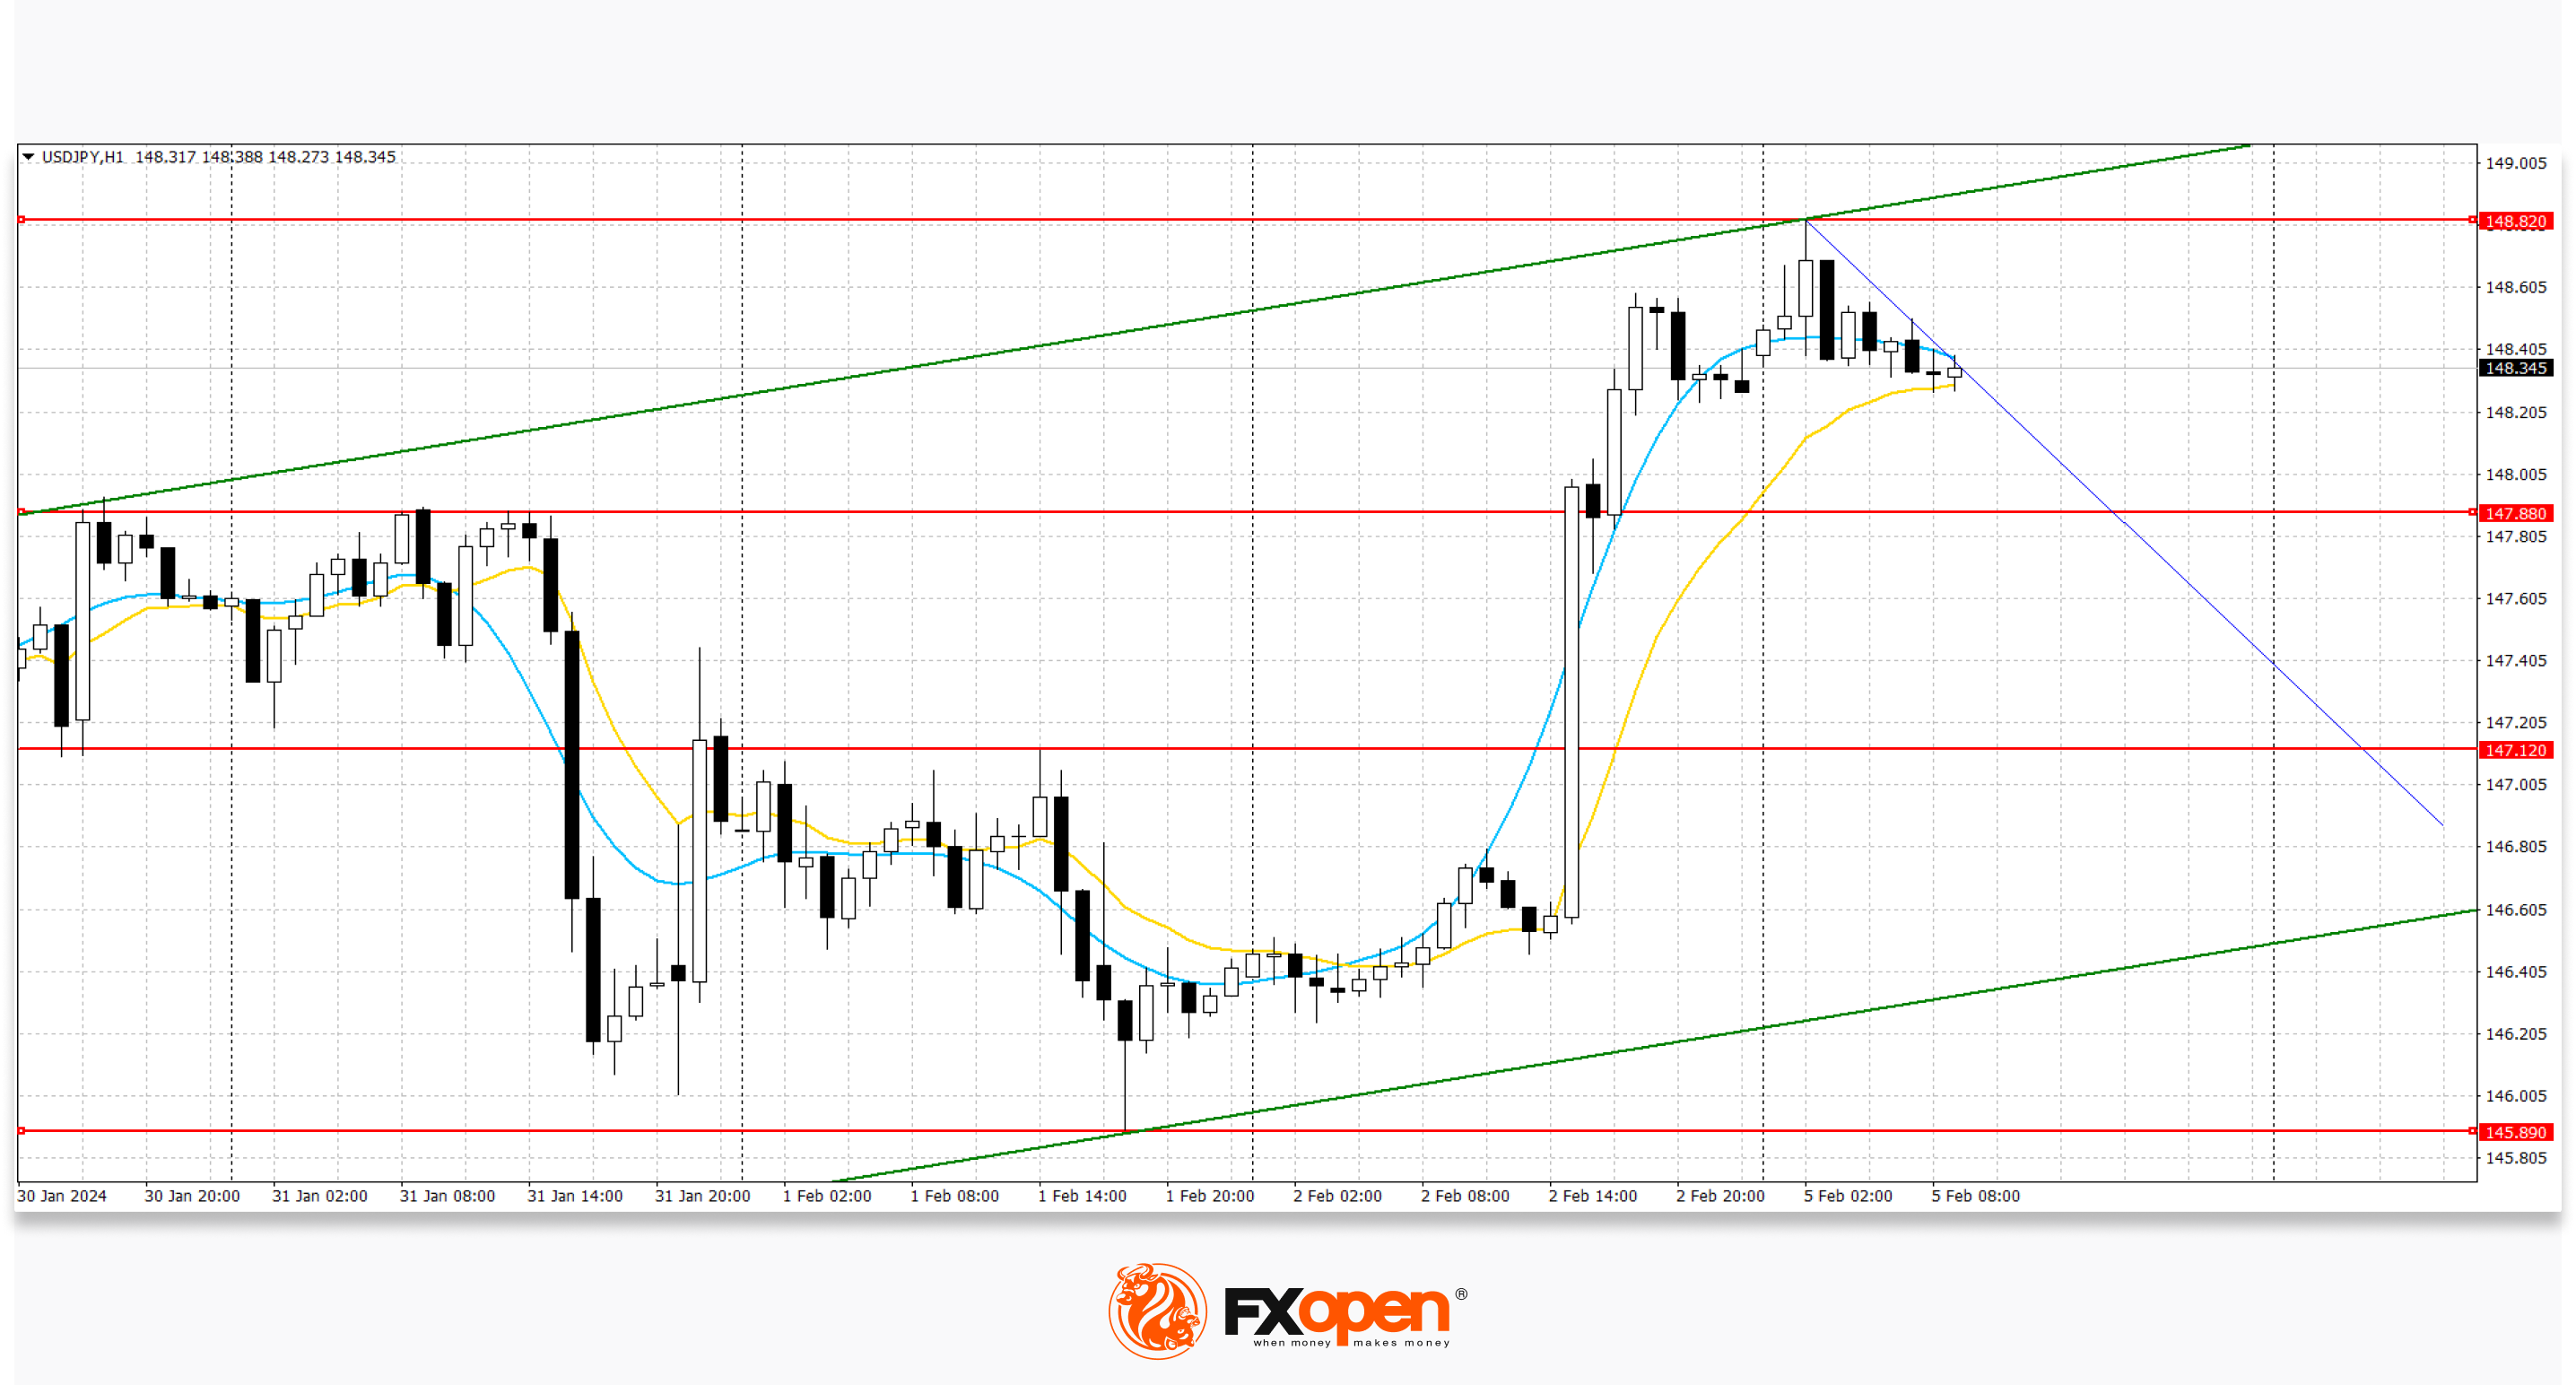
Based on the highs of last week, a new ascending channel has formed. Now the price has moved away from the upper limit and may continue to decline.
Trade over 50 forex markets 24 hours a day with FXOpen. Take advantage of low commissions, deep liquidity, and spreads from 0.0 pips (additional fees may apply). Open your FXOpen account now or learn more about trading forex with FXOpen.
This article represents the opinion of the Companies operating under the FXOpen brand only. It is not to be construed as an offer, solicitation, or recommendation with respect to products and services provided by the Companies operating under the FXOpen brand, nor is it to be considered financial advice.
Stay ahead of the market!
Subscribe now to our mailing list and receive the latest market news and insights delivered directly to your inbox.


Latest articles

EUR/USD and GBP/USD consolidate ahead of the Fed decision
European currencies are showing subdued dynamics, entering a consolidation phase following their previous advance. Earlier, EUR/USD and GBP/USD broke out of their ranges and strengthened; however, the subsequent correction has led both pairs to retest the previously breached

Meta: V-Shaped Recovery Meets Heavy Volume Resistance
The movement in Meta Platforms shares is being driven by two competing narratives. On one hand, advertising revenue is benefiting from AI-based tools: the Advantage+ platform continues to support strong advertiser demand, and the analyst consensus for Q1 2026 revenue

Commodity Currencies Test Key Levels Ahead of Major Macro Data
Commodity-linked currencies are trading near key levels, showing restrained price action as market participants adopt a wait-and-see approach. The fundamental backdrop is shaped by expectations surrounding the release of Australia’s inflation data and the Bank of Canada’s interest