


Dollar Strengthens after Rate Forecast Changes
FXOpen

The US dollar is recovering amid weakening expectations of lower borrowing costs. The focus of investors today is the February statistics on new home sales in the US, forecasts for which suggest an acceleration of dynamics from 0.661 million to 0.680 million (+1.5%). Also during the day, the index of national activity of the Federal Reserve Bank (FRB) of Chicago will be published and a speech will be given by the representative of the US Federal Reserve, Raphael Bostic.
The relatively strong US economy and high interest rates support the dollar. The Fed left the overnight rate at 5.25%-5.5% and stuck to its forecast of three cuts by the end of the year. The Fed has said it will not cut rates until it is confident inflation will fall sustainably to its 2% target. Rate cuts of about 84 basis points are included this year. That's much lower than about 160 at the start of the year, but higher than it was earlier in the week as bets on a rate cut gained momentum. Traders now see a 71% chance the first rate cut will occur in June, up from 56% earlier this week, according to CME's FedWatch Tool. The dollar index, a measure of the U.S. currency against six major trading partners, rose 0.45%.
EUR/USD
The EUR/USD pair is showing weak growth, correcting after a sharp decline in the instrument at the end of last week, when the instrument updated local lows from March 1. Technical analysis of EUR/USD shows that immediate resistance can be seen at 1.0871, a breakout to the upside could trigger a rise towards 1.0942. On the downside, immediate support is seen at 1.0800, a break below could take the pair towards 1.0780.
The position of the European currency received some support from macroeconomic data from Germany. The Business Optimism Index from the Institute for Economic Research (IFO) rose from 85.7 points to 87.8 points in March, while analysts expected 86.0 points. The indicator of economic expectations strengthened from 84.4 points to 87.5 points, also ahead of forecasts at 84.7 points, and the indicator for assessing the current situation — from 86.9 points to 88.1 points, which was higher than expectations at 86.8 points.
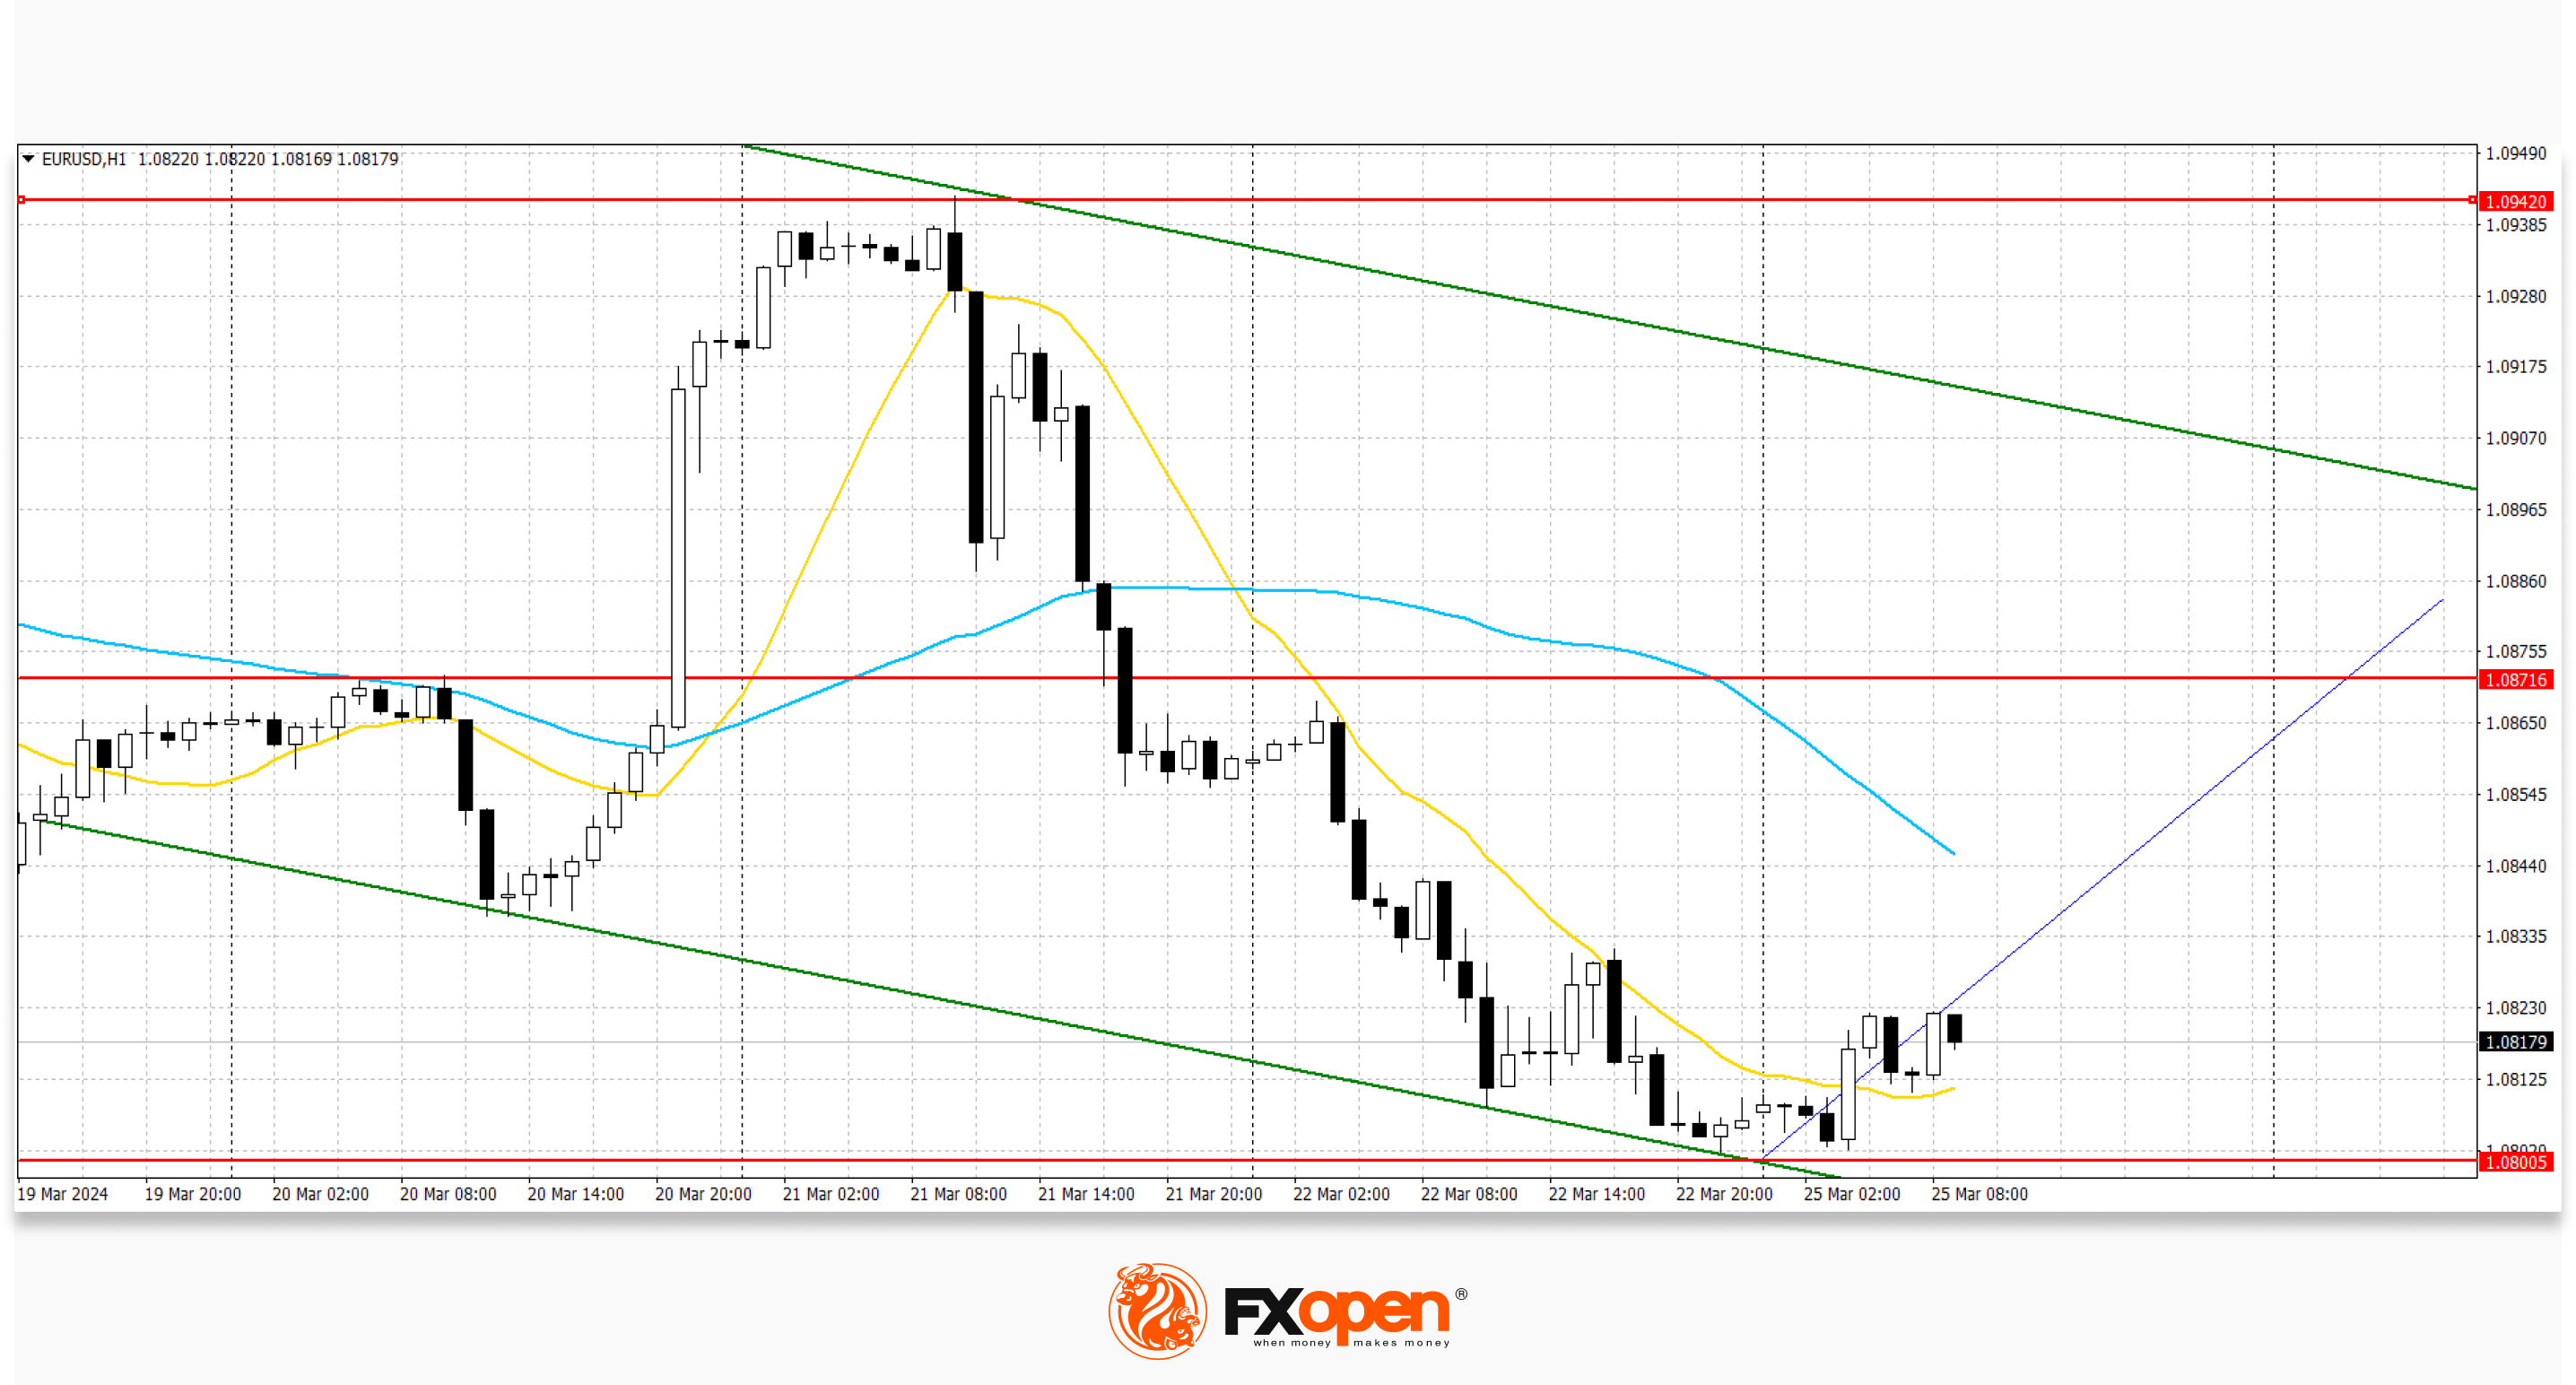
Based on last week's lows, a new downward channel has formed. Now the price has moved away from the lower border of the channel and may continue to rise towards the upper border.
GBP/USD
The GBP/USD pair is testing the 1.2600 mark for a breakout upward: the instrument is recovering losses from the end of last week, but activity in the market remains low. Immediate resistance can be seen at 1.2678, a break higher could trigger a rise towards 1.2802. On the other hand, the nearest support on the GBP/USD chart is visible at 1.2575, a break below could take the pair towards 1.2535.
The pound fell to its lowest level this month on Friday after data showed UK consumer spending stagnated in February and Bank of England (BoE) Governor Andrew Bailey said rate cuts were "in play" this year. UK retail sales stagnated in February after rising a revised 3.6% in January, Office for National Statistics data showed on Friday. The Bank of England left interest rates unchanged on Thursday but suggested in a statement that it was moving closer to making changes. Additionally, two members of the Monetary Policy Committee who had previously voted to raise rates instead voted to maintain them, which many in the market did not expect. Sterling fell 0.6% to $1.2599, its lowest level since March 1.
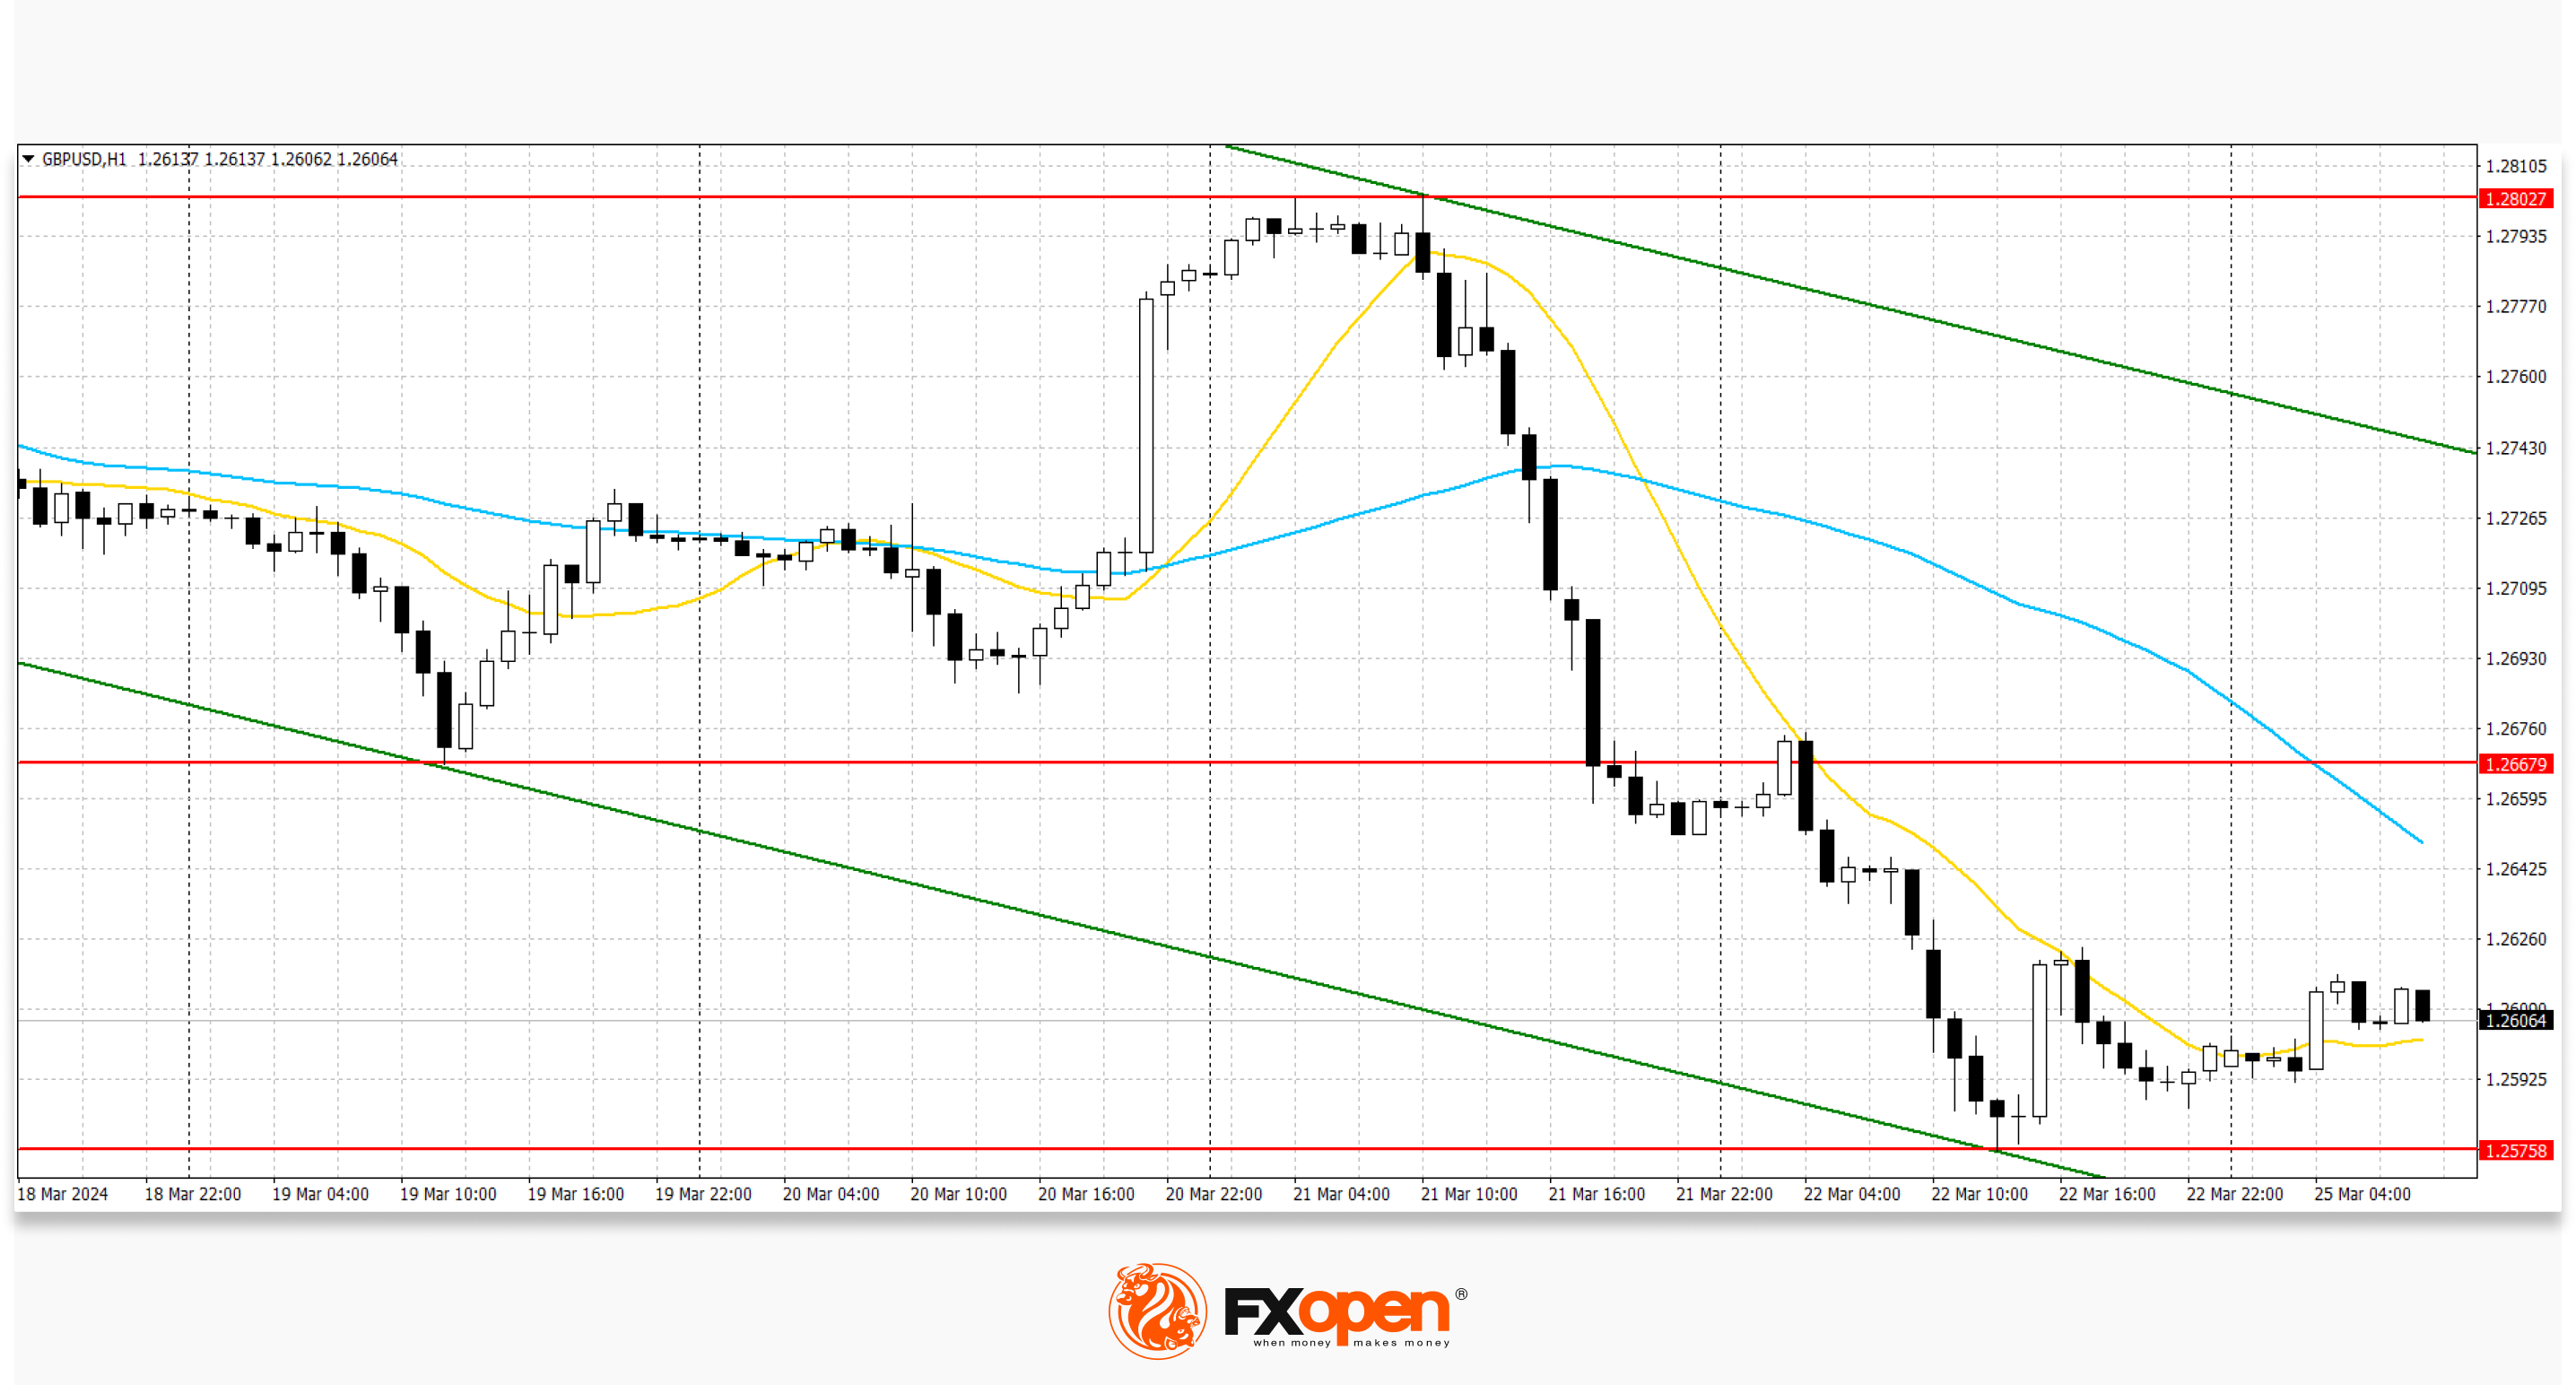
Based on last week's lows, a new downward channel has formed. Now the price has moved away from the lower border of the channel and may continue to rise towards the upper border.
USD/JPY
The USD/JPY pair shows mixed dynamics, holding close to 151.30. Strong resistance can be seen at 151.84, a break higher could trigger a rise towards 152.50. On the other hand, the nearest support on the USD/JPY chart is visible at 150.27. A break below could take the pair towards 148.91.
The dollar weakened against the yen on Friday after the release of consumer inflation data in Japan. Core inflation in Japan accelerated in February, but an index measuring broader price trends slowed sharply, data showed, highlighting uncertainty about how soon the central bank will raise interest rates again. The core consumer price index (CPI), which excludes fresh produce but includes energy, rose 2.8% in February from a year earlier, government data showed, in line with average market forecasts. Bank of Japan Governor Ueda said on Tuesday the central bank could raise rates again if inflation exceeds expectations or risks of rising prices rise significantly. On Friday, March 29, consumer inflation data in the Tokyo region for March will be published, as well as February statistics on retail sales and industrial production. Forecasts suggest an increase in retail sales from 2.3% to 3.0%.
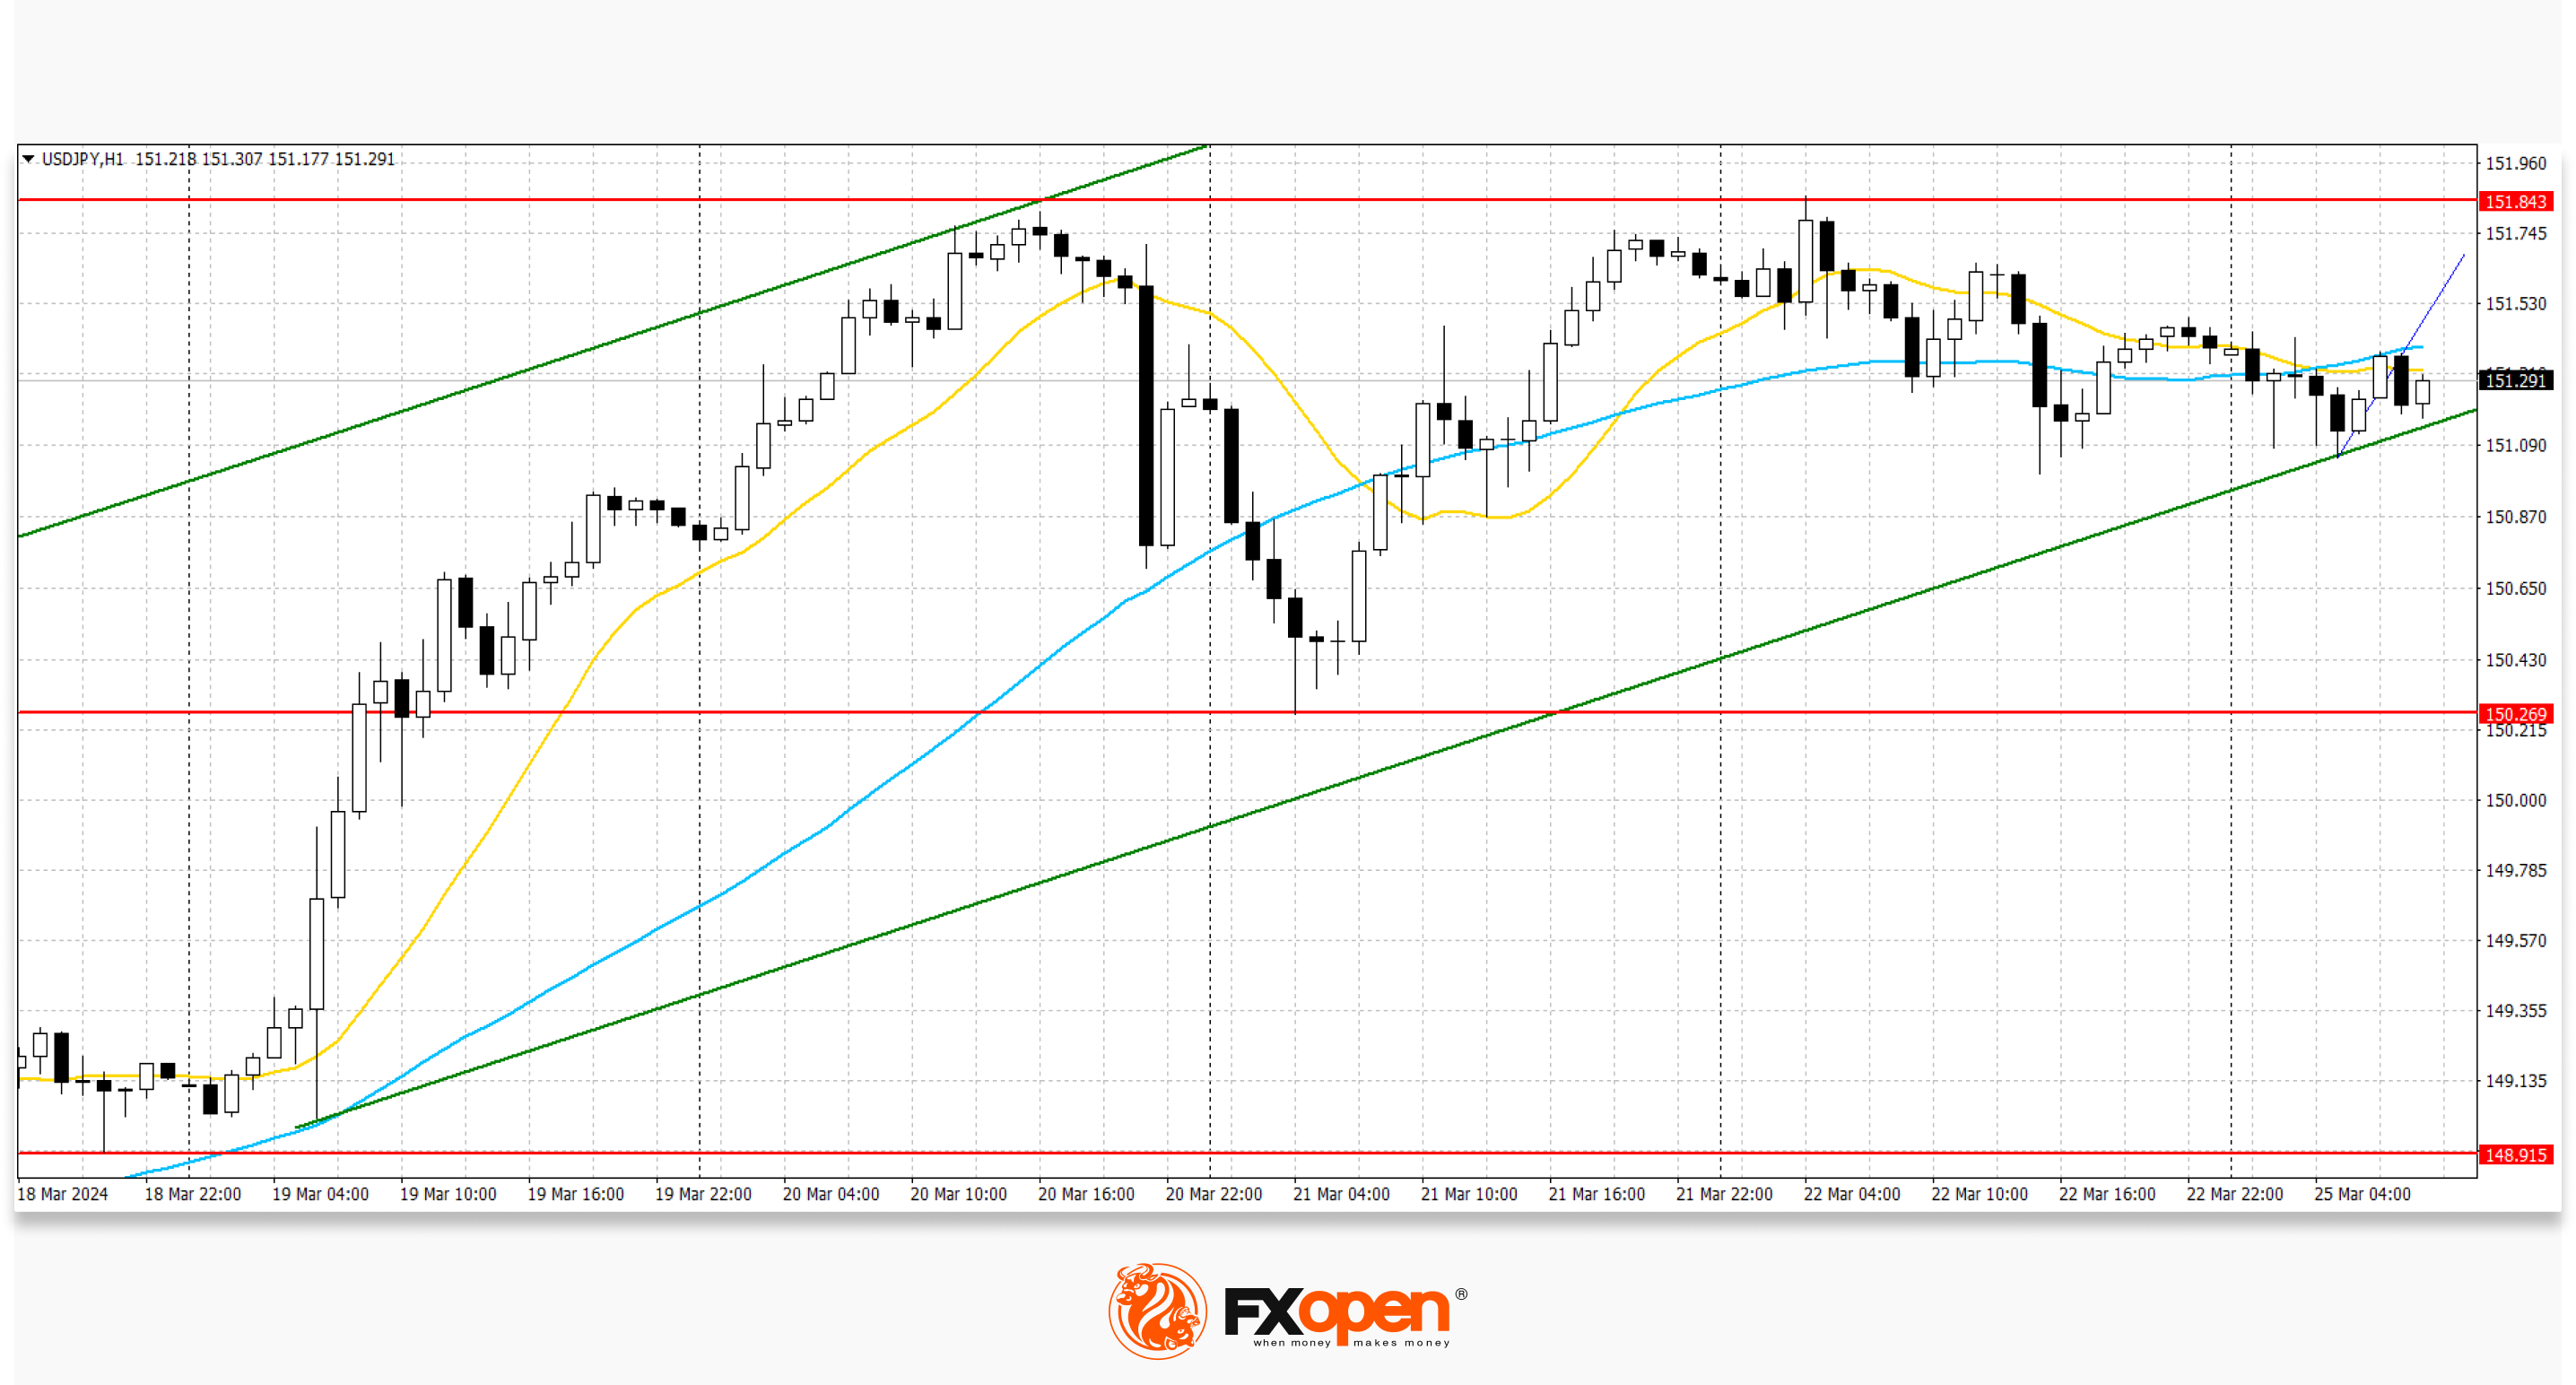
Based on the highs of last week, a new ascending channel has formed. Now the price is near the lower border and may continue to move along this line.
This article represents the opinion of the Companies operating under the FXOpen brand only. It is not to be construed as an offer, solicitation, or recommendation with respect to products and services provided by the Companies operating under the FXOpen brand, nor is it to be considered financial advice.
Stay ahead of the market!
Subscribe now to our mailing list and receive the latest market news and insights delivered directly to your inbox.

Latest articles

DAX 40: consolidation amid technology sell-off
A wave of selling in the technology sector that emerged earlier this week has weighed on European equities. The trigger was investor concern over the profitability of large-scale debt-funded investments by major US tech companies in AI infrastructure. The Nasdaq

Euro Hits Fresh Yearly Lows Amid Dovish ECB Signals
The euro remains under pressure following weak macroeconomic data from the euro area and fresh signals that the European Central Bank is prepared to maintain a more accommodative monetary policy stance. Data released yesterday pointed to a deterioration in business

Pound at Key Levels: Markets Assess Impact of Political Uncertainty in the UK
The British pound remains under pressure following increased political uncertainty in the United Kingdom triggered by the Prime Minister’s resignation. Investors are assessing potential shifts in the political and economic policy outlook after the head of government stepped down,