FXOpen

The US Federal Reserve will publish its interest rate decision on Wednesday, December 13th. The American regulator is not expected to take steps towards tightening or easing monetary policy, given the strong November labour market report published last Friday. Thus, the number of new jobs created by the American economy outside the agricultural sector increased by 199.0k after an increase of 150.0k in the previous month, while analysts expected 180.0k. At the same time, the unemployment rate decreased from 3.9 % to 3.7%, and the growth rate of average hourly wages accelerated from 0.2% to 0.4%.
The dollar was further supported by an increase in the consumer confidence index from the University of Michigan in December from 61.3 points to 69.4 points, which turned out to be significantly higher than expected 62.0 points.
EUR/USD
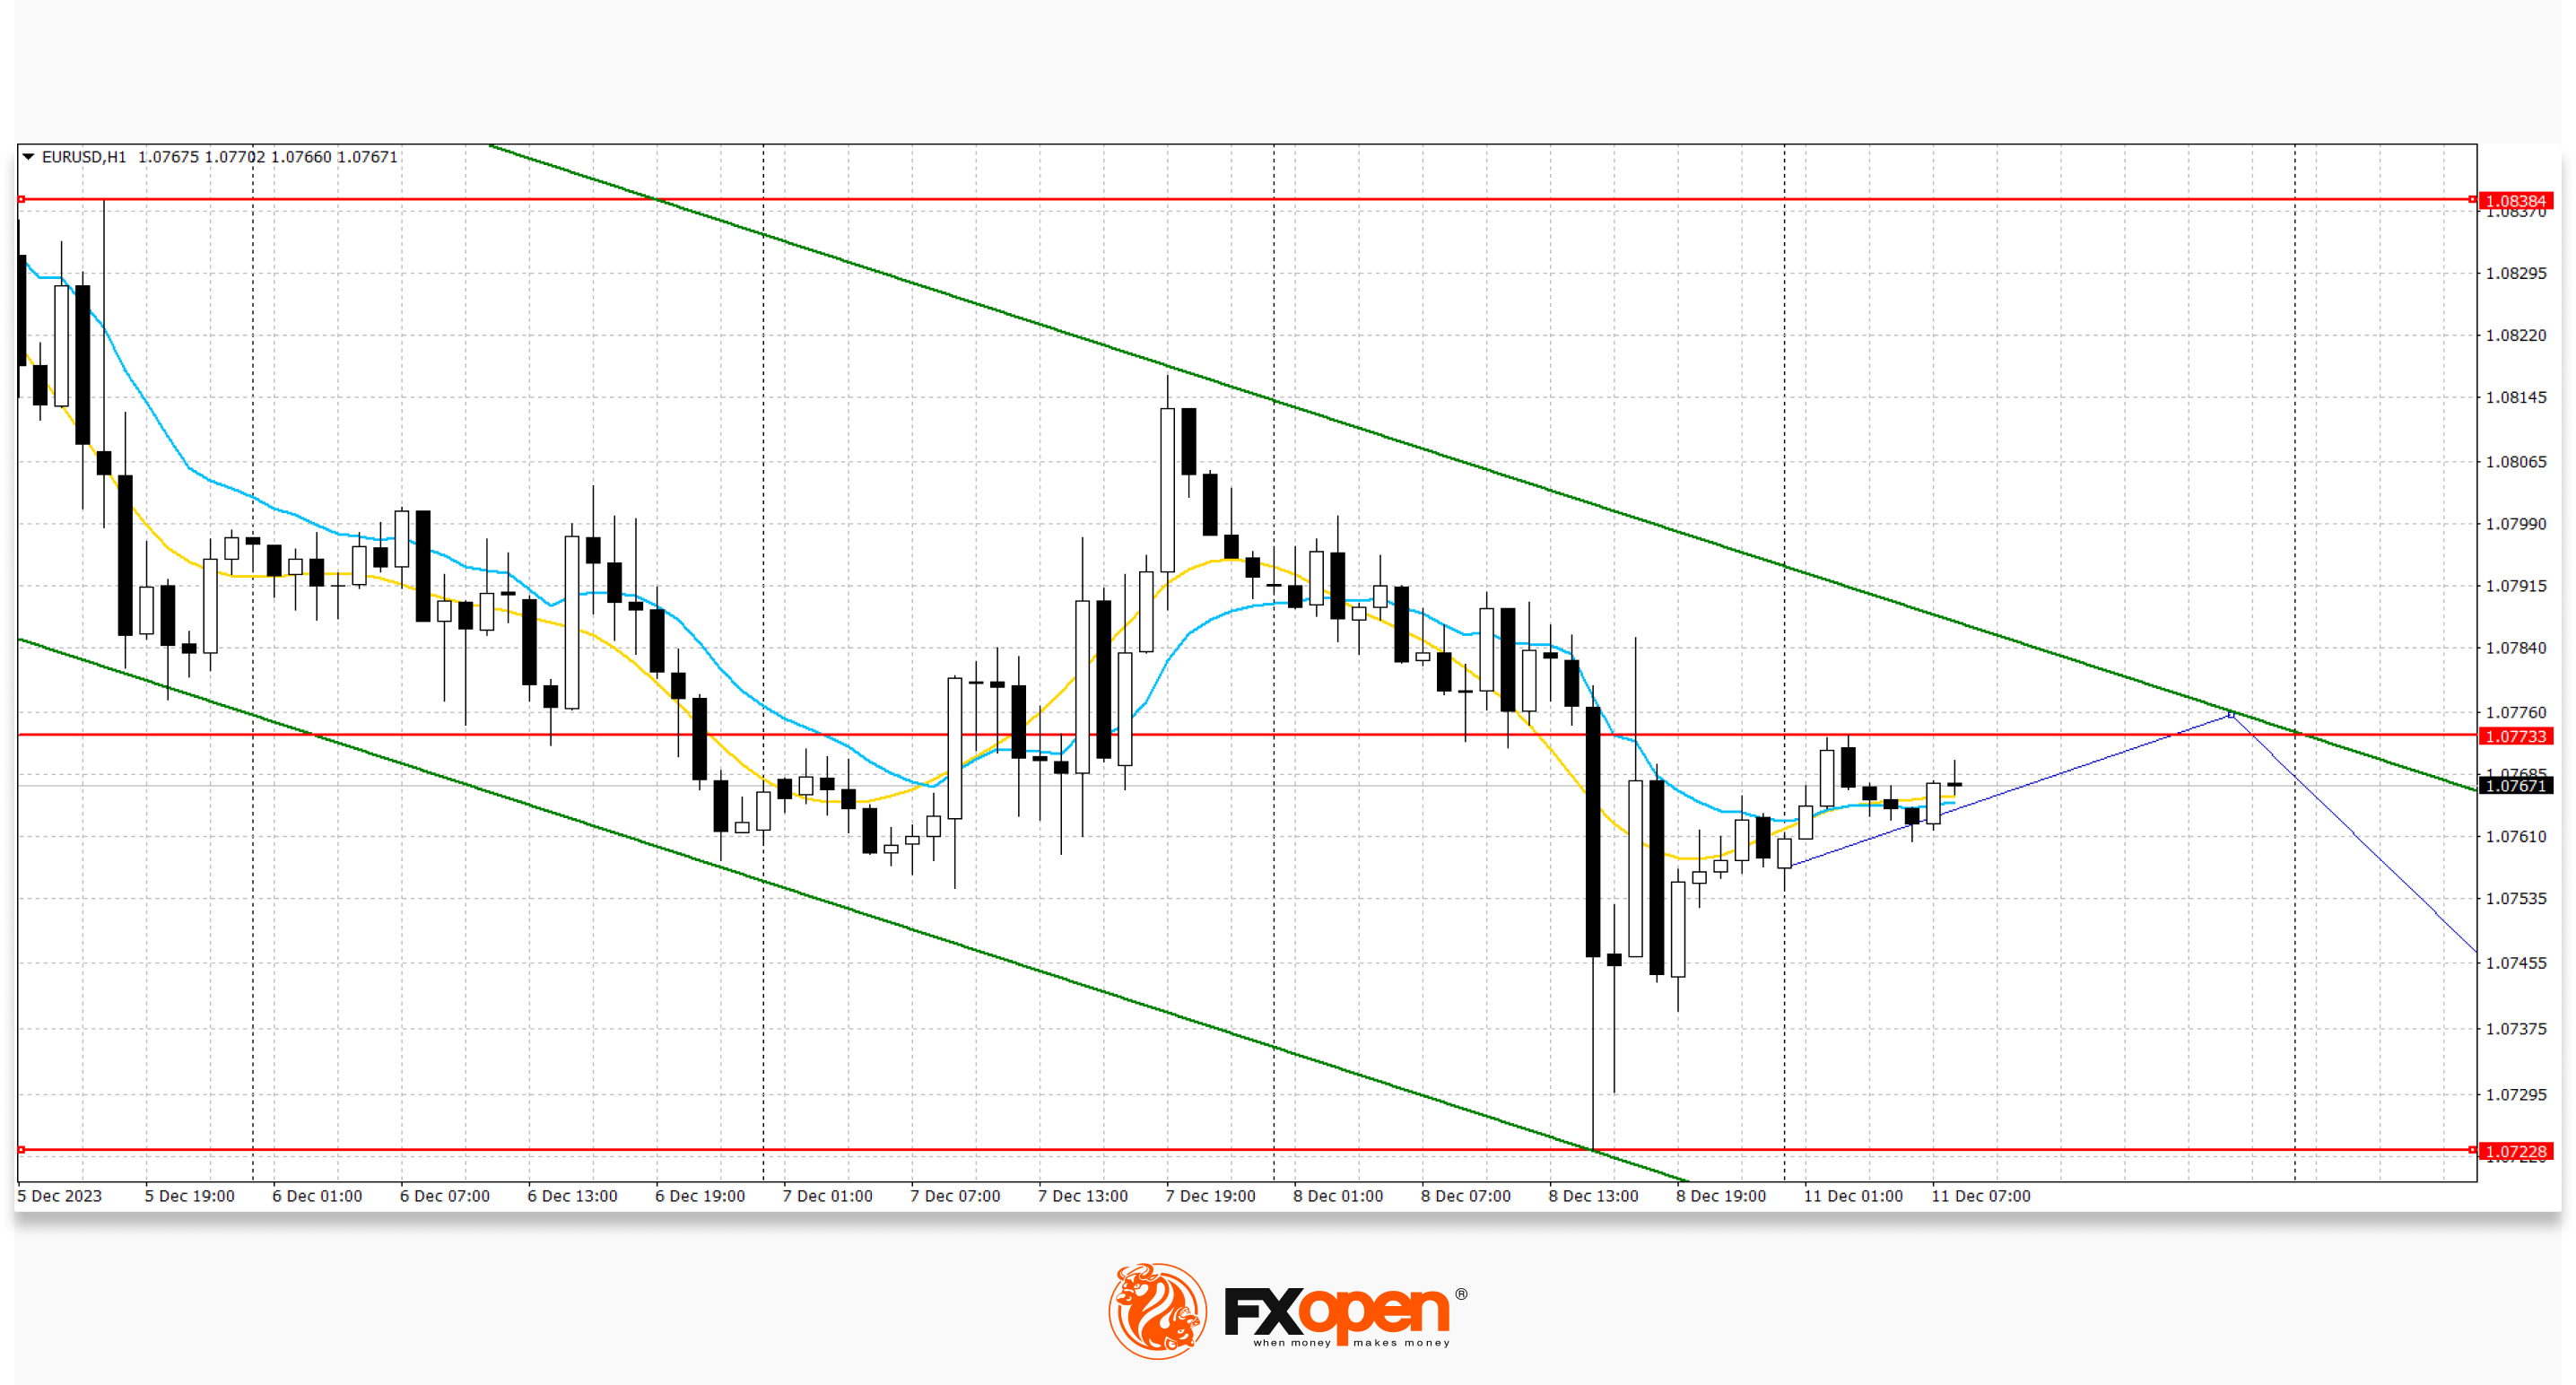
According to the EUR/USD technical analysis, the pair shows mixed dynamics, remaining close to 1.0760. Immediate resistance can be seen at 1.0789, a break higher could trigger a move towards 1.0842. On the downside, immediate support is seen at 1.0770, a break below could take the pair towards 1.0714.
Activity in the market remains quite low, as investors are in no hurry to open new trading positions ahead of the meetings of the world's leading central banks this week. So, on Thursday, meetings of the ECB, the Swiss National Bank, and the Bank of England will be held. Investors expect all regulators to maintain current monetary policy without changes, and special attention will be paid to the comments of their representatives, as well as the general tone of their statements.

The downward channel is maintained. Now, the price is in the middle of the channel and may continue to decline after approaching the upper limit.
GBP/USD
On the GBP/USD chart, the pair remains virtually unchanged, holding near 1.2535 and consolidating after a moderate decline last week. Immediate resistance can be seen at 1.2623, a break higher could trigger a rise towards 1.2653. On the downside, immediate support is seen at 1.2549, a break below could take the pair towards 1.2507.
Traders are in no hurry to open new positions ahead of the publication of macroeconomic statistics. The Bank of England will meet on Thursday. As analysts hope, plans for a possible interest rate cut will be adjusted. In 2024, the value is expected to decrease from the US Federal Reserve, the Bank of England, and the ECB. It is likely that all regulators will begin implementing a program to ease monetary conditions at different times, but now the leadership of the British department is trying to convince markets that discussing specific timing for reducing interest rates is somewhat premature. Meanwhile, pressure on the pound's positions at the end of last week was exerted by data on the American labour market.

The downward channel is maintained. Now, the price is in the middle of the channel and may continue to decline.
USD/JPY
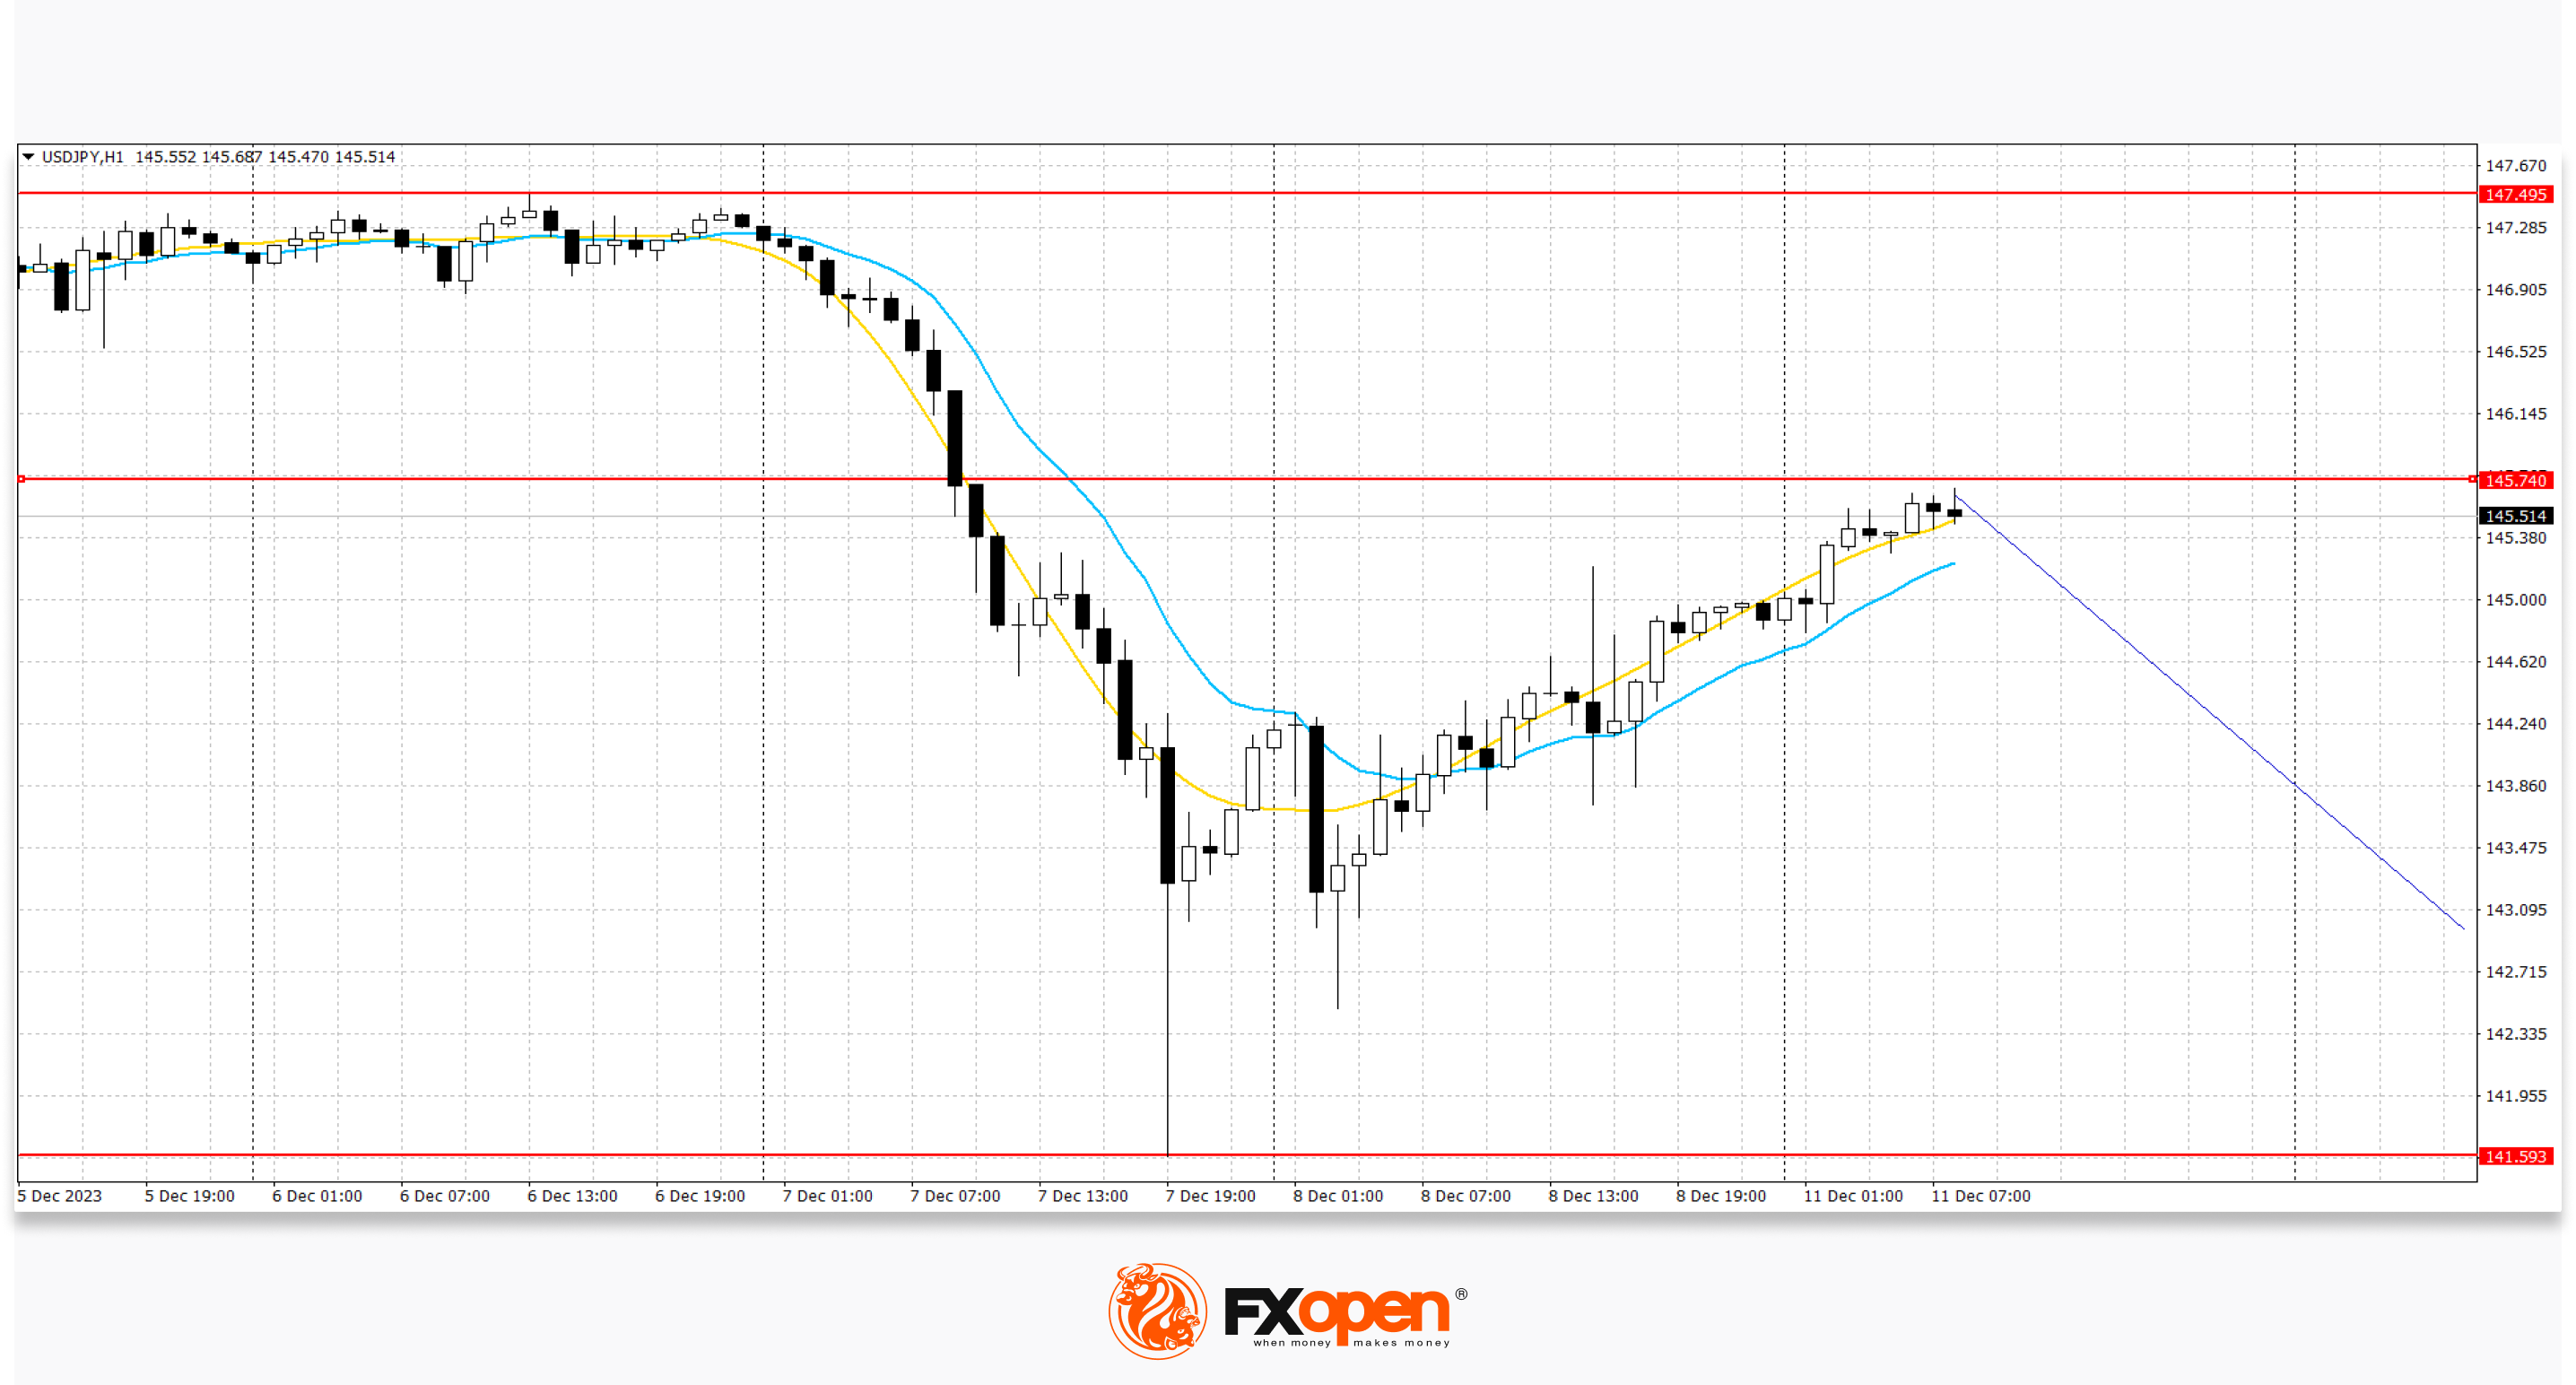
On the USD/JPY chart, the pair is showing active corrective growth, developing the bullish momentum formed last Friday. The pair is correcting after a sharp rise in the yen, which was supported by statements from representatives of the Bank of Japan. Strong resistance can be seen at 144.41, a break higher could trigger a rise towards 146.57. On the downside, immediate support is seen at 143.95. A break below could take the pair towards 142.49.
Bank of Japan Governor Kazuo Ueda notified markets that the bank is currently considering various scenarios for managing borrowing cost limits once interest rates return to positive territory. Investors took the official's statements as a signal for the possible end of the long cycle of ultra-loose monetary policy, but no specific statements were made regarding this. Meanwhile, macroeconomic data from Japan released on Friday pointed to a faster slowdown in the national economy than initially estimated. Thus, gross domestic product in the third quarter decreased by 0.7% after a decrease of 0.5% in the previous period, while analysts expected the same dynamics to continue, and in annual terms the indicator accelerated the decline from -2.1% to -2,9%.

Over the past week, a range of quotes has formed with boundaries of 141.60 and 147.50. Now, the price is at the bottom of the range and may continue to decline.
Trade over 50 forex markets 24 hours a day with FXOpen. Take advantage of low commissions, deep liquidity, and spreads from 0.0 pips. Open your FXOpen account now or learn more about trading forex with FXOpen.
This article represents the opinion of the Companies operating under the FXOpen brand only. It is not to be construed as an offer, solicitation, or recommendation with respect to products and services provided by the Companies operating under the FXOpen brand, nor is it to be considered financial advice.
Stay ahead of the market!
Subscribe now to our mailing list and receive the latest market news and insights delivered directly to your inbox.


