


EUR/USD, GBP/USD, and USD/JPY Analysis: US Dollar Growing Against Euro and Pound
FXOpen

The US personal consumer spending price index rose 3% in October from a year earlier, down from the three-month rate of 3.4%, although still above the Fed's 2% target, raising the possibility of an early rate cut. Jobless claims rose over the past week, indicating a slowing labour market. Inflation, as measured by the price index for personal consumption expenditures (PCE), remained unchanged in October after rising 0.4% in September.
EUR/USD
According to the technical analysis of EUR/USD, the pair is showing noticeable growth, correcting after an active decline the day before, which turned out to be the most significant in the last few weeks. The euro is testing the 1.0900 mark for an upward breakout, awaiting the publication of macroeconomic statistics from the EU and the USA. Among other things, speeches are expected throughout the day from the heads of the US Federal Reserve and the ECB, who are likely to comment on the likelihood of ending the monetary policy tightening program amid a sharp slowdown in price pressure.
The day before, November inflation data was published in the eurozone. The consumer price index in annual terms fell from 2.9% to 2.4%, which was significantly lower than forecasts of 2.7% and was the slowest growth rate since July 2021, and in monthly terms the figure was -0.5%. Core inflation slowed from 4.2% to 3.6% in annual terms, which was also below expectations at 3.9%, and in monthly terms the index decreased by 0.6%. At the same time, the day before, ECB head Christine Lagarde said that price growth could resume in the near future due to certain factors.
Immediate resistance can be seen at 1.0940, a break higher could trigger a rise towards 1.1000. On the downside, immediate support is seen at 1.0872, a break below could take the pair towards 1.0800.
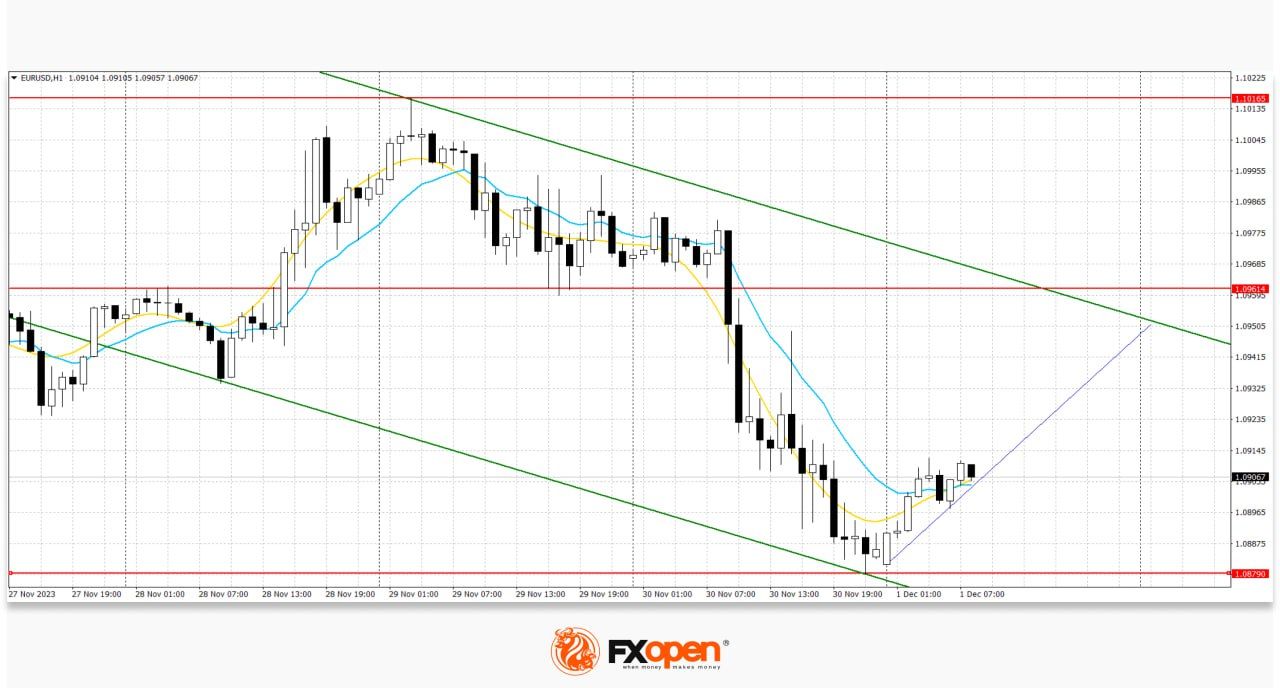
Based on the lows of two days, a new downward channel has formed. Now the price has moved away from the lower border of the channel and may continue to rise.
GBP/USD
On the GBP/USD chart, The pair is trading with upward dynamics, recovering after a sharp decline the day before. The instrument is testing the 1.2639 level for an upward breakout, however, there are not many noticeable growth factors at the end of the week. Investors are awaiting the publication of macroeconomic statistics from the UK and the US, but there is a significant likelihood that the previous low activity in the market will continue. The focus of investors' attention on Friday is statistics on business activity in the manufacturing sector in the UK and US from S&P Global and from the Institute of Supply Management (ISM). Forecasts suggest a decline in the UK PMI in November from 46.7 points to 46.6 points, while the US manufacturing index could rise from 46.7 points to 47.6 points.
Immediate resistance can be seen at 1.2711, a break higher could trigger a rise towards 1.2732. On the downside, immediate support is seen at 1.2618, a break below could take the pair towards 1.2606.
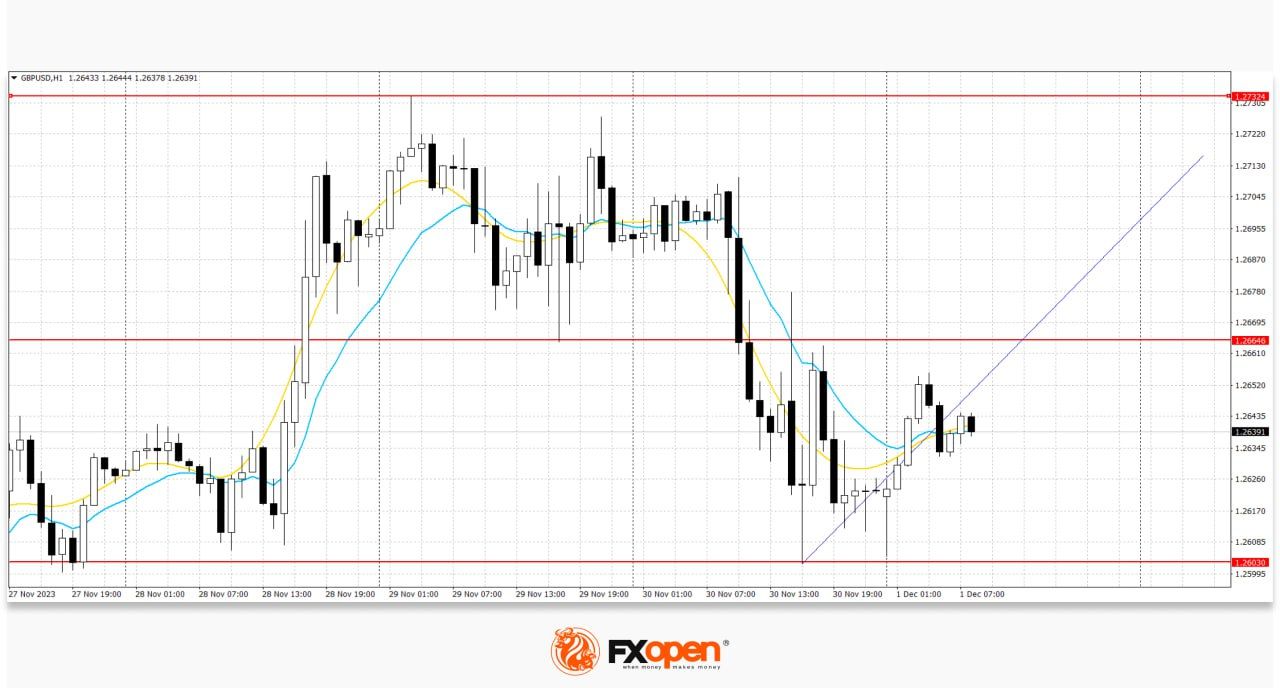
During the week, a trading range formed with boundaries of 1.2600 and 1.2730. Now, the price has moved away from the lower limit of the range and may continue to rise.
USD/JPY
The USD/JPY pair is trading in a different direction, consolidating near the 149.10 mark. The day before, the instrument showed fairly active growth, while the macroeconomic background from the United States remained ambiguous. Meanwhile, Japanese statistics yesterday reflected a slowdown in the annual dynamics of retail sales in October from 6.2% to 4.2%, which turned out to be worse than expectations at 5.9%, and in monthly terms the figure decreased by 1.6% after -0 .1% a month earlier. Data from Japan, published today, supported the yen's position: the Jibun Bank Manufacturing PMI adjusted from 48.1 points to 48.3 points in November, and the unemployment rate dropped from 2.6% to 2.5% in October.
On the USD/JPY chart, strong resistance can be seen at 147.98, a break higher could trigger a rise towards 148.74. On the downside, immediate support is seen at 146.61. A break below could take the pair towards 146.00.
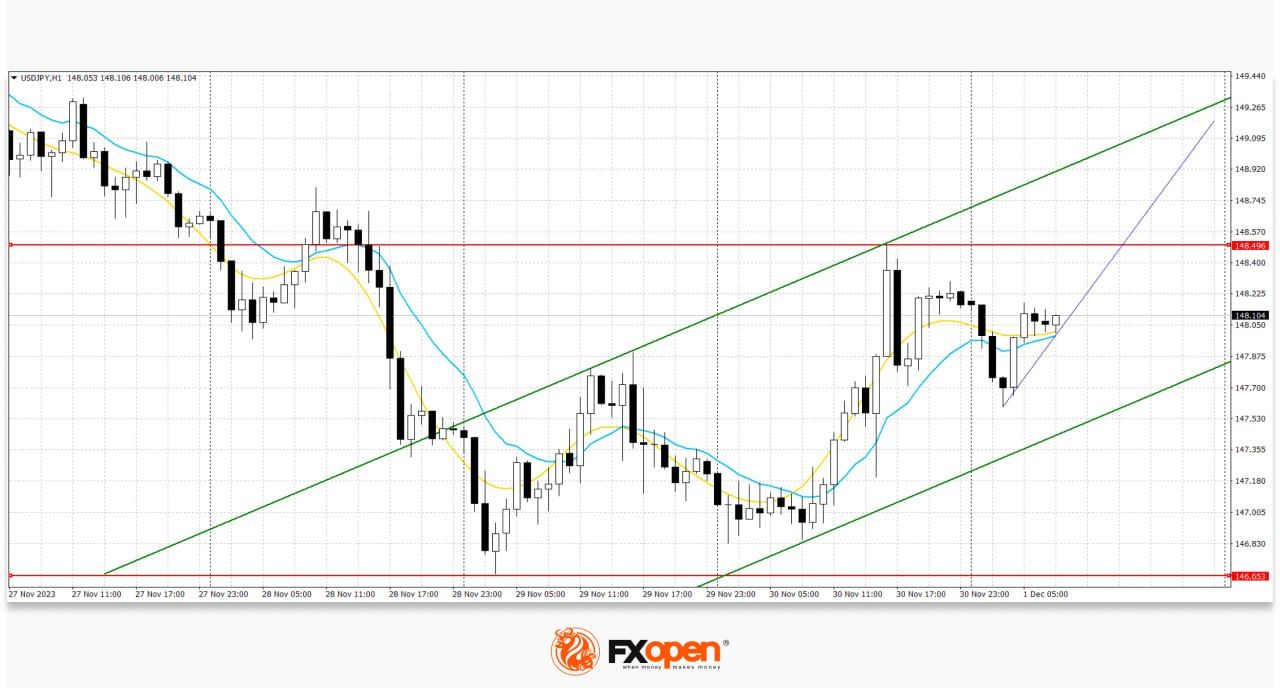
Based on the highs of two days, a new ascending channel has formed. Now, the price is in the middle of the channel and may continue to rise.
Trade over 50 forex markets 24 hours a day with FXOpen. Take advantage of low commissions, deep liquidity, and spreads from 0.0 pips (additional fees may apply). Open your FXOpen account now or learn more about trading forex with FXOpen.
This article represents the opinion of the Companies operating under the FXOpen brand only. It is not to be construed as an offer, solicitation, or recommendation with respect to products and services provided by the Companies operating under the FXOpen brand, nor is it to be considered financial advice.
Stay ahead of the market!
Subscribe now to our mailing list and receive the latest market news and insights delivered directly to your inbox.


Latest articles

Weekly Market Insights with Gary Thomson: The Week of Central Banks and Earnings
In this video, we’ll explore the key economic events and market trends, shaping the financial landscape. Get ready for insights into financial markets to help you navigate the week ahead. Let’s dive in!
In this episode of Market

Intel at a Crossroads: Earnings Beat Meets Technical Resistance
Intel has just delivered its strongest quarter in over fifteen years, and the market reaction says it all. Q2 2026 revenue surged 25% year-over-year to $16.1 billion, crushing the consensus estimate of $14.42 billion, while adjusted EPS of

Tesla: Complex Range Structure Breaks Down Following Quarterly Earnings
Tesla released its Q2 2026 results after the market closed on 22 July. Revenue increased 26% year-on-year to $28.24 billion, while vehicle deliveries reached a record 480,126 units. However, operating margin fell sharply to 1.4%, down from