


EUR/USD, GBP/USD, USD/JPY Analysis: Dollar Stable Despite Weak Employment Data
FXOpen

Yesterday, statistics from the United States on the dynamics of open vacancies from JOLTS were published. In October, their number decreased by 617.0k to 8.733 million, which turned out to be the lowest result since the beginning of 2021, while analysts expected a reduction from 9.35 million to 9.30 million. Further cooling of the American labour market, along with the weakening of inflation risks, serves as a factor in favour of the expected completion of the cycle of tightening monetary policy by the US Federal Reserve. Some experts suggest that interest rate reductions will begin as early as March 2024.
November data on business activity in the services sector provided support to the American currency: the index from the Institute for Supply Management (ISM) rose from 51.8 points to 52.7 points, which turned out to be better than forecasts of 52.0 points. The US dollar index remains at 103.400.
On Friday, final labour market statistics for November will be published: analysts suggest that the number of new jobs created outside the agricultural sector will increase from 150.0k to 185.0k, unemployment will remain at 3.9%, and the average hourly wages will increase from 0.2% to 0.3% in monthly terms.
EUR/USD
According to the EUR/USD technical analysis, the pair shows mixed dynamics, consolidating near the 1.0800 mark and new local lows from November 14, updated the day before. Immediate resistance can be seen at 1.0836, a break higher could trigger a move towards 1.0878. On the downside, immediate support is seen at 1.0800, a break below could take the pair towards 1.0731.
European statistics on business activity turned out to be positive: the indicator in the non-manufacturing sector increased from 47.8 points to 48.7 points, exceeding expectations at 48.2 points, and the composite index - from 46.5 points to 47.6 points with a forecast of 47.1 points. The German services business activity index rose from 48.2 points to 49.6 points, and the composite index from 45.9 points to 47.8 points. Indicators remained stagnant, confirming that the eurozone economy is approaching recession, despite some recovery in consumption during the Christmas holidays.
The focus of investors today will be on October statistics from the eurozone on the dynamics of retail sales: in monthly terms, the indicator is expected to grow by 0.2% after a decrease of 0.3% a month earlier, and in annual terms - a decrease of 1.1% after -2,9%.
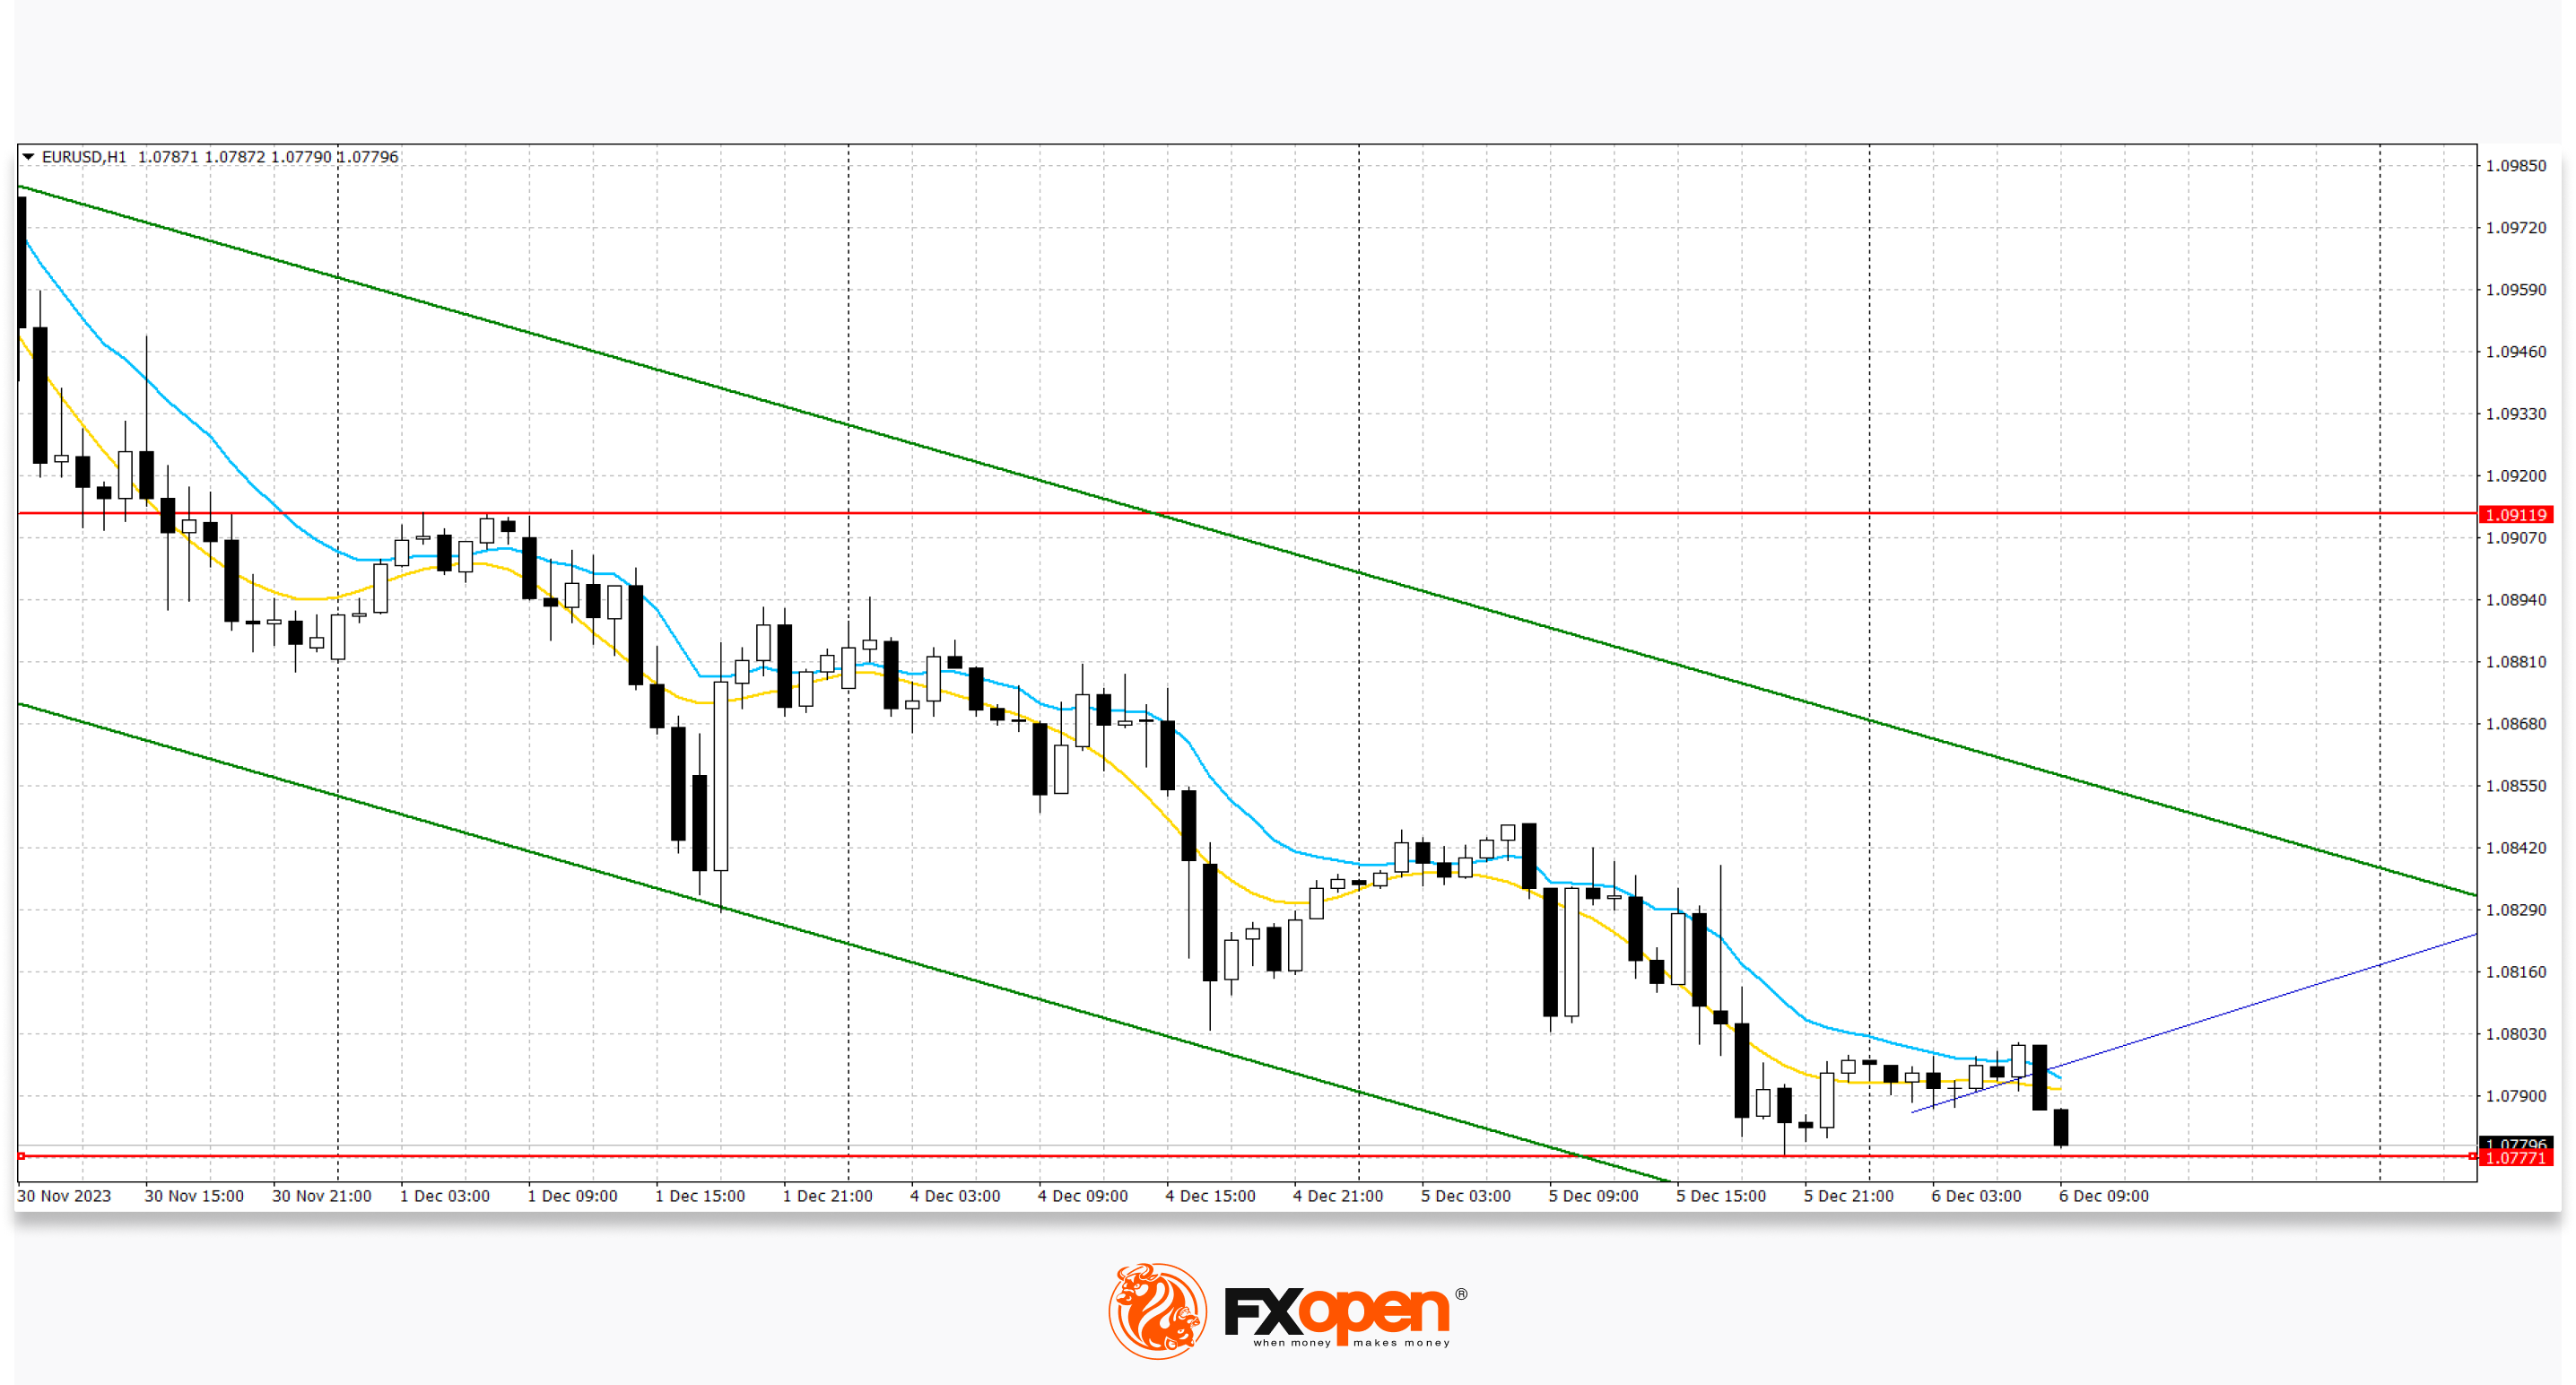
The downward channel is maintained. Now, the price is in the middle of the channel and may continue to decline.
GBP/USD
On the GBP/USD chart, the pair is trading with slight upward dynamics, recovering after a two-day decline, which did not allow the instrument to gain a foothold at new local highs of the end of August. The pair is testing the 1.2610 mark for a breakout upward, awaiting the emergence of new drivers for growth. Immediate resistance can be seen at 1.2625, a break higher could trigger a rise towards 1.2715. On the downside, immediate support is seen at 1.2594, a break below could take the pair towards 1.2545.
The focus of investors' attention today is the publication of the minutes of the Bank of England October meeting. Analysts expect to receive updated forecasts and views on the outlook for the British regulator's monetary policy, suggesting that officials will try to refrain from further interest rate increases in the near future. The British composite index from S&P Global in November rose from 50.1 points to 50.7 points with neutral forecasts, and the indicator in the services sector rose from 50.5 points to 50.9 points.
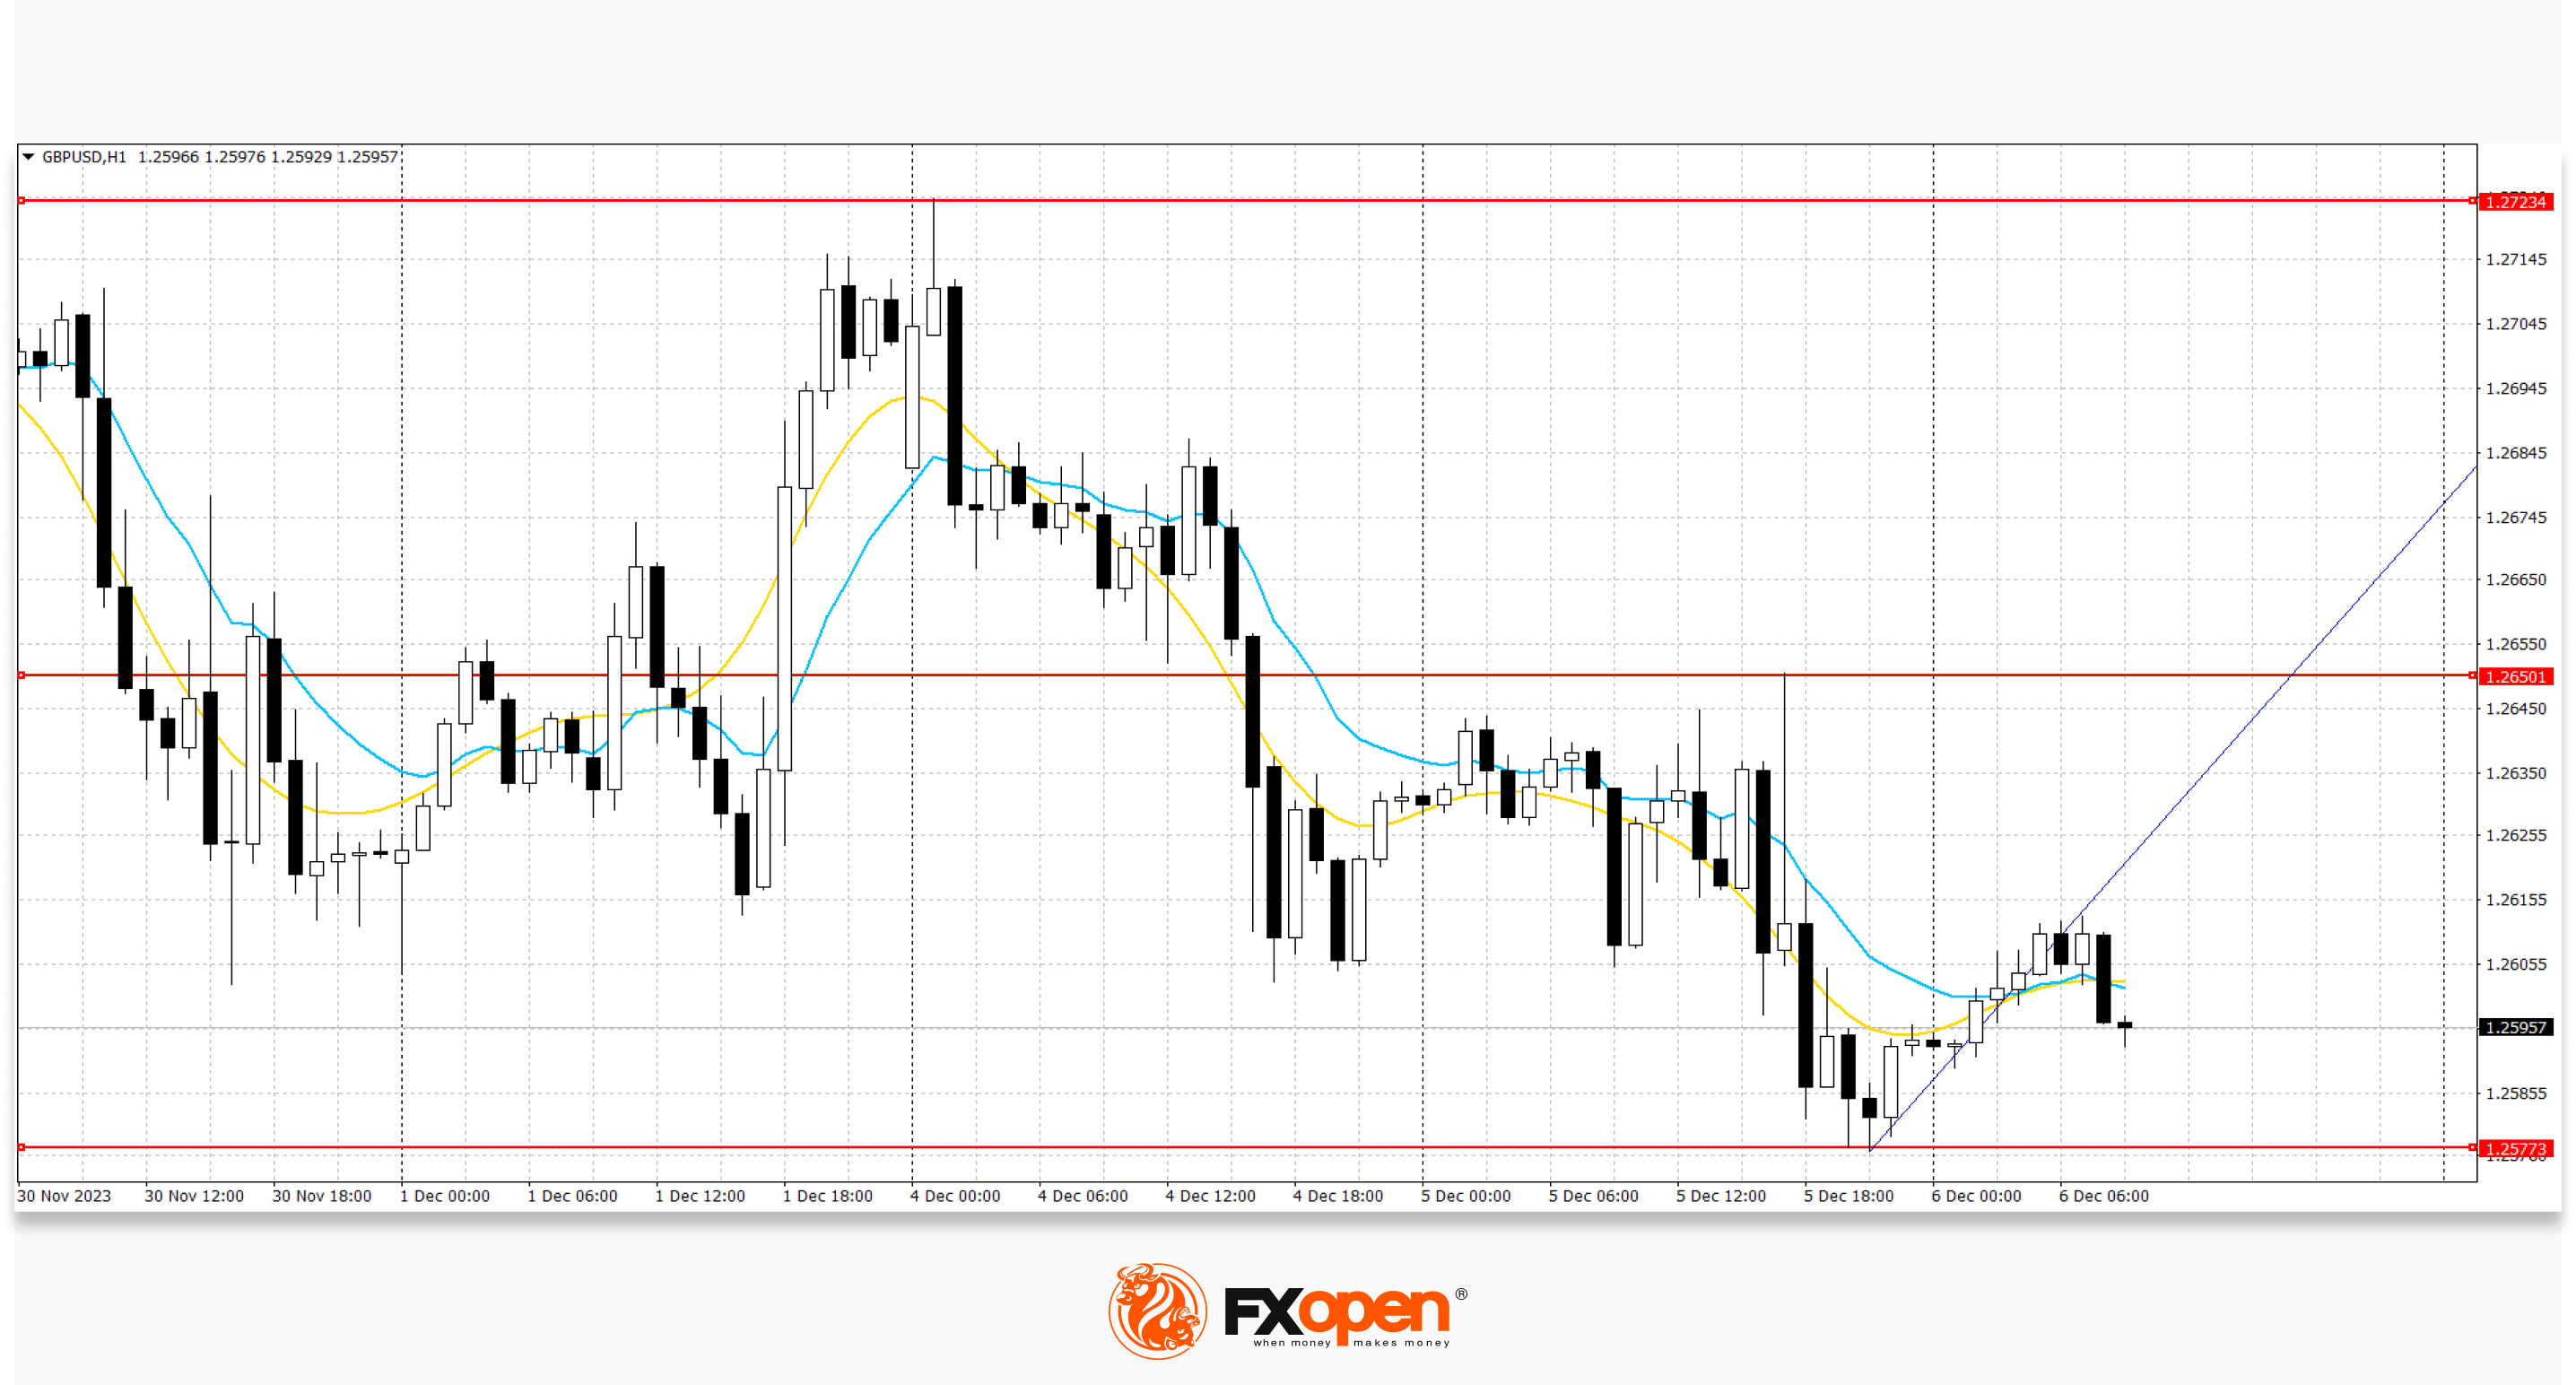
The same trading range with boundaries of 1.2600 and 1.2730 remains. Now, the price has moved away from the lower limit of the range and may continue to rise.
USD/JPY
On the USD/JPY chart, the pair is testing the 147.30 mark for a breakout upward, and the yen maintains its leadership, despite the local growth of the US dollar. Strong resistance can be seen at 147.35, a break higher could trigger a rise towards 148.08. On the downside, immediate support is seen at 146.35. A break below could take the pair towards 145.89.
Japanese macroeconomic statistics disappointed investors: the consumer price index in Tokyo in November fell from 3.3% to 2.6%, the core indicator adjusted from 2.7% to 2.3%, below the 2.4% forecast by analysts, and the overall expected consumer price indicator in Japan remained at 2.7%. The services business activity index fell from 51.6 points to 50.8 points, the lowest since December 2022.
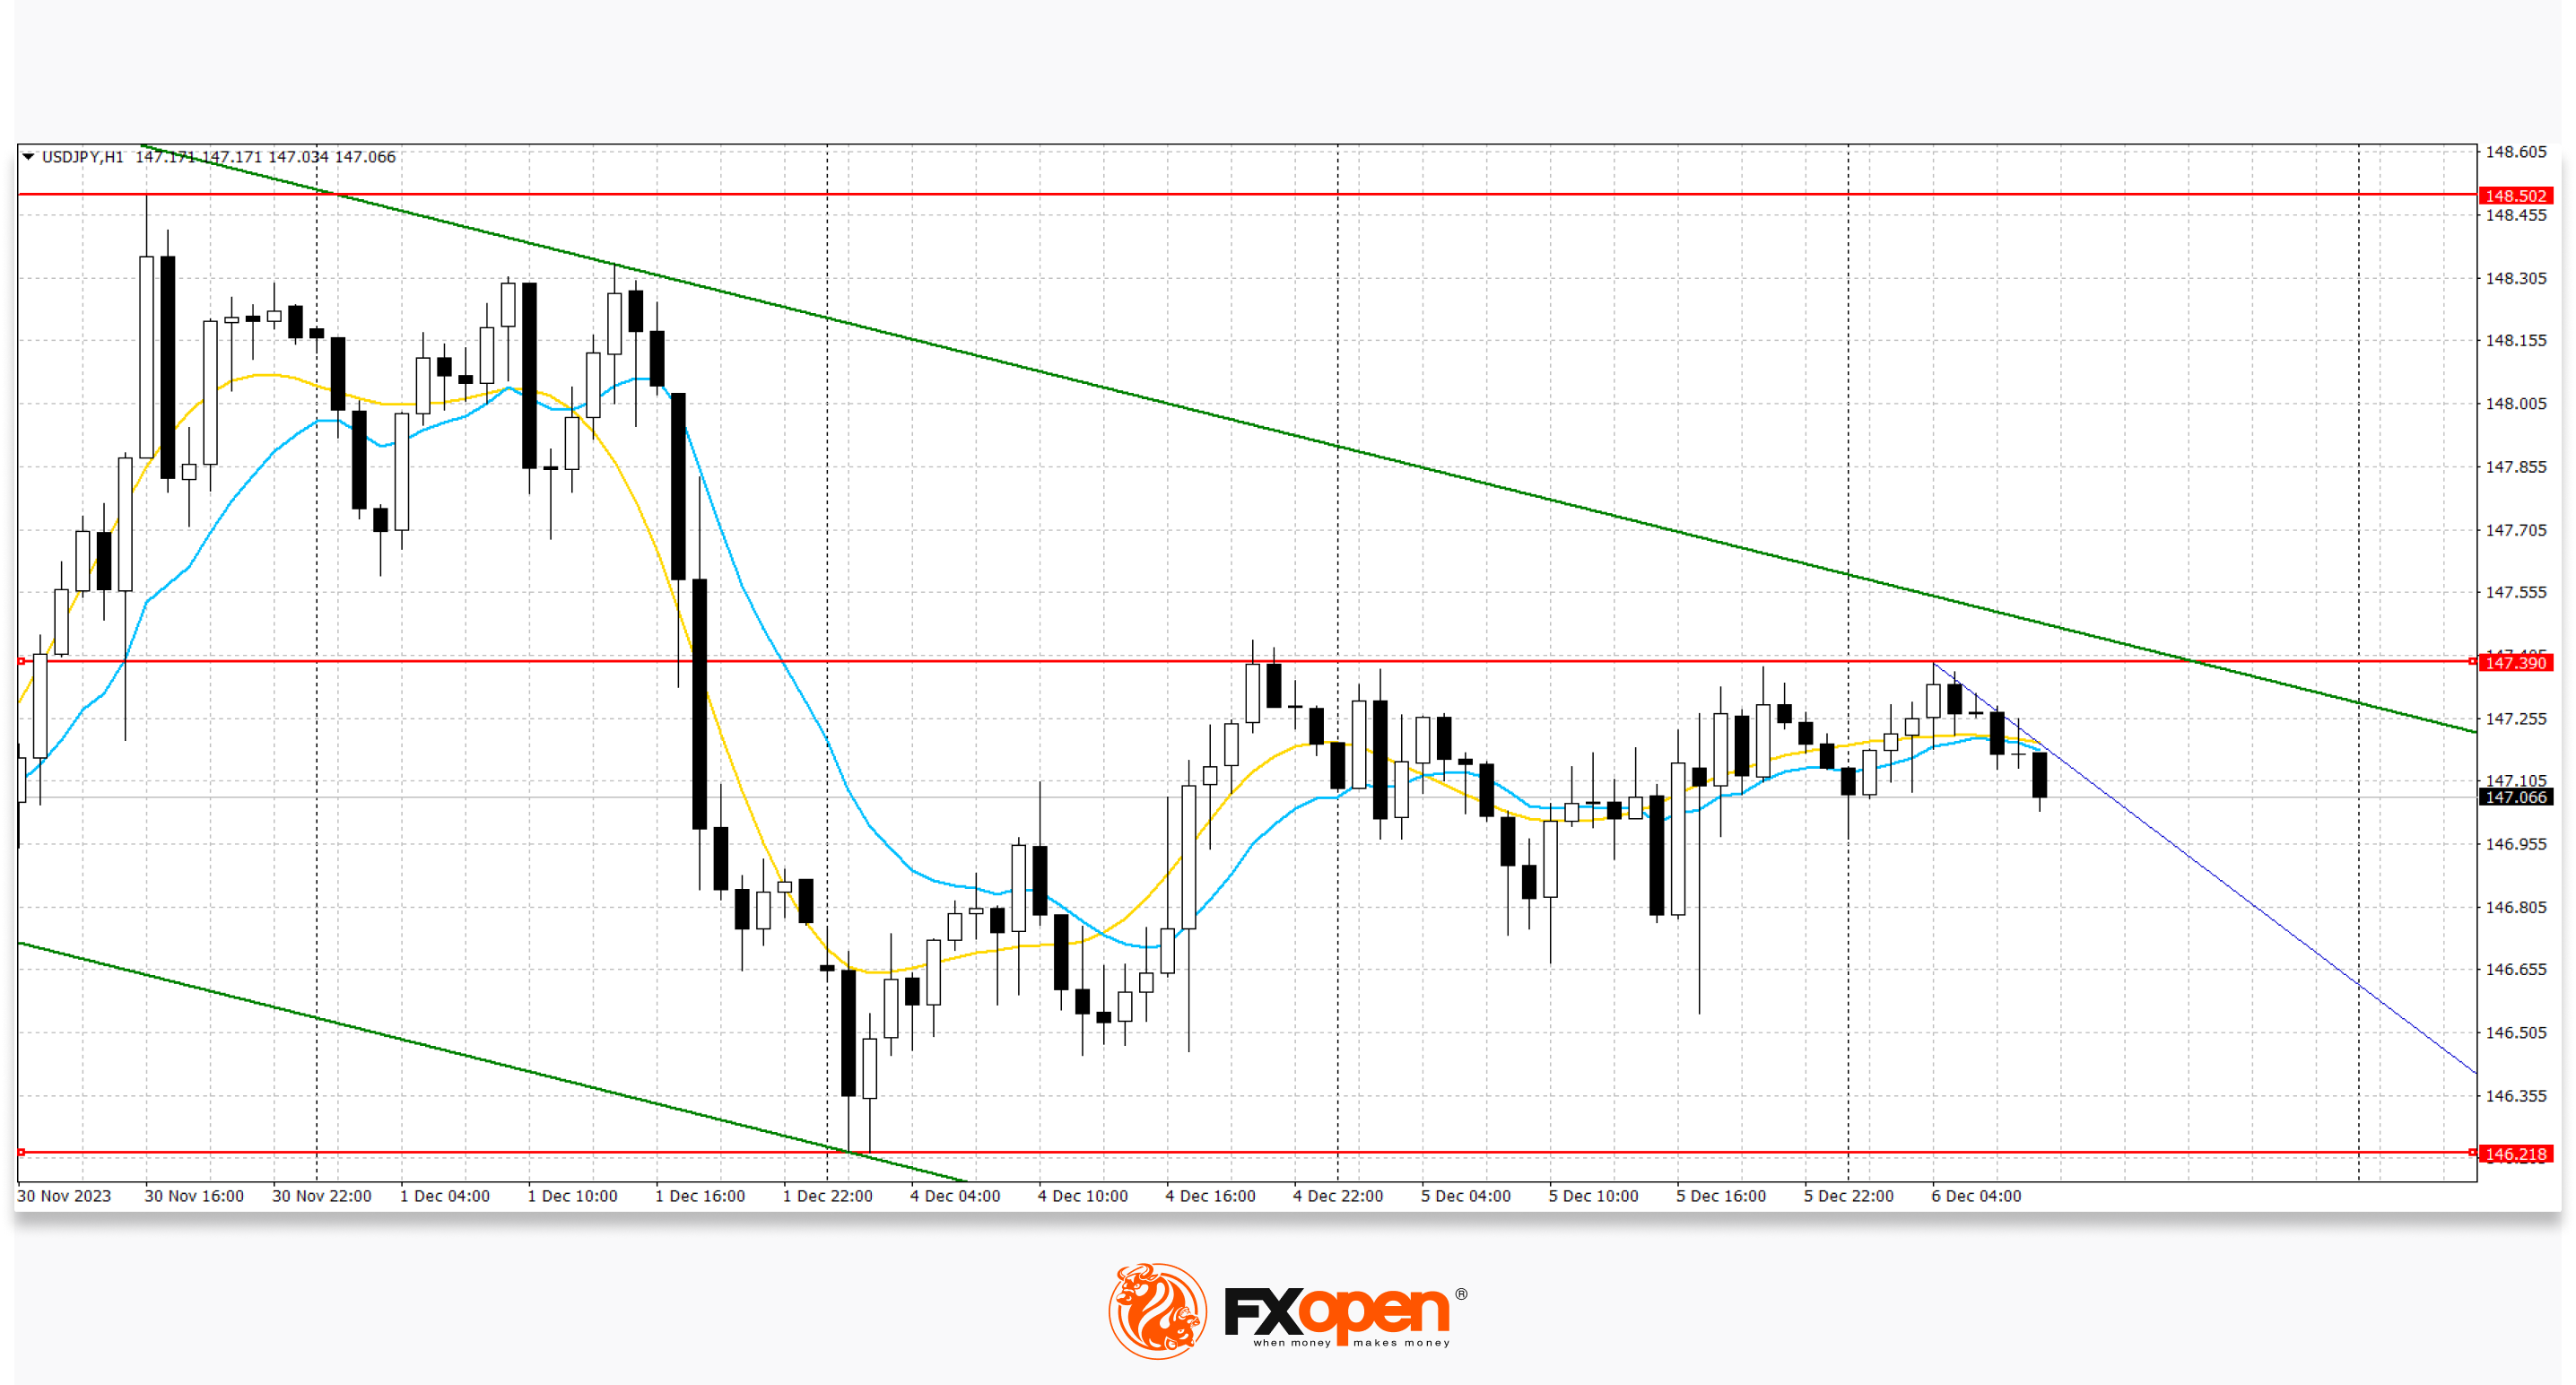
The previous downward channel remains. Now, the price has moved away from the upper border of the channel and may continue to decline.
Trade over 50 forex markets 24 hours a day with FXOpen. Take advantage of low commissions, deep liquidity, and spreads from 0.0 pips (additional fees may apply). Open your FXOpen account now or learn more about trading forex with FXOpen.
This article represents the opinion of the Companies operating under the FXOpen brand only. It is not to be construed as an offer, solicitation, or recommendation with respect to products and services provided by the Companies operating under the FXOpen brand, nor is it to be considered financial advice.
Stay ahead of the market!
Subscribe now to our mailing list and receive the latest market news and insights delivered directly to your inbox.


Latest articles

Weekly Market Insights with Gary Thomson: The Week of Central Banks and Earnings
In this video, we’ll explore the key economic events and market trends, shaping the financial landscape. Get ready for insights into financial markets to help you navigate the week ahead. Let’s dive in!
In this episode of Market

Intel at a Crossroads: Earnings Beat Meets Technical Resistance
Intel has just delivered its strongest quarter in over fifteen years, and the market reaction says it all. Q2 2026 revenue surged 25% year-over-year to $16.1 billion, crushing the consensus estimate of $14.42 billion, while adjusted EPS of

Tesla: Complex Range Structure Breaks Down Following Quarterly Earnings
Tesla released its Q2 2026 results after the market closed on 22 July. Revenue increased 26% year-on-year to $28.24 billion, while vehicle deliveries reached a record 480,126 units. However, operating margin fell sharply to 1.4%, down from