


EUR/USD, GBP/USD, USD/JPY Analysis: The Dollar Is Weakening Against the Euro and Pound
FXOpen
Recent economic data and comments from Federal Reserve representatives have dampened expectations of a rapid interest rate cut. More optimistic than expected consumer sentiment data added to the list of reliable economic data published this week, including retail sales and unemployment benefit claims. The positive indicators eased expectations that the Fed would begin lowering the key rate as early as March and provided confidence that the US economy is not immediately threatened by a recession. The dollar index, which tracks the dollar's value against a basket of six currencies, fell by 0.08% to 103.26, although it rose by 0.8% over the week.
EUR/USD
The EUR/USD pair is showing a modest increase, developing a corrective impulse formed last week. The euro is testing the 1.0900 level for an upward breakout amid the absence of macroeconomic publications. According to EUR/USD technical analysis, immediate resistance can be seen at 1.0909, and a breakthrough could trigger an increase to 1.0958. On the other hand, the nearest support is at 1.0844, and a break below could lead the pair to 1.0800.
Investors will focus on the monthly report from the German Bundesbank during the day, which may influence market expectations regarding the pace of possible ECB interest rate cuts this year. Additionally, on Wednesday, January business activity statistics in the services sector will be presented in the EU and the US. Predictions suggest that the Eurozone services sector index from S&P Global will strengthen from 48.8 to 49.0, while in the US, it will decrease from 51.4 to 51.0. On Thursday, a meeting of the European regulator will take place, and officials may provide comments that will affect the movement of the single currency quotes, although no changes in the direction of the agency's monetary policy are expected: the interest rate is expected to remain at 4.50%, and the deposit rate at 4.00%.
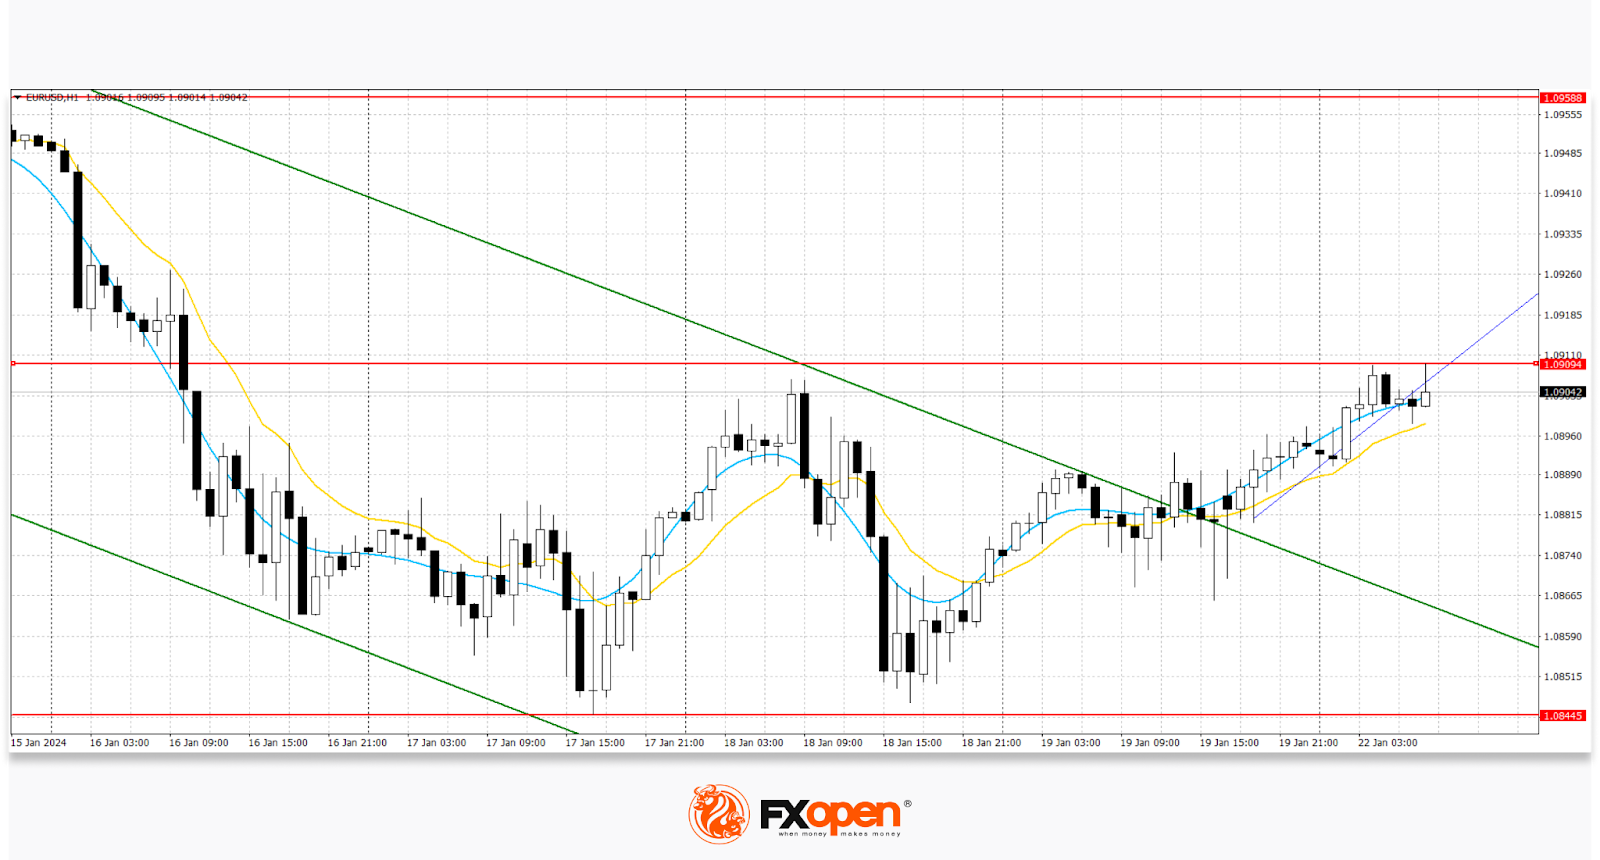
The price broke the upper boundary of the descending channel and may continue to rise.
GBP/USD
On the GBP/USD chart, the pair is slightly increasing, attempting to develop a bullish impulse formed last week. Immediate resistance can be seen at 1.2724, and a breakthrough could trigger an increase to 1.2785. On the other hand, the nearest support is at 1.2661, and a break below could lead the pair to 1.2596.
Pound positions were pressured by December retail sales dynamics in the UK, reflecting a 3.2% contraction after a 1.4% increase in the previous month. In annual terms, the indicator declined by 2.4% after a 0.2% growth in November. Investors noted that a decline in consumer demand could contribute to a weakening of inflationary pressure and, consequently, lead to a quicker launch of monetary easing by the Bank of England. On Wednesday, January business activity data will be published for the EU, the UK, and the US. British indicators are expected to show moderate improvement, while US statistics may be mixed. The British manufacturing sector index may strengthen from 46.2 to 46.7 points, and the American index from 47.9 to 48.0 points. In turn, it is expected that the UK services sector index will rise from 53.4 to 53.5 points, and in the US, it will adjust from 51.4 to 51.0 points.
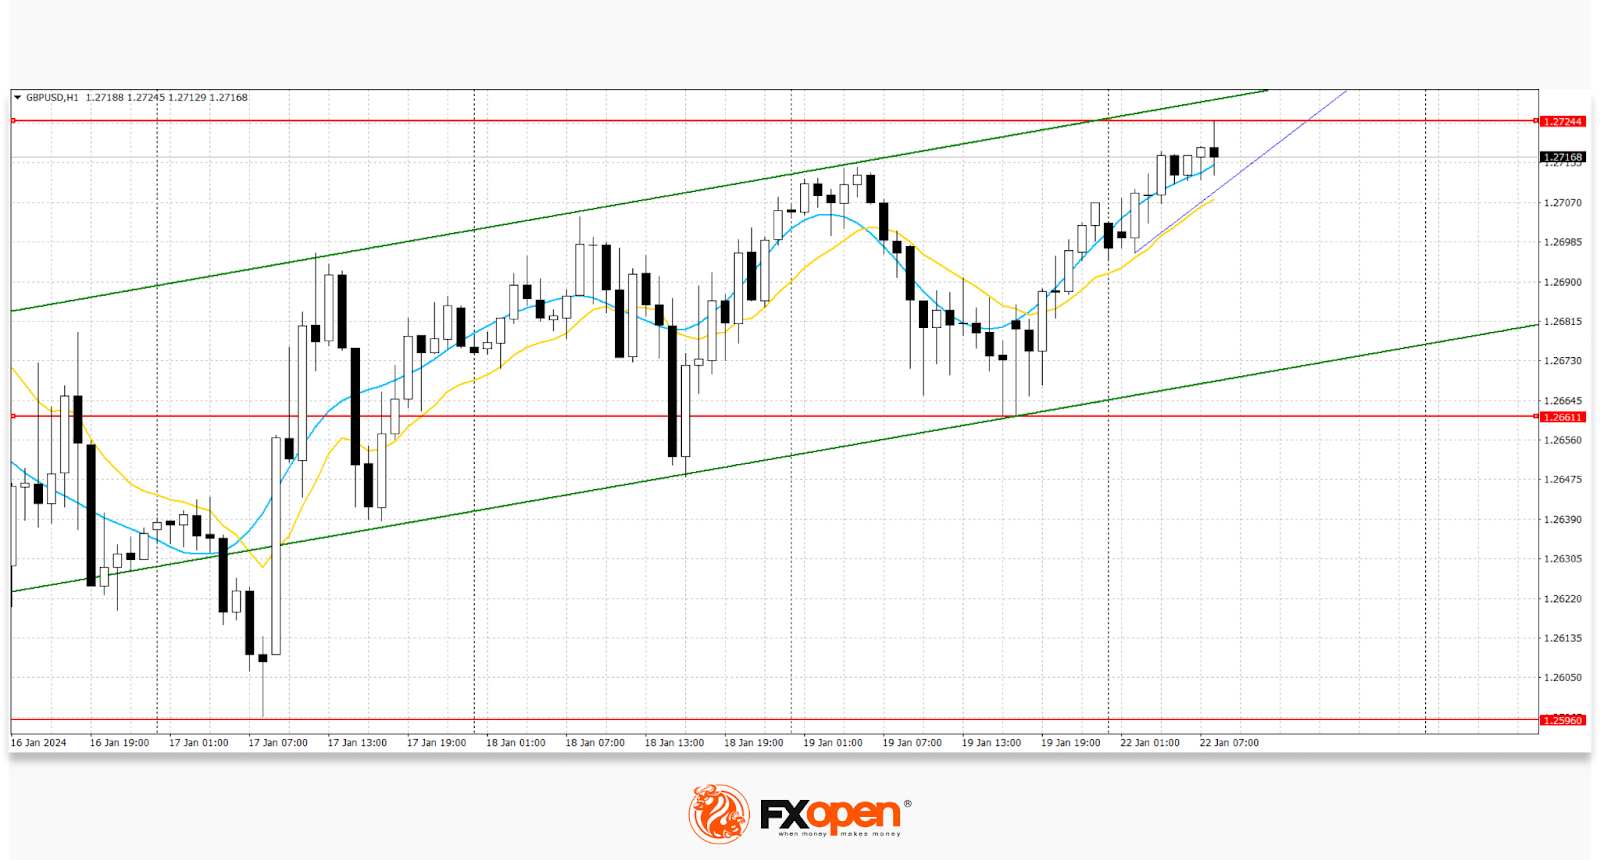
A new ascending channel has formed over the highs of the last two days. The price is now approaching the upper boundary of the channel and may continue to rise.
USD/JPY
On the USD/JPY chart, the pair is correcting downward amid the absence of key macroeconomic statistics. Strong resistance can be seen at 148.80, and a breakthrough could trigger an increase to 149.60. On the other hand, the nearest support is at 147.64. A break below could lead the pair to 145.58.
On Tuesday, investors will pay attention to the results of the Bank of Japan's monetary policy meeting: analysts expect the interest rate to be maintained at -0.10%, as inflationary pressure in the country is unstable. Morgan Stanley experts stated that they do not expect the Japanese regulator to abandon its "ultra-dovish" rhetoric and anticipate that active measures will only begin after spring wage negotiations. December data from Japan, published on Friday, reflected a moderate slowdown in inflation growth. The national consumer price index decreased from 2.8% to 2.6%. The indicator fell from 2.5% to 2.3%, and the indicator excluding food and energy dropped from 3.8% to 3.7%. In the US, the University of Michigan's consumer sentiment index increased from 69.7 to 78.8 in January, significantly exceeding preliminary estimates of 70.0.
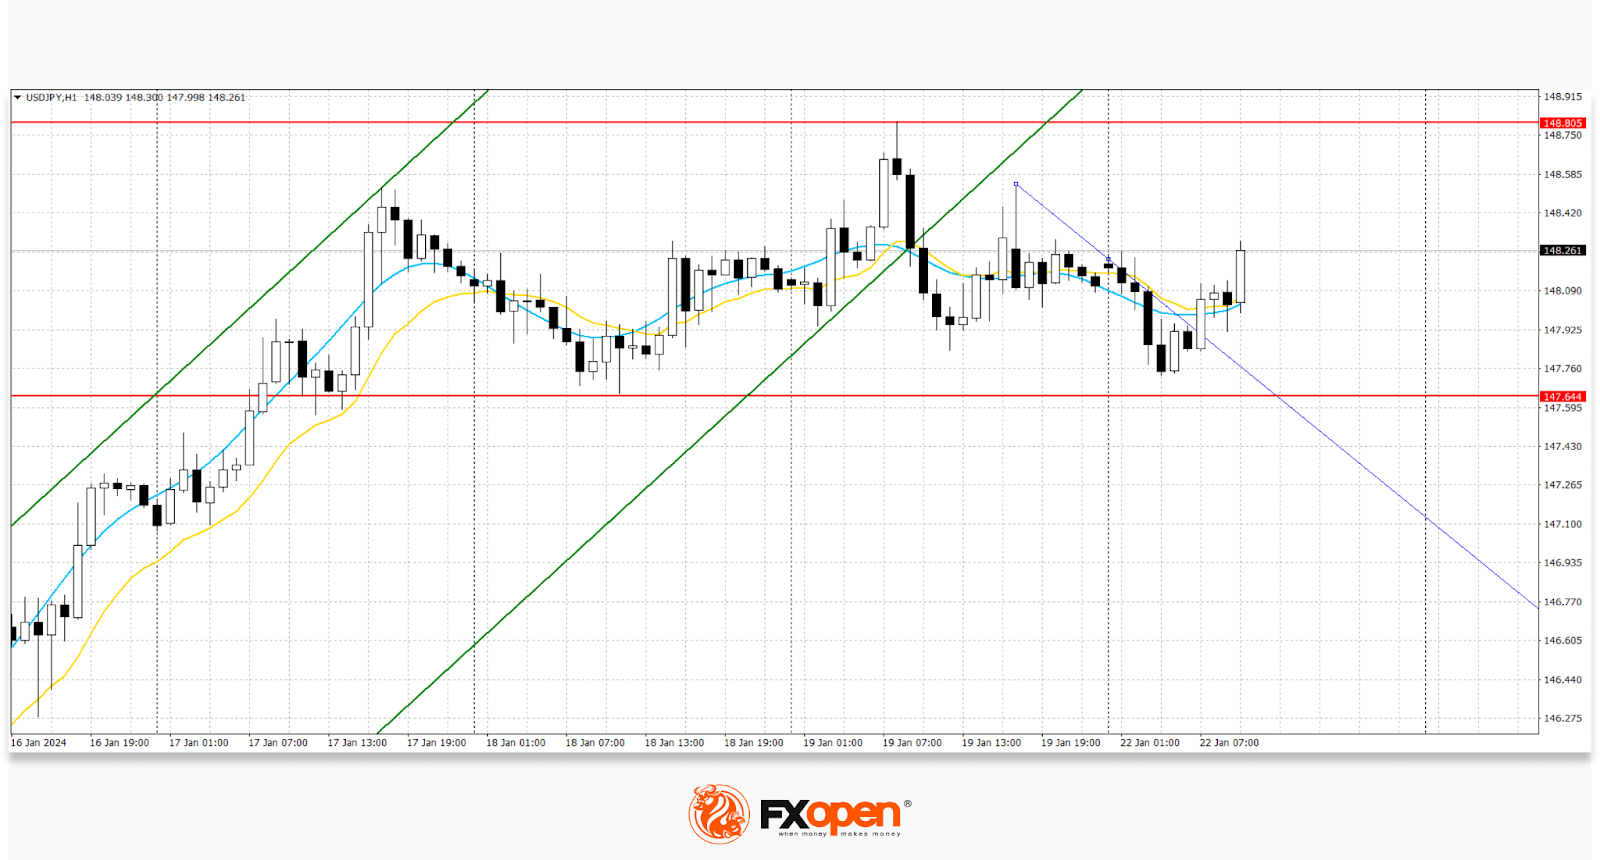
The price broke the lower boundary of the ascending channel and may continue to decline.
Trade over 50 forex markets 24 hours a day with FXOpen. Take advantage of low commissions, deep liquidity, and spreads from 0.0 pips (additional fees may apply). Open your FXOpen account now or learn more about trading forex with FXOpen.
This article represents the opinion of the Companies operating under the FXOpen brand only. It is not to be construed as an offer, solicitation, or recommendation with respect to products and services provided by the Companies operating under the FXOpen brand, nor is it to be considered financial advice.
Stay ahead of the market!
Subscribe now to our mailing list and receive the latest market news and insights delivered directly to your inbox.


Latest articles

AI Valuations Are Back in the Spotlight
Artificial intelligence remains the dominant investment theme of 2026, but investors are increasingly questioning whether AI stock valuations are keeping pace with reality.
💰 Big Tech continues to invest at an unprecedented scale, with hyperscaler AI spending projected to exceed $800

AUD/CAD: Months of Indecision — Is a Breakout Finally Coming?
The Australian dollar has clawed back most of its end-of-June losses, when it touched three-month lows against the greenback amid escalating Middle East tensions. Since then, sentiment has improved: the RBA's Assistant Governor Sarah Hunter signalled the board stands ready

USD/JPY: Battling at the Top of the Triangle
On 3 July, Japan's Finance Minister, Satsuki Katayama, stated that the Ministry of Finance remains in close contact with US authorities regarding developments in USD/JPY as the yen traded near its weakest level in almost 40 years. Similar verbal