


FXOpen

At the start of the current trading week, the U.S. dollar continued to strengthen across almost all fronts. European and commodity currencies are testing critical levels, and some pairs have managed to update recent extremes:
- EUR/USD fell below 1.0900,
- GBP/USD is testing the 1.3000 level,
- USD/CAD briefly traded above 1.3800.
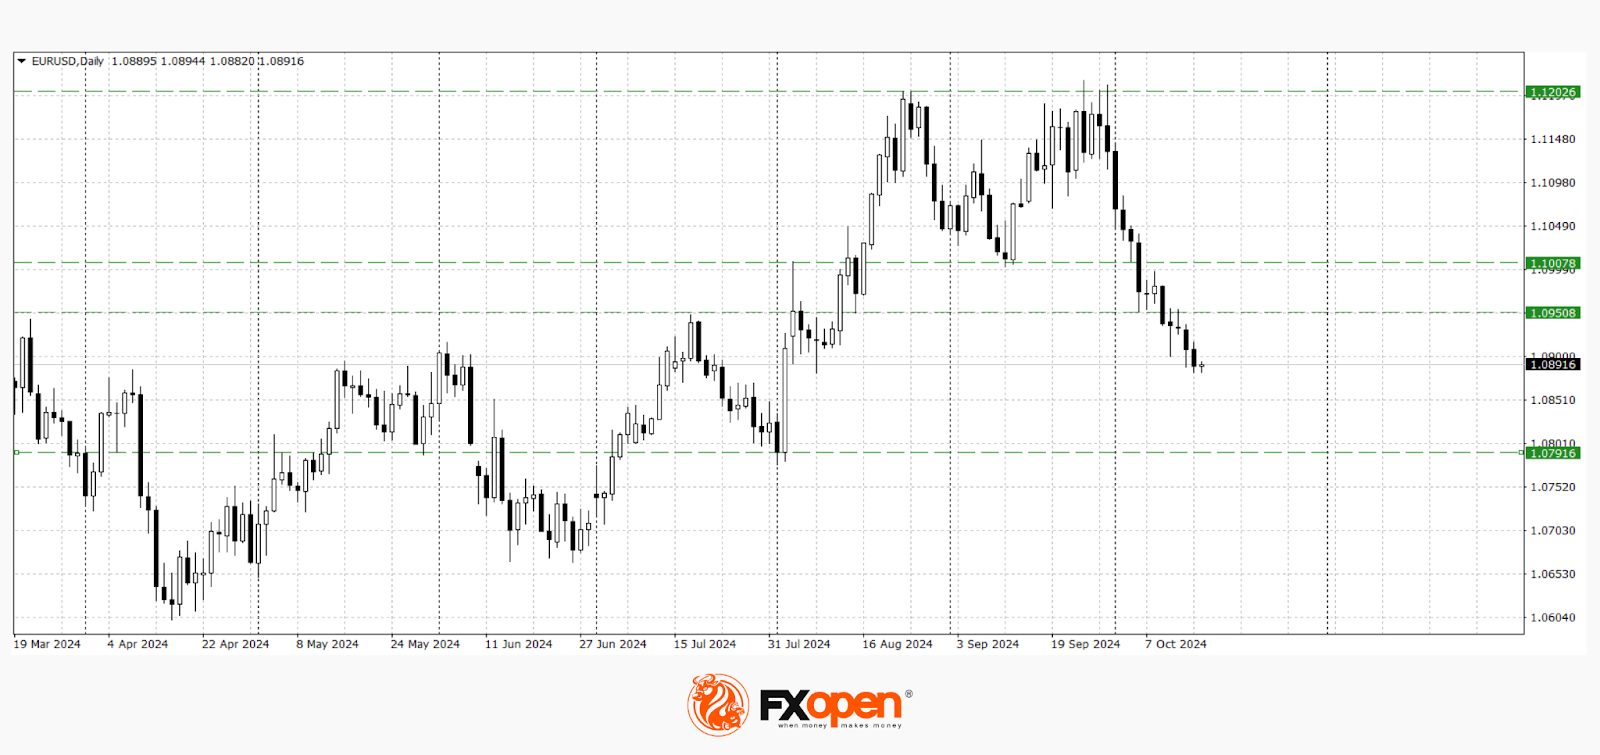
EUR/USD
The technical analysis of EUR/USD indicates the potential for further price declines, as a “double top” pattern has formed on the daily timeframe. Full completion of this pattern may lead to a test of the 1.0800-1.0790 range. The nearest area for corrective growth is between 1.0950 and 1.0900.
Key upcoming events that will impact the pair's pricing include:
- Today at 11:00 (GMT +3:00) - Germany's Consumer Price Index (CPI) report,
- Today at 21:40 (GMT +3:00) - ECB President Christine Lagarde's speech,
- Tomorrow at 12:00 (GMT +3:00) - Eurozone CPI report,
- Tomorrow at 15:15 (GMT +3:00) - ECB rate decision.
The ECB’s decision could be crucial for the direction of EUR/USD in the coming weeks. Experts forecast a rate cut of 0.25%, bringing it to 3.25%. If further monetary easing is announced by the ECB, volatility in the euro could spike.
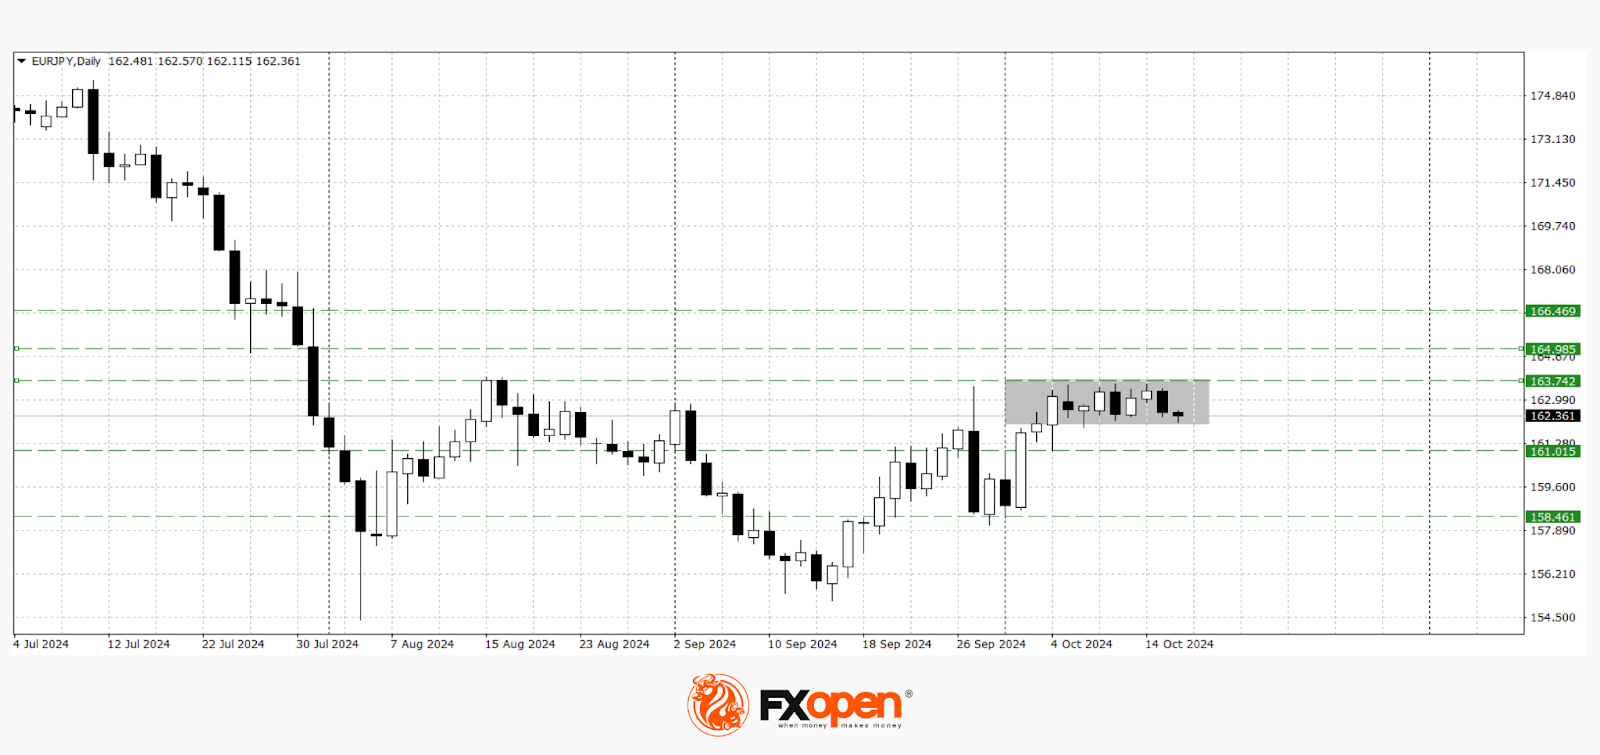
EUR/JPY
The sharp rise in the yen, observed at the end of summer, was interrupted by statements from Bank of Japan Governor Kazuo Ueda, indicating that officials won’t rush to raise interest rates on the yen. EUR/JPY’s corrective growth allowed the pair to retest the key range of 163.70-163.00, although it has yet to break firmly above these levels.
On the daily timeframe, range trading is observed between 163.70 and 162.00. If the price drops below 162.00, a test of the September lows at 160.00-158.00 is possible. However, if the price secures itself above 163.70, an impulsive rally toward 166.60-165.00 may resume.
Trade over 50 forex markets 24 hours a day with FXOpen. Take advantage of low commissions, deep liquidity, and spreads from 0.0 pips (additional fees may apply). Open your FXOpen account now or learn more about trading forex with FXOpen.
This article represents the opinion of the Companies operating under the FXOpen brand only. It is not to be construed as an offer, solicitation, or recommendation with respect to products and services provided by the Companies operating under the FXOpen brand, nor is it to be considered financial advice.
Stay ahead of the market!
Subscribe now to our mailing list and receive the latest market news and insights delivered directly to your inbox.


Latest articles

Market Analysis: GBP/USD Dips Further As EUR/GBP Regains Traction
GBP/USD failed to climb above 1.3500 and corrected some gains. EUR/GBP started a decent increase and might aim for more gains above 0.8700.
Important Takeaways for GBP/USD and EUR/GBP Analysis Today
· The British Pound


Market Insights with Gary Thomson: Oil, US Retail Sales & NFP in Focus
In this video, we’ll explore the key economic events and market trends, shaping the financial landscape. Get ready for insights into financial markets to help you navigate the week ahead. Let’s dive in!
In this episode of Market