


GBP/USD, EUR/USD, and USD/JPY Analysis: Yen and European Currencies Retreat from Recent Highs
FXOpen

The sharp decline in the US currency that we observed after the Fed meeting slowed down slightly towards the end of last week. Thus, the pound/US dollar currency pair rebounded from 1.2700, the euro/US dollar pair is consolidating after testing 1.1000, and buyers of the US dollar/yen pair found support just below 141.00.
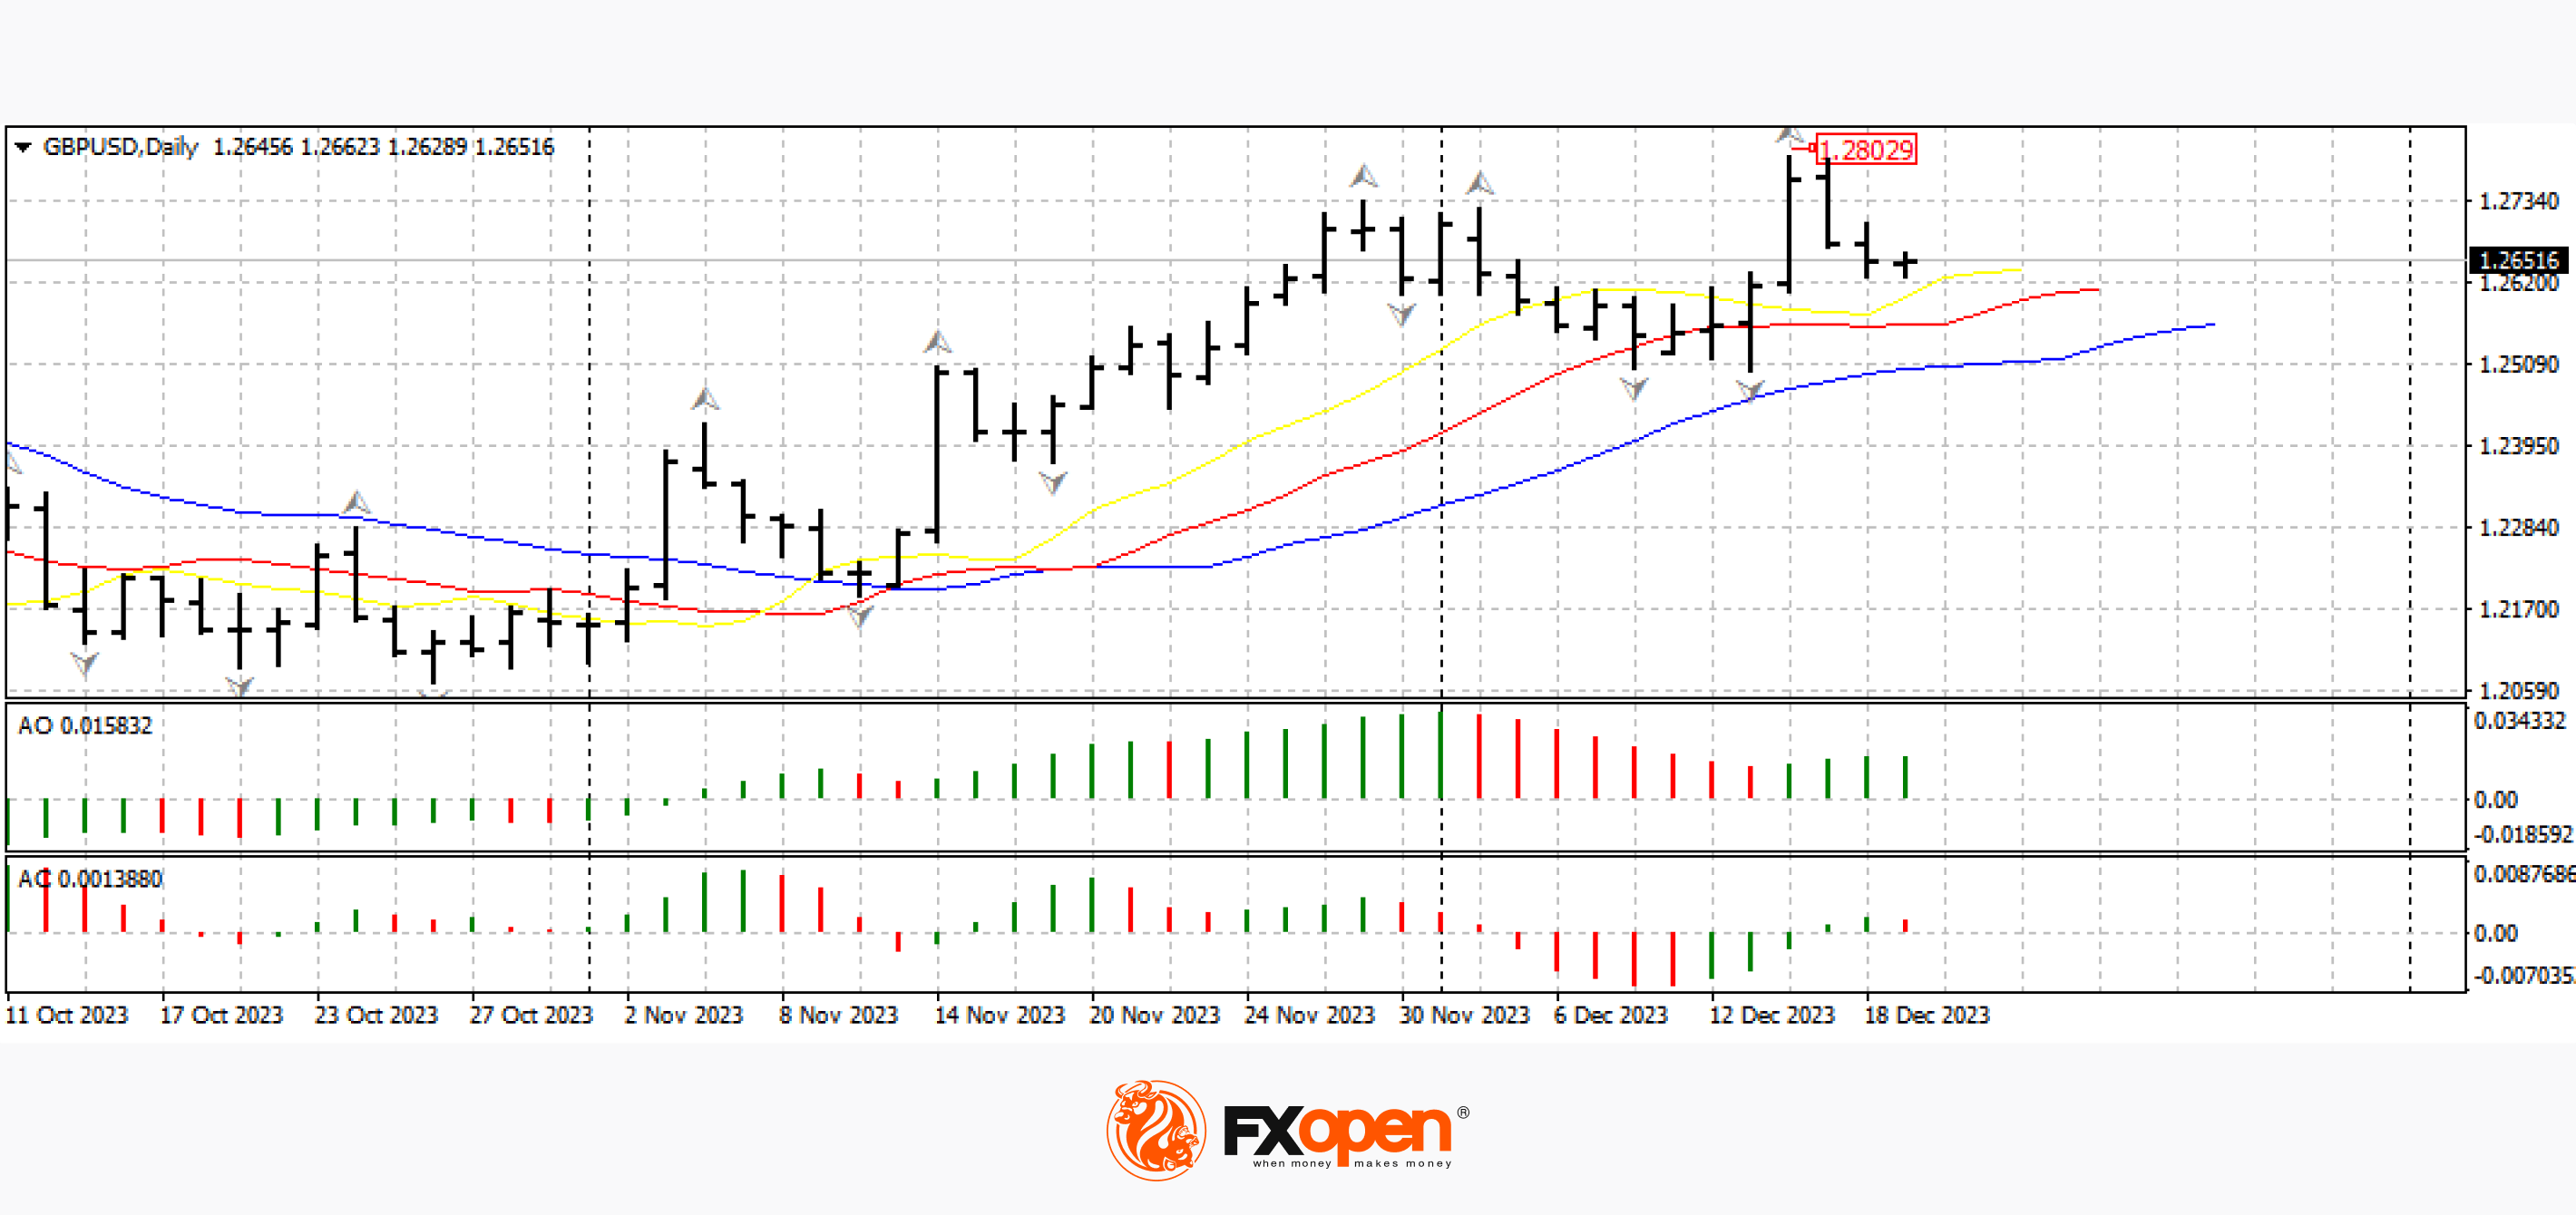
GBP/USD
The pound/dollar currency pair failed to strengthen above 1.2750 and rebounded to 1.2600. At the moment, the pair is consolidating in a narrow range, which most likely requires a good fundamental impulse to exit. Today at 14:00 GMT+3, data on the index of industrial orders in the UK for December will be published. Also, at 16:00 GMT+3, it is worth paying attention to the speech of Sarah Breeden, a member of the Financial Policy Committee of the Bank of England. Tomorrow, the UK's core consumer price index for November is scheduled to be published.
On the GBP/USD charts with higher time frames, the price confidently stays above the alligator lines. If the price breaks above the upper fractal at 1.2790, the price rise may happen. We may consider a breakdown of the upward scenario after the price confidently consolidates below 1.2500.
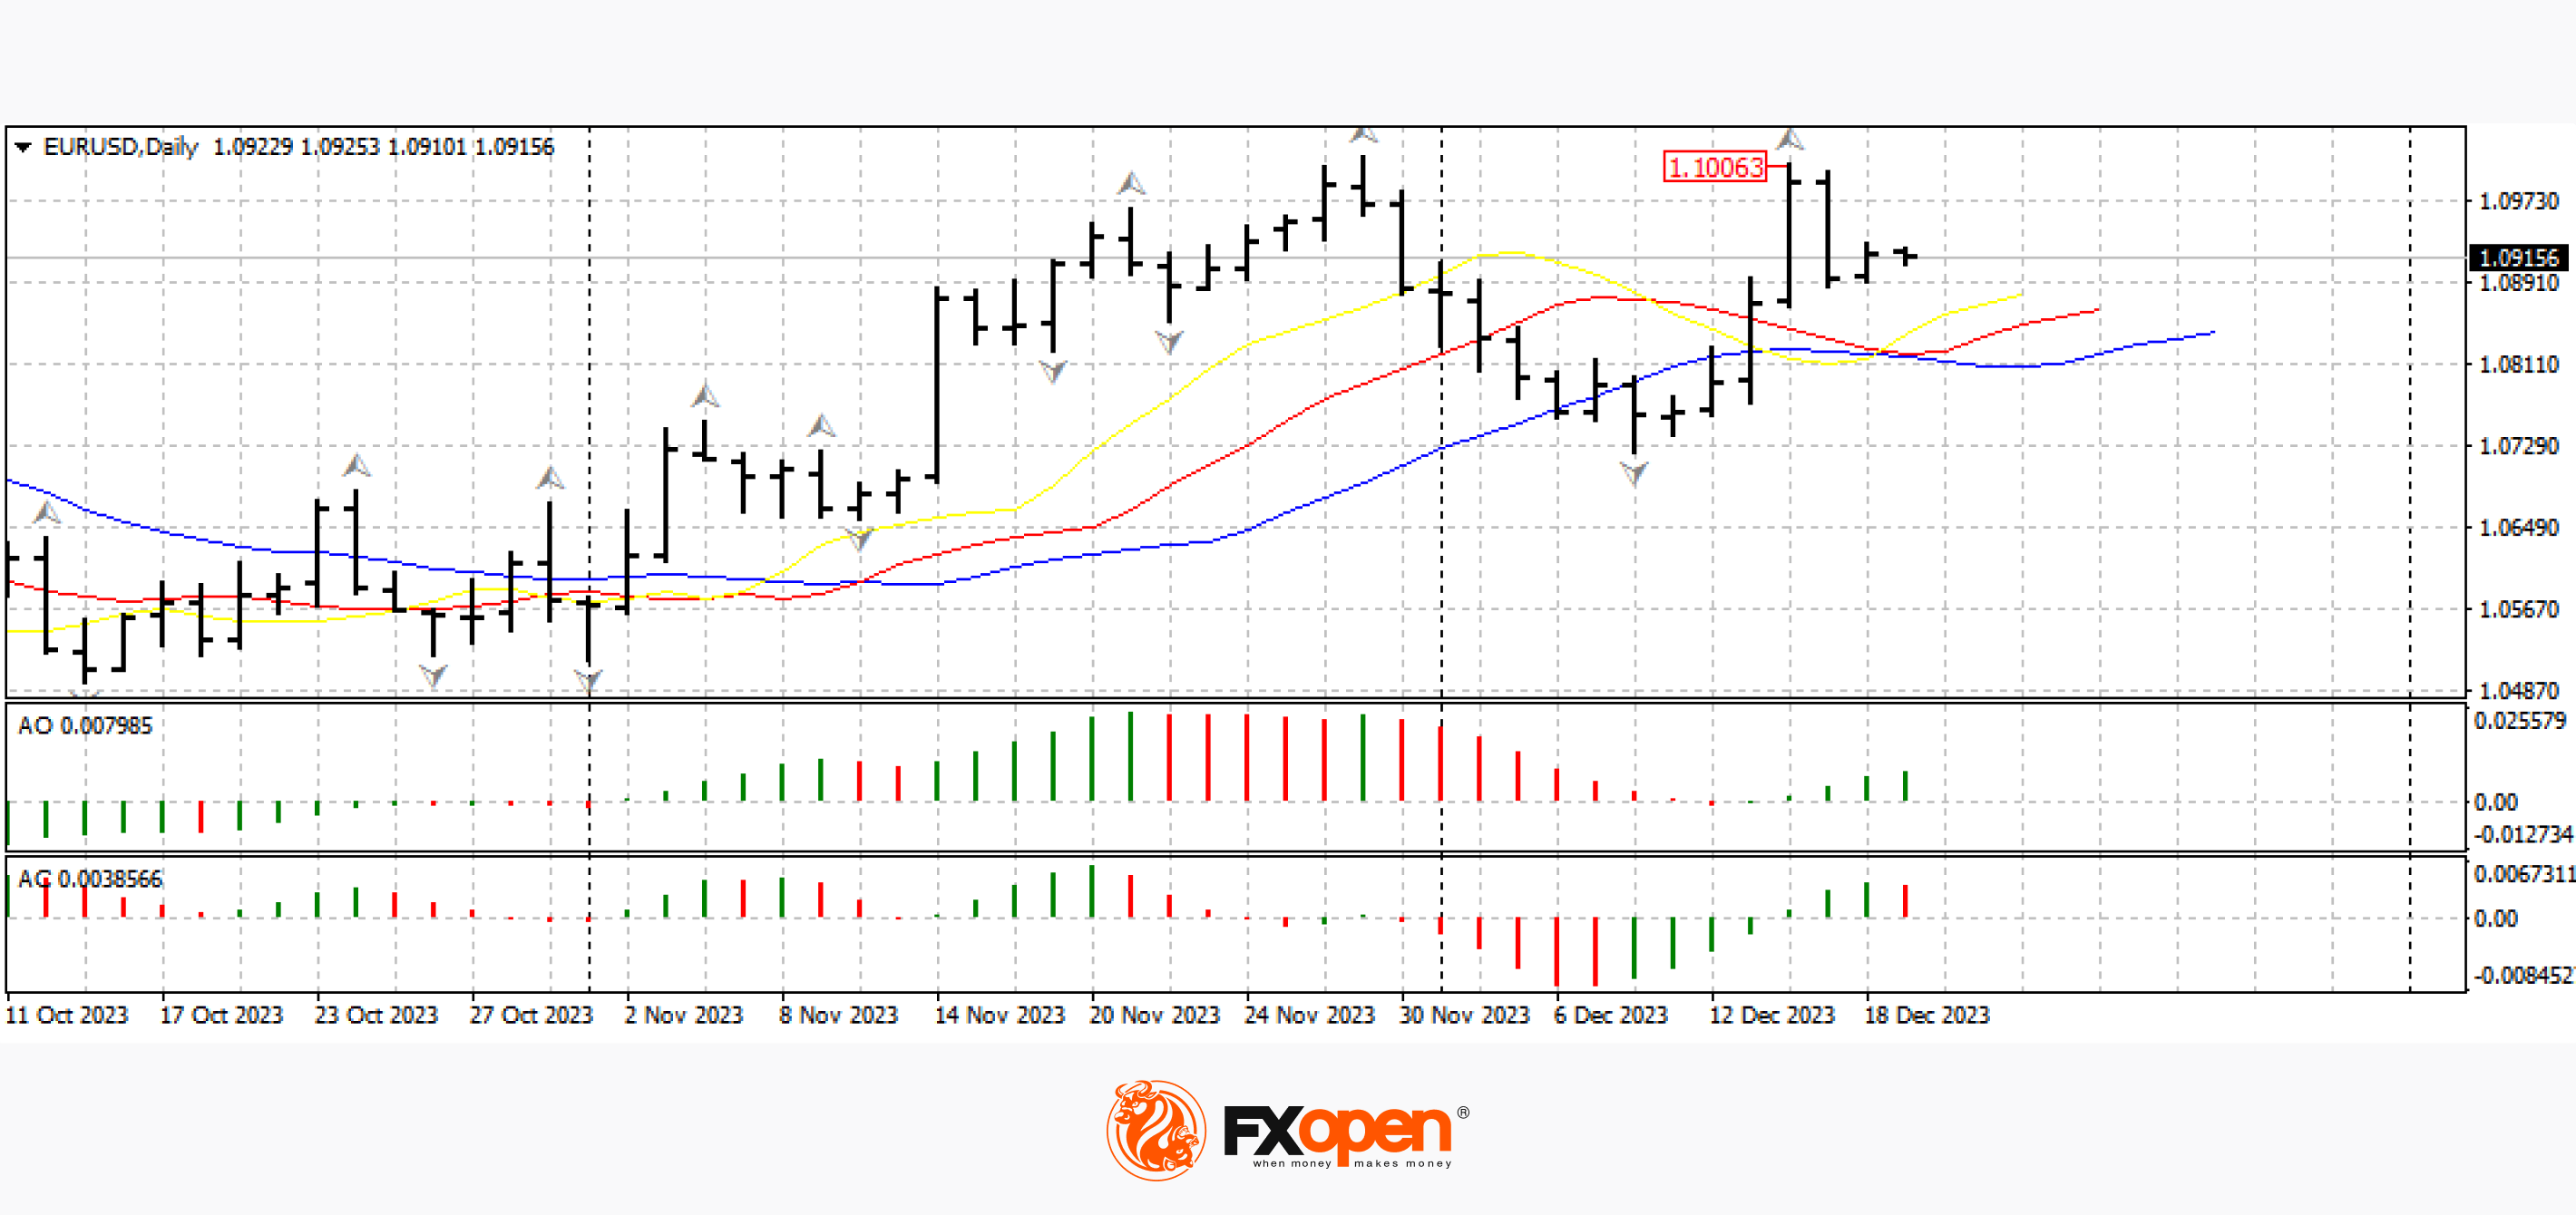
EUR/USD
According to the EUR/USD technical analysis, a repeated approach to the psychological level of 1.1000 turned out to be unsuccessful for buyers of the single European currency. After a sharp rebound, the pair lost more than 100 points and is currently trading slightly above 1.0900. Today is an important day for the pair from the fundamental analysis point of view. At 12:00 GMT+3, ECB representative Andrea Enria is expected to speak; a little later, the publication of the consumer price index in the eurozone for November is scheduled. Experts predict a decrease in the indicator, which may contribute to the resumption of the upward movement in the pair.
On the daily timeframe, the price is above the alligator lines; if the range 1.0900-1.0800 holds the status of medium-term support, the price may retest the recent high at 1.1000.
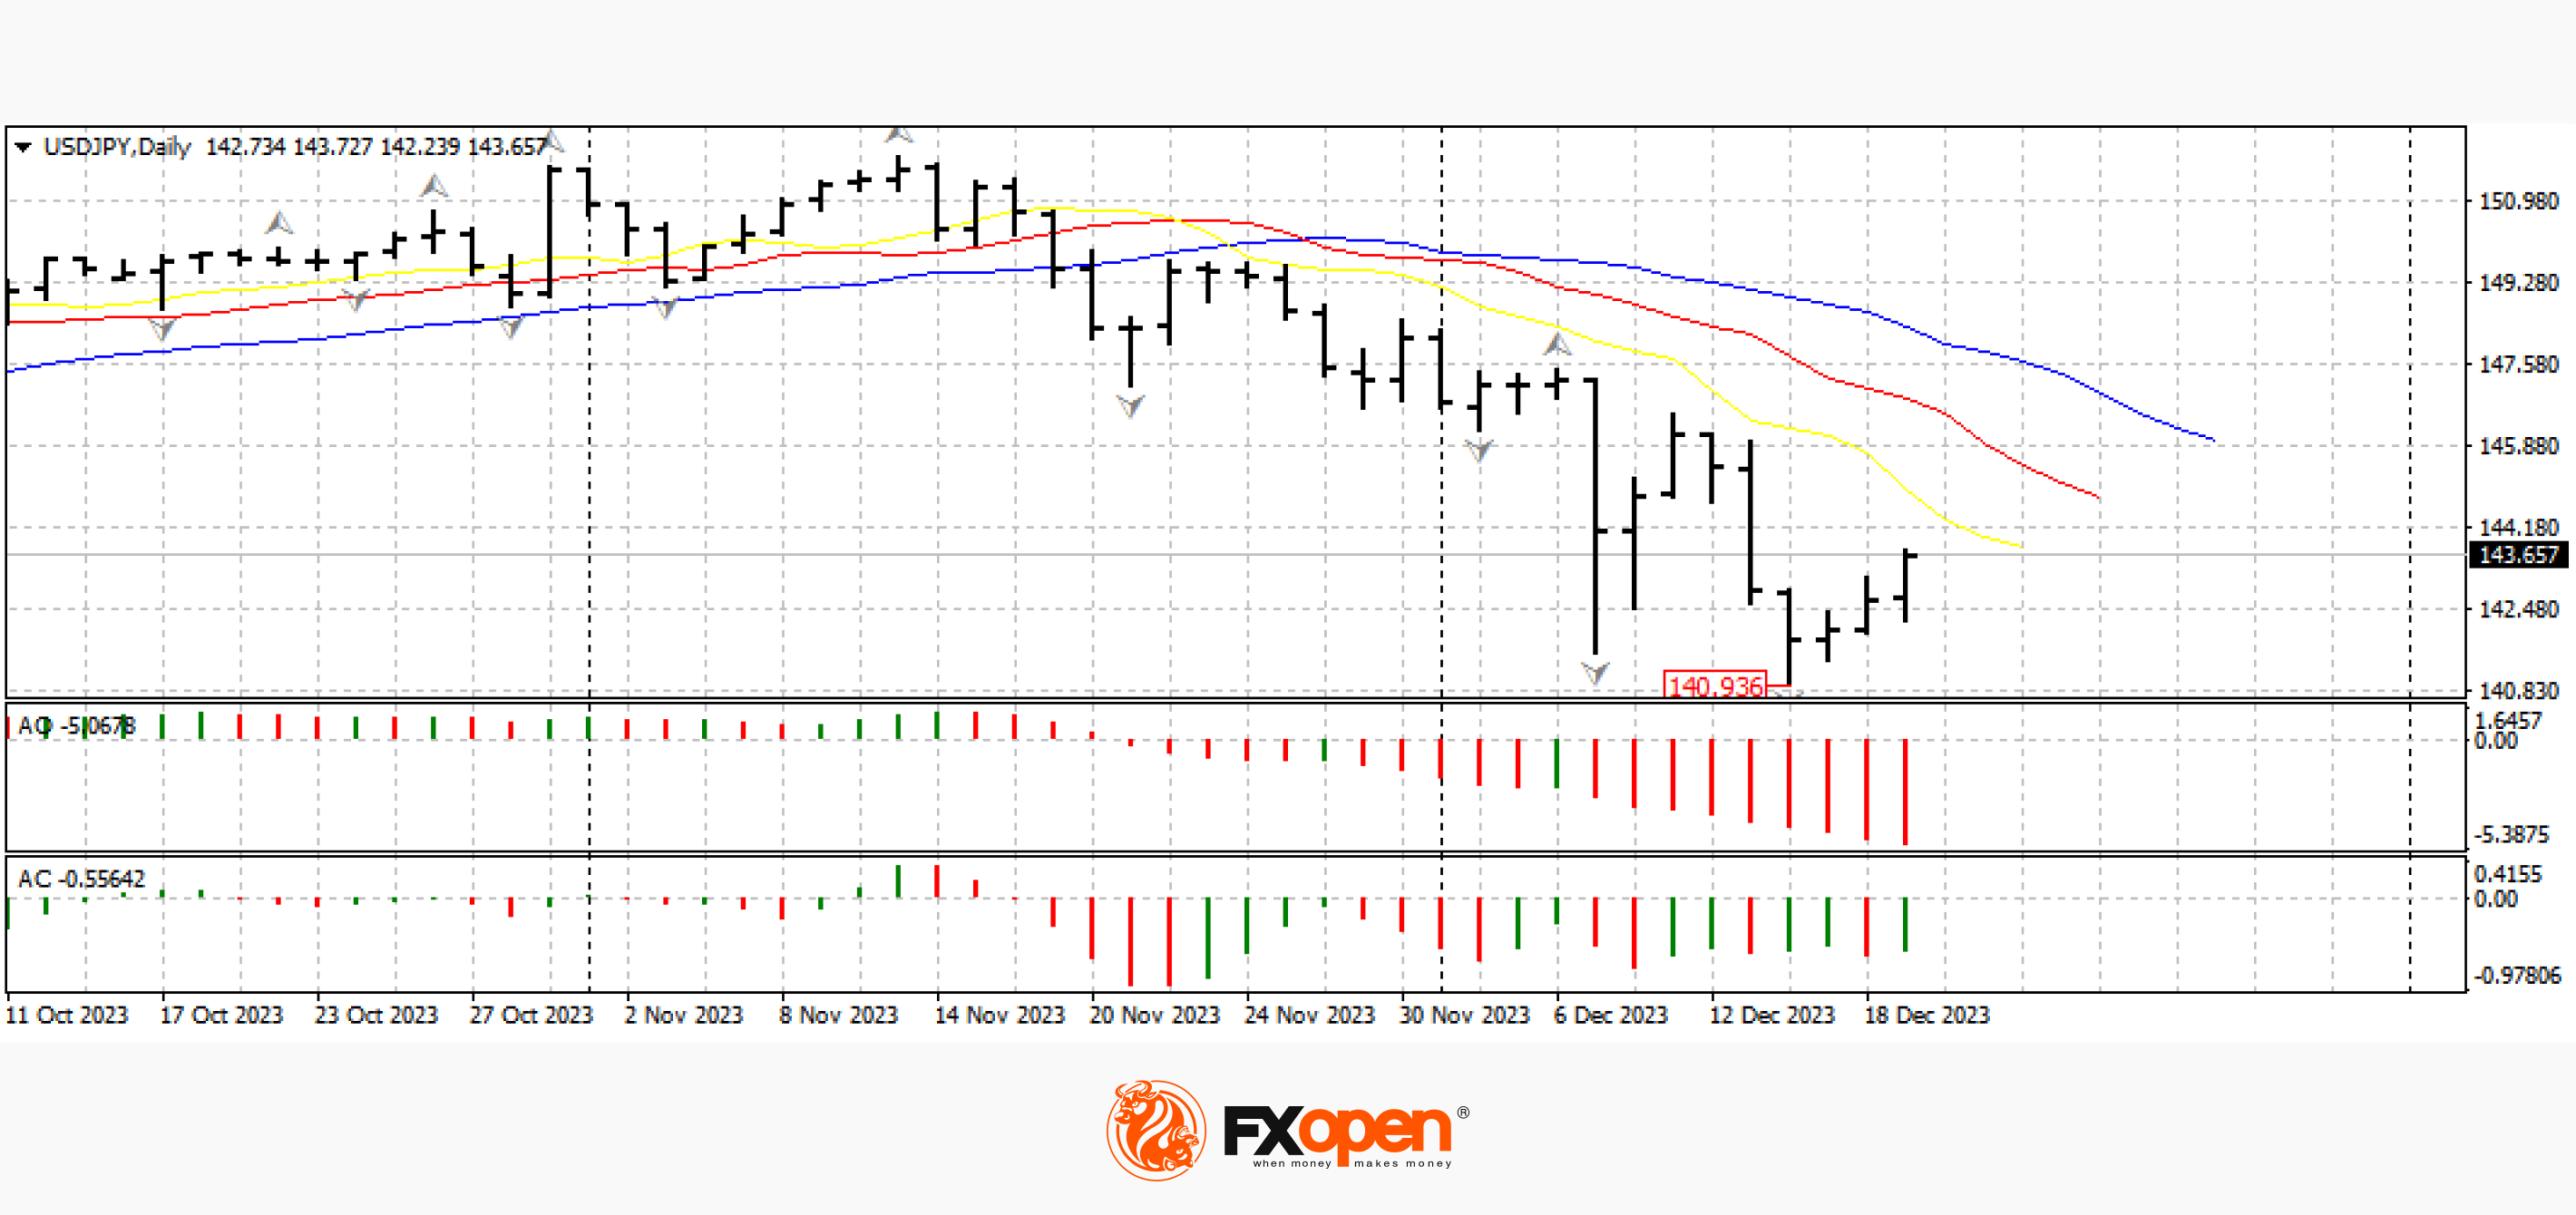
USD/JPY
The collapse of the dollar/yen pair slowed down at 141.00. Over several trading sessions, greenback buyers managed to strengthen by more than 200 points. Yesterday, the pair was trading above 143. Further pricing of the pair will largely depend on the comments of the Japanese Central Bank regarding further monetary policy. Also, today at 16:30 GMT+3, it is worth paying attention to the publication of data on the number of building permits issued in the United States for November.
On the USD/JPY daily chart, we are seeing a corrective pullback after a sharp increase. If the pair cannot go above 144.00-145.00, the downward movement may resume.
Trade over 50 forex markets 24 hours a day with FXOpen. Take advantage of low commissions, deep liquidity, and spreads from 0.0 pips (additional fees may apply). Open your FXOpen account now or learn more about trading forex with FXOpen.
This article represents the opinion of the Companies operating under the FXOpen brand only. It is not to be construed as an offer, solicitation, or recommendation with respect to products and services provided by the Companies operating under the FXOpen brand, nor is it to be considered financial advice.
Stay ahead of the market!
Subscribe now to our mailing list and receive the latest market news and insights delivered directly to your inbox.


Latest articles

Weekly Market Insights with Gary Thomson: The Week of Central Banks and Earnings
In this video, we’ll explore the key economic events and market trends, shaping the financial landscape. Get ready for insights into financial markets to help you navigate the week ahead. Let’s dive in!
In this episode of Market

Intel at a Crossroads: Earnings Beat Meets Technical Resistance
Intel has just delivered its strongest quarter in over fifteen years, and the market reaction says it all. Q2 2026 revenue surged 25% year-over-year to $16.1 billion, crushing the consensus estimate of $14.42 billion, while adjusted EPS of

Tesla: Complex Range Structure Breaks Down Following Quarterly Earnings
Tesla released its Q2 2026 results after the market closed on 22 July. Revenue increased 26% year-on-year to $28.24 billion, while vehicle deliveries reached a record 480,126 units. However, operating margin fell sharply to 1.4%, down from