


GBP/USD, EUR/USD, USD/CAD Analysis: The Dollar Falls Sharply after the Fed Meeting
FXOpen
The American currency, having strengthened after the release of inflation data in the United States, fell sharply against almost all leading currencies yesterday. The reason for the sharp weakening of the dollar was most likely the updated median forecast of FOMC members for the dynamics of interest rates over the next few years, which does not assume a further increase in the base interest rate. As expected, the American regulator left the rate at the same level; in addition, several Fed members expect at least three rate cuts in 2024. On such news, the euro/dollar pair tested 1.0900, the pound/dollar pair consolidated above 1.2600, and the dollar/Canadian pair broke through support at 1.3500.
GBP/USD
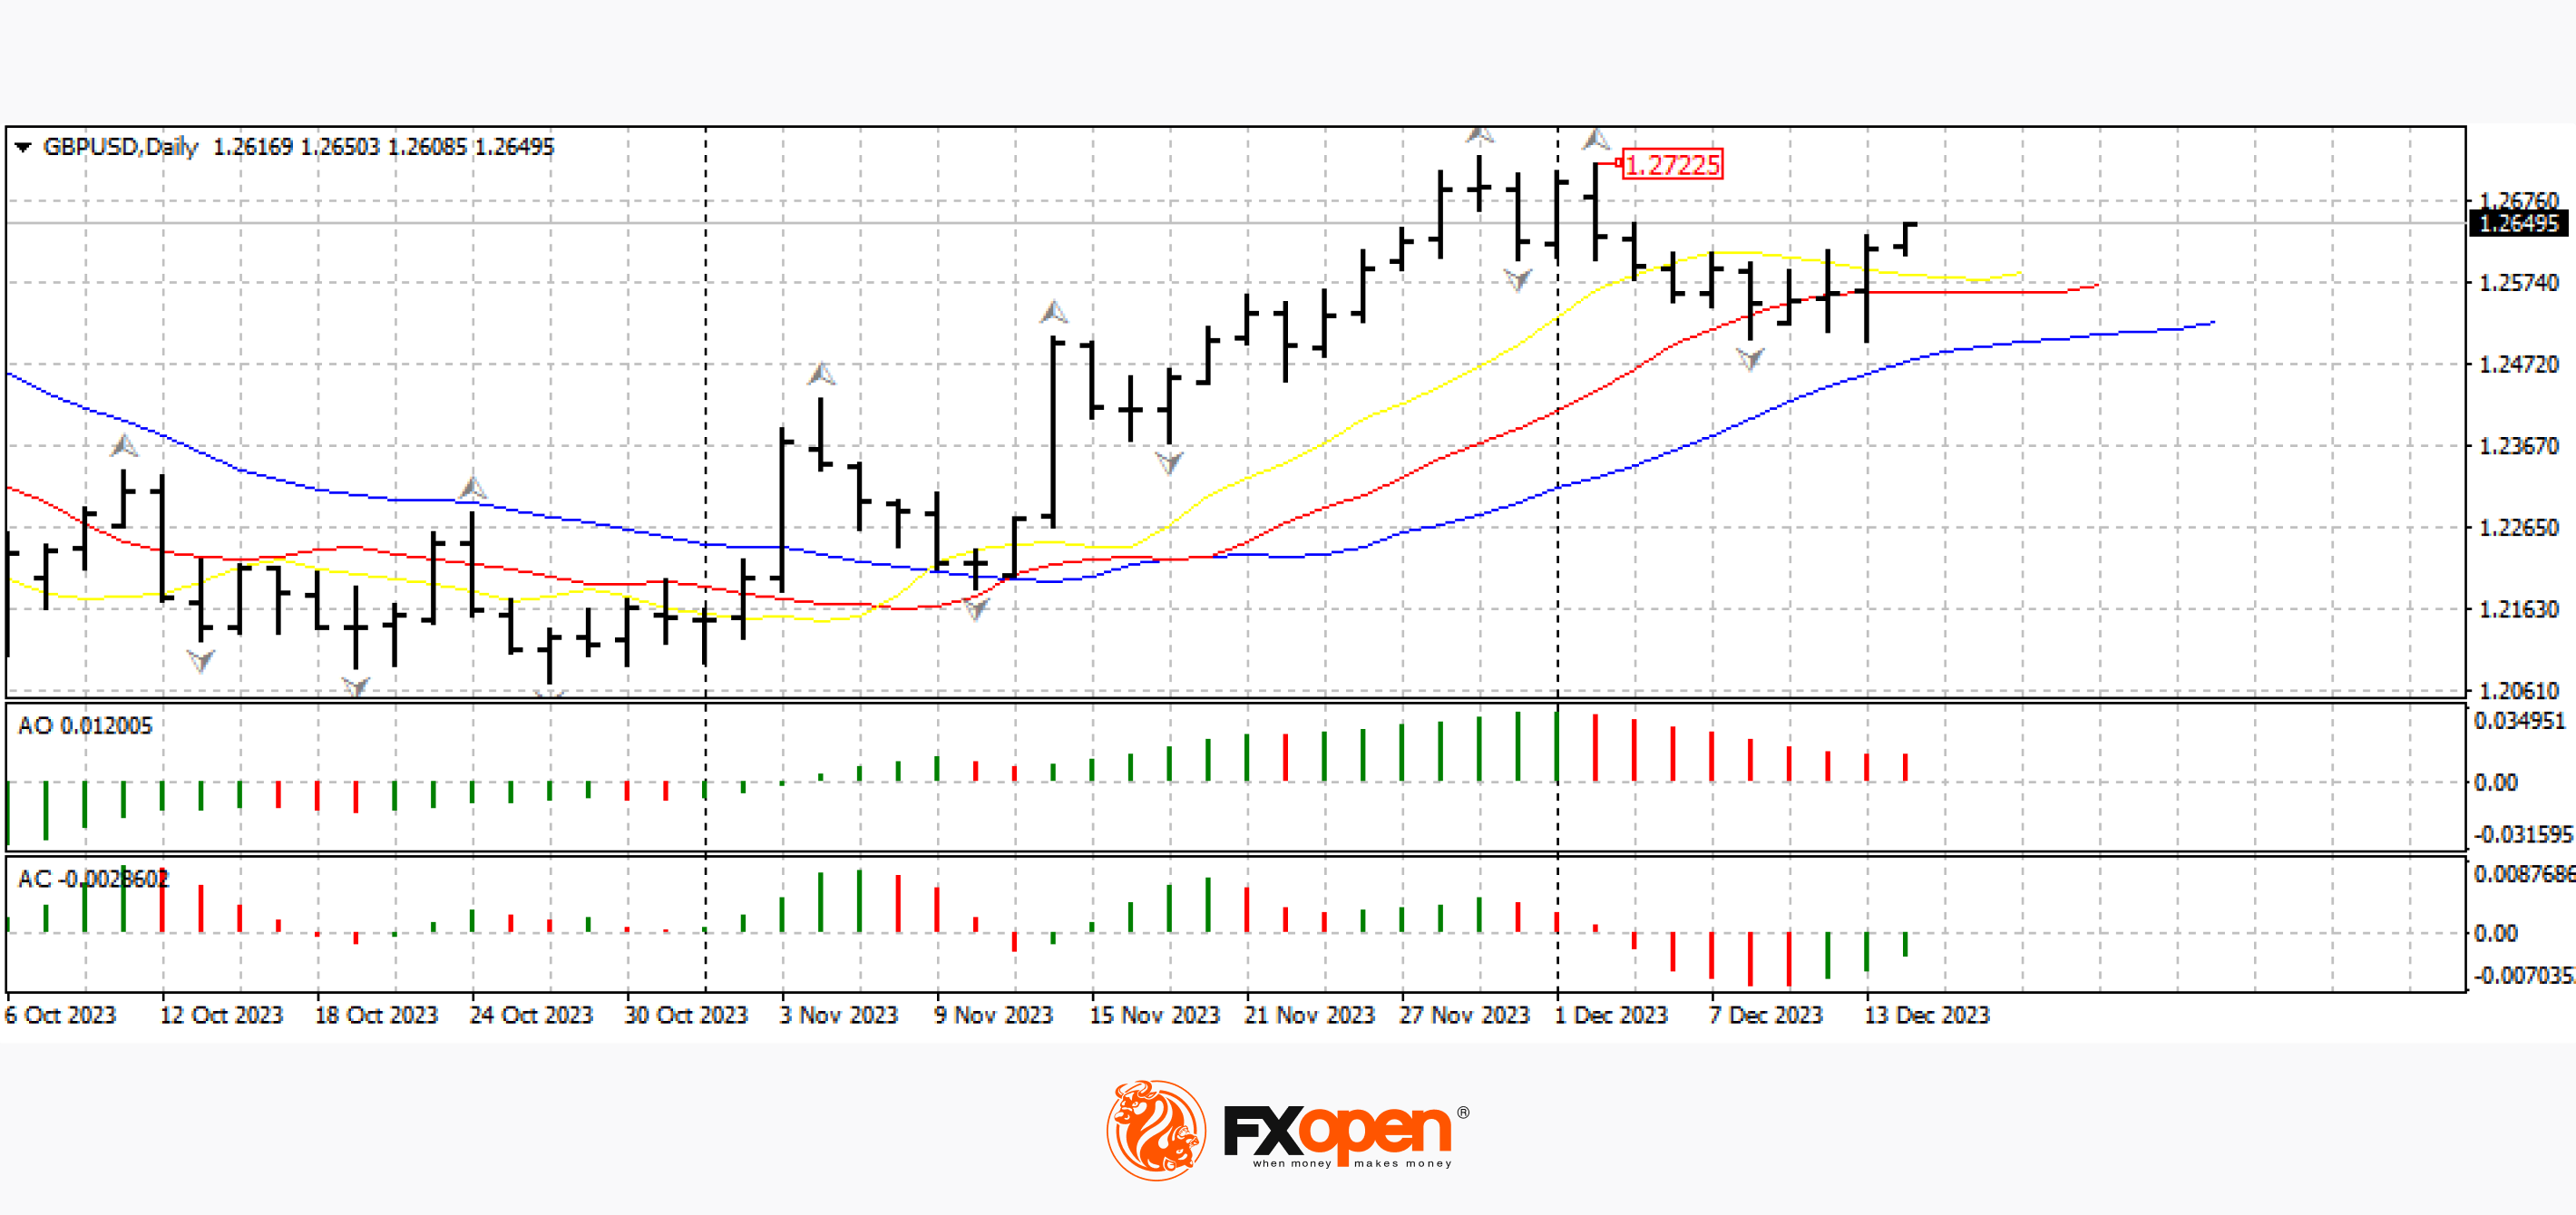
The British currency, having tested 1.2500 after the announcement of the results of the Fed meeting, strengthened by more than 100 points in just a few hours. However, today, the situation may change dramatically. At 15:00 GMT+3, there will be a meeting of the Bank of England, at which, according to analysts, the rate will also remain at the same level. Moreover, if it turns out that less than three members of the Bank of England vote for a rate hike, the pair could return to recent lows at 1.2500.
On the daily GBP/USD chart, the price has consolidated above the alligator lines; the pair may rise above the upper fractal at 1.2720 and continue rising. Cancellation of the upward scenario can be considered if it consolidates below 1.2500.
EUR/USD
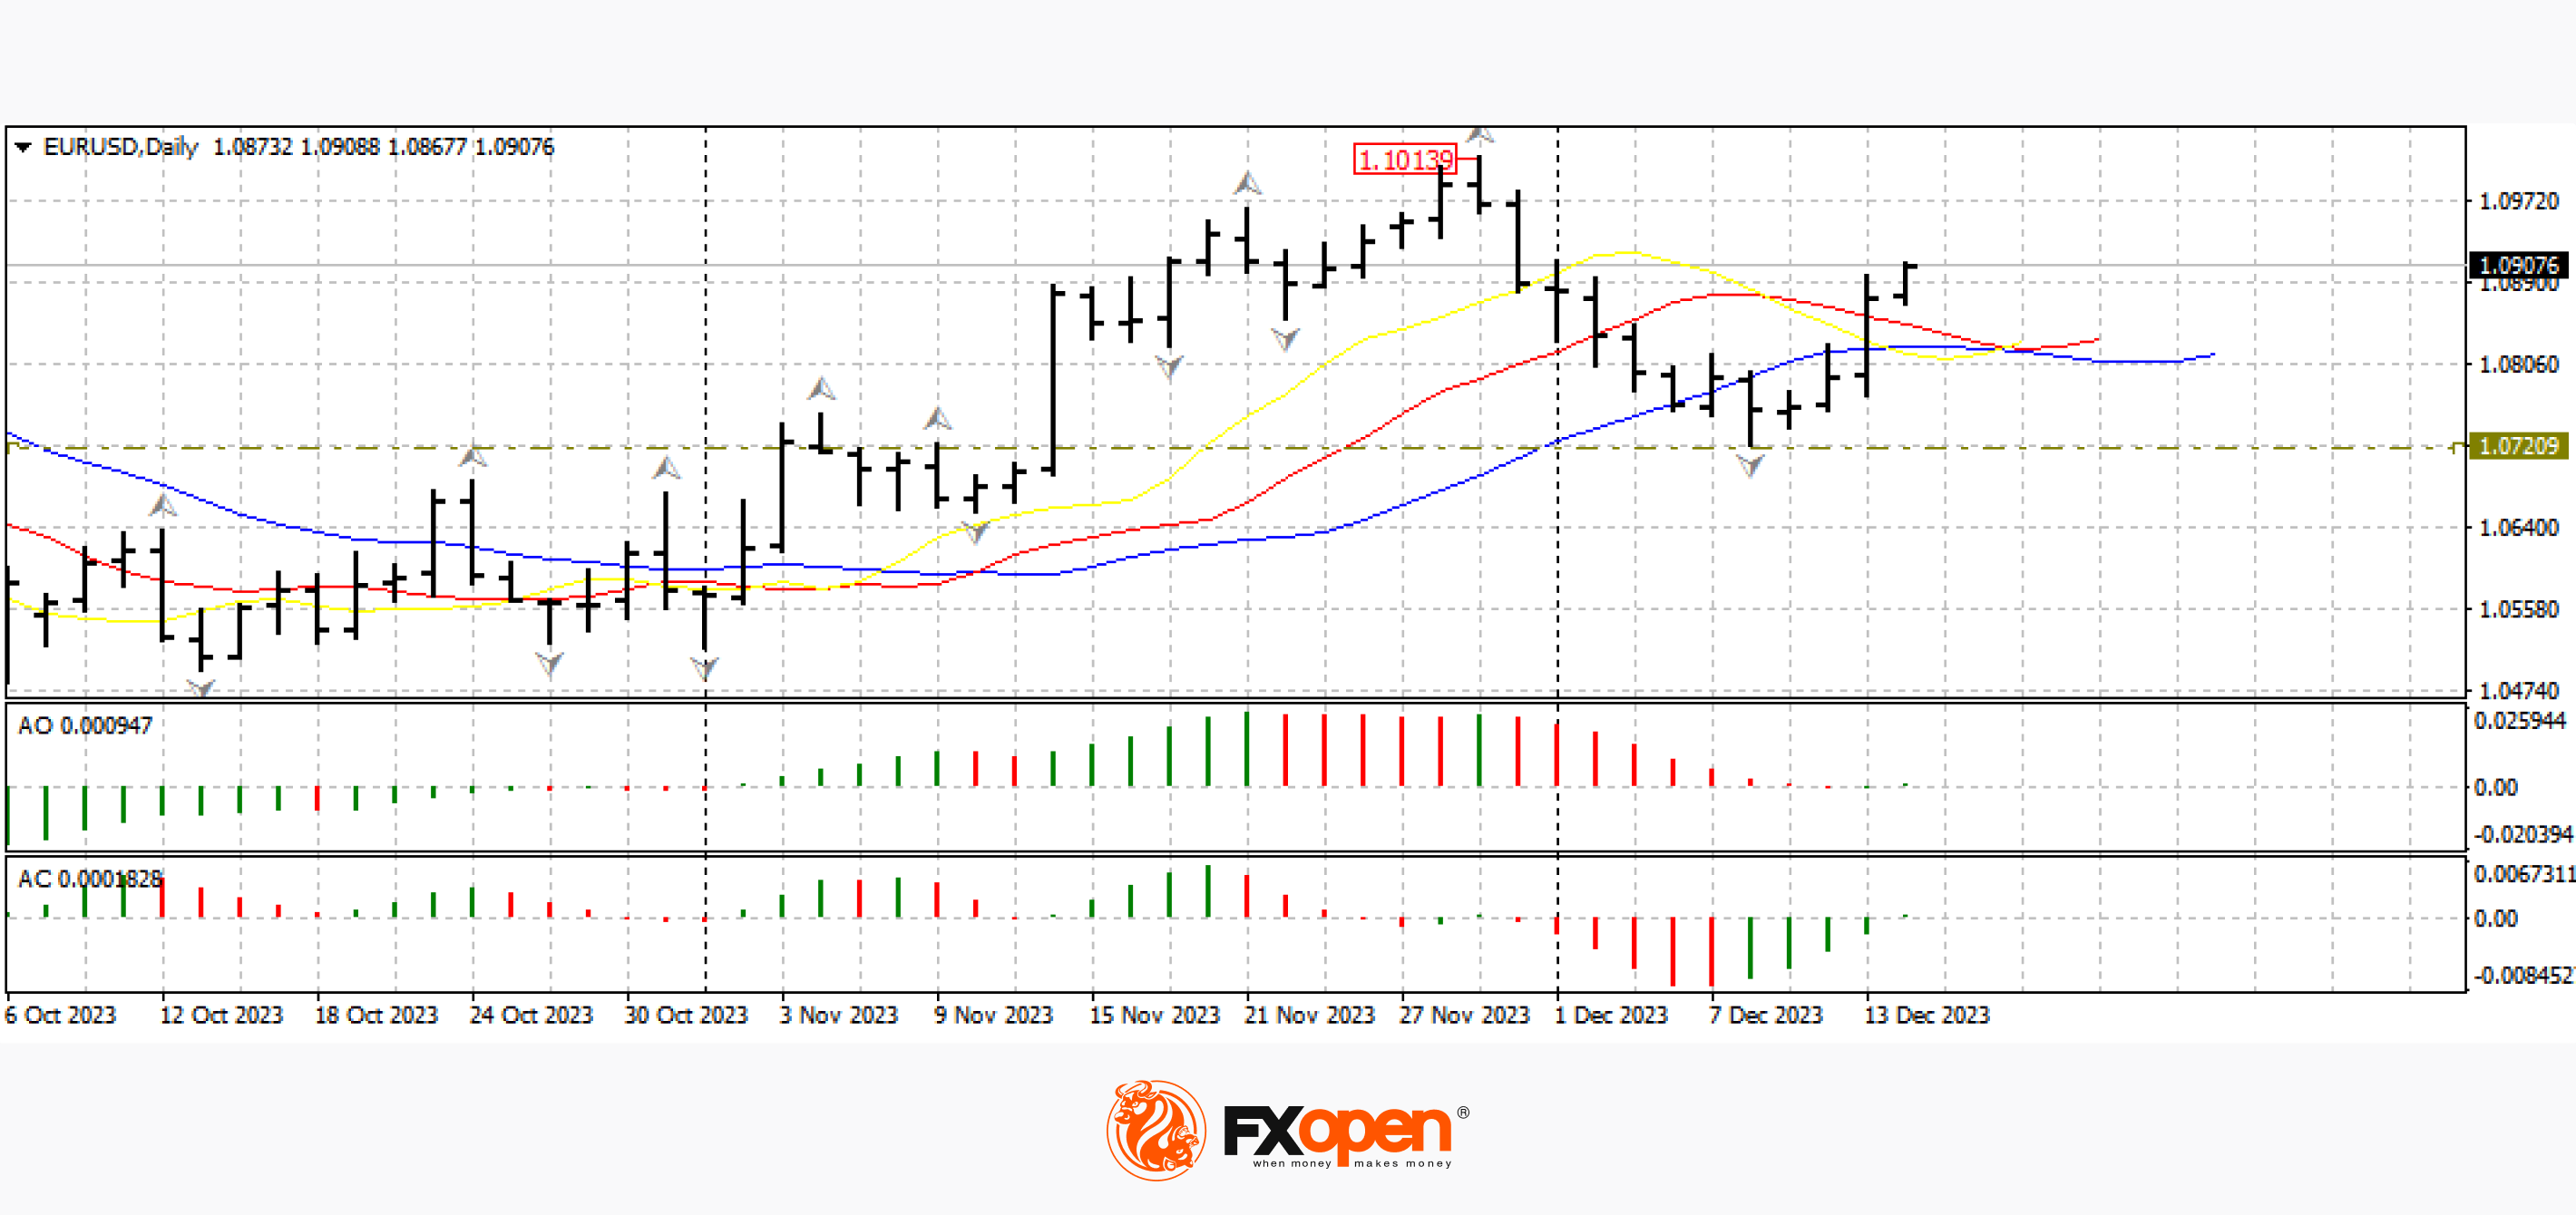
The single European currency is also awaiting a verdict from the central bank. Today at 16:30 GMT+3, there will be a meeting of the ECB, at which, according to experts, the base rate will be left at the same level of 4.50%. A press conference is scheduled for ECB head Christine Lagarde a little later. Also, important macroeconomic statistics from the eurozone are expected tomorrow. In particular, the index of business activity in the services sector for December will be published, as well as the composite PMI index for the same period.
According to the EUR/USD technical analysis, on the daily timeframe, the price is moving towards the upper fractal at 1.1020. A breakdown of the upward scenario can be considered upon a breakdown of 1.0700.
USD/CAD
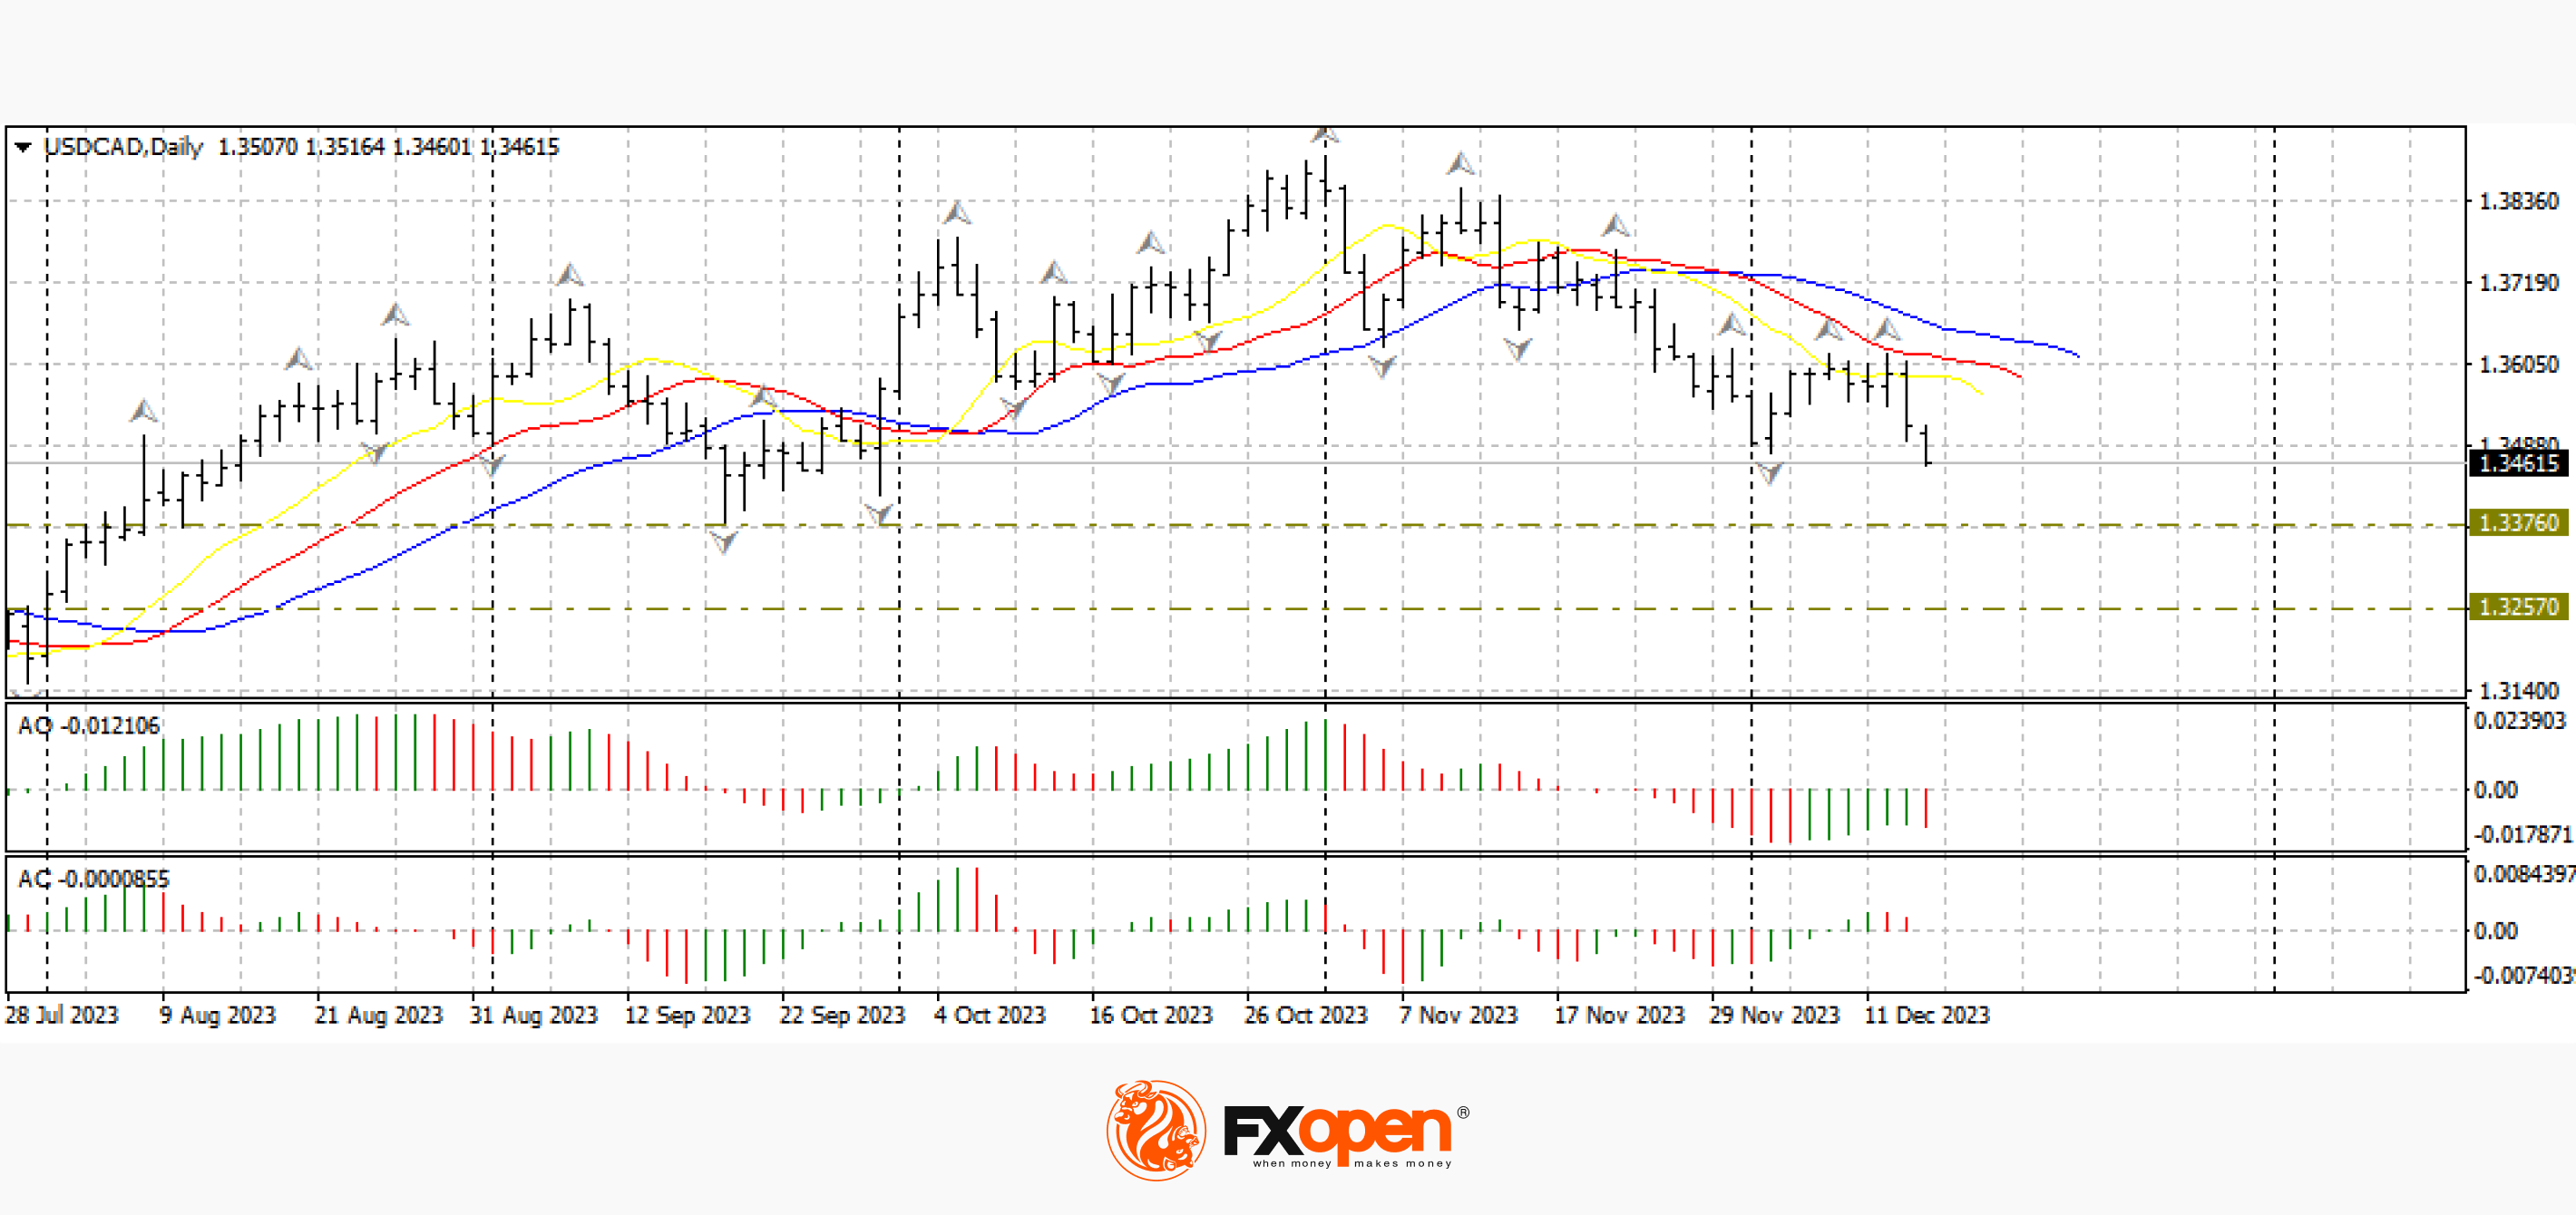
The result of yesterday's Fed meeting brought the USD/CAD pair out of a long flat movement in the corridor between 1.3600 and 1.3500. Today at 16:30 GMT+3, the basic US retail sales index for November will be published. Also, at this time, the weekly number of applications for unemployment benefits will be released.
The price confidently consolidated below the alligator lines on all higher time frames. If the current mood in the market continues, a continuation of the downward movement in the direction of 1.3300-1.3200 could happen.
Trade over 50 forex markets 24 hours a day with FXOpen. Take advantage of low commissions, deep liquidity, and spreads from 0.0 pips (additional fees may apply). Open your FXOpen account now or learn more about trading forex with FXOpen.
This article represents the opinion of the Companies operating under the FXOpen brand only. It is not to be construed as an offer, solicitation, or recommendation with respect to products and services provided by the Companies operating under the FXOpen brand, nor is it to be considered financial advice.
Stay ahead of the market!
Subscribe now to our mailing list and receive the latest market news and insights delivered directly to your inbox.


Latest articles

Weekly Market Insights with Gary Thomson: The Week of Central Banks and Earnings
In this video, we’ll explore the key economic events and market trends, shaping the financial landscape. Get ready for insights into financial markets to help you navigate the week ahead. Let’s dive in!
In this episode of Market

Intel at a Crossroads: Earnings Beat Meets Technical Resistance
Intel has just delivered its strongest quarter in over fifteen years, and the market reaction says it all. Q2 2026 revenue surged 25% year-over-year to $16.1 billion, crushing the consensus estimate of $14.42 billion, while adjusted EPS of

Tesla: Complex Range Structure Breaks Down Following Quarterly Earnings
Tesla released its Q2 2026 results after the market closed on 22 July. Revenue increased 26% year-on-year to $28.24 billion, while vehicle deliveries reached a record 480,126 units. However, operating margin fell sharply to 1.4%, down from