


Market Analysis: Commodity Currencies Falling, Euro and Pound Testing Key Supports
FXOpen

In the middle of January, the main currency pairs continue to trade in narrow flat channels, which most likely require a good news driver to exit. Thus, buyers of the pound/US dollar pair have been holding the price above 1.2600 for more than a week, and the euro/US dollar pair is trading above 1.0900. At the same time, commodity currencies failed to stay above strategic supports and demonstrate a moderate downward movement.
GBP/USD
On the GBP/USD chart, the pair is trading in a fairly narrow range between 1.2680-1.2780. On the daily time frame, the price is testing support with a linear alligator. If sellers of the pound manage to fix the price below 1.2620-1.2600, the pair may resume its downward movement in the direction of 1.2500-1.2350.
From the point of view of fundamental analysis, today at 10:00 GMT+3, we are waiting for data on the change in unemployment and the average level of wages in the UK for November. Also, at 18:00 GMT+3, one should pay attention to the speech of the head of the Bank of England, Andrew Bailey.
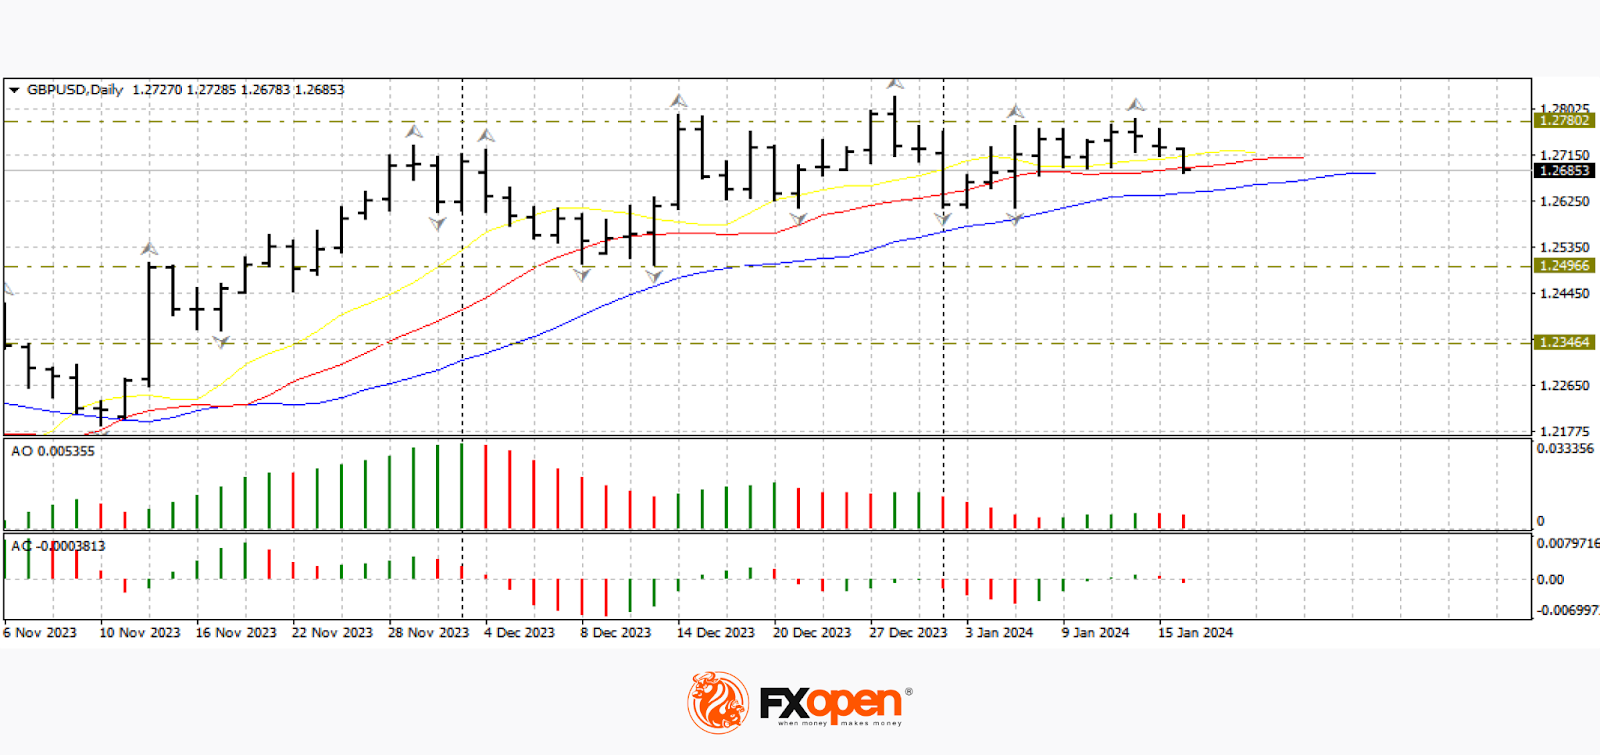
No less important fundamentals will be revealed tomorrow: at 10:00 GMT+3, the index of consumer prices in the UK for December will be published.
EUR/USD
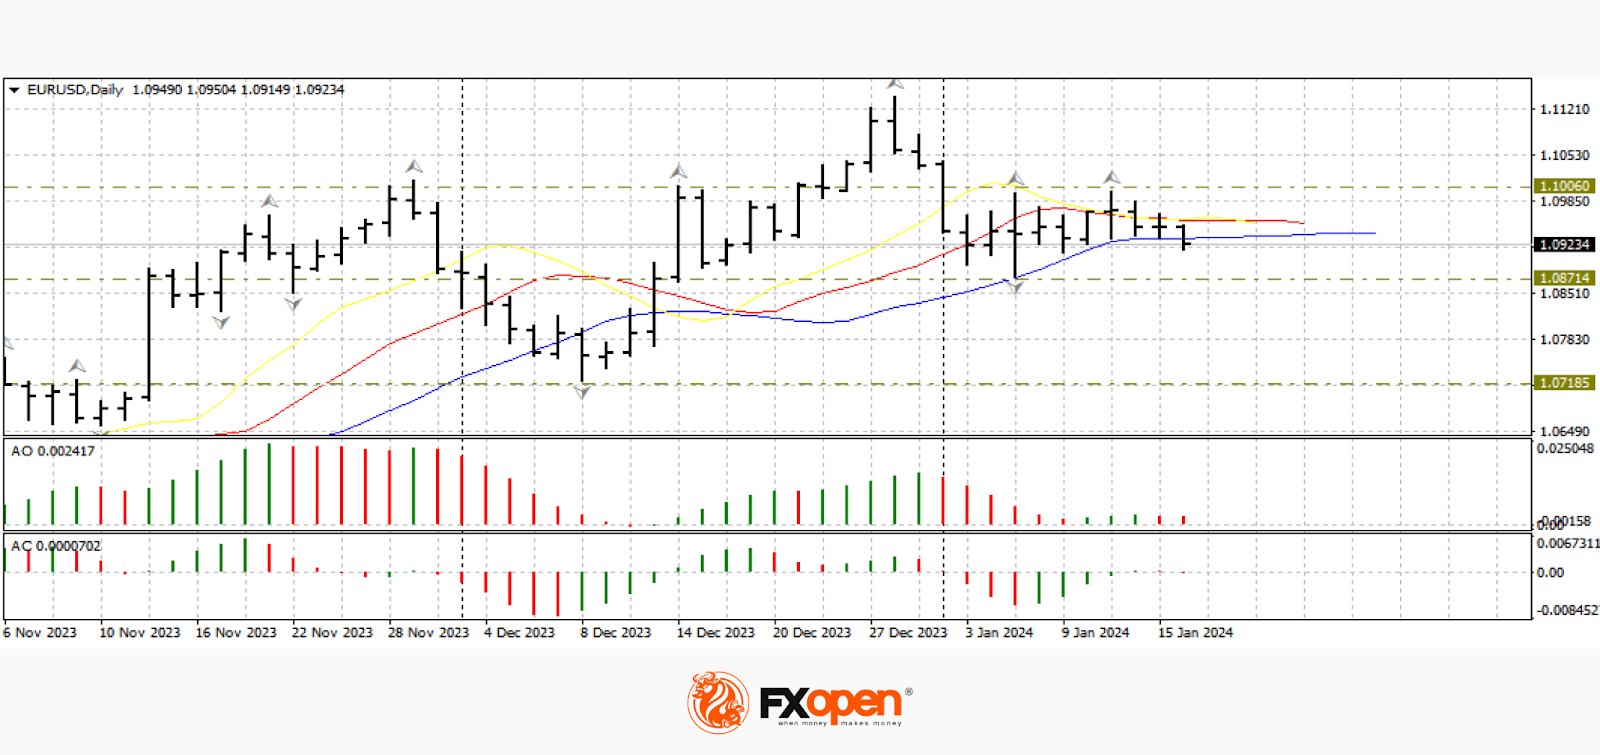
Market participants are not in a hurry to sell the single European currency in anticipation of the first ECB meeting this year, which is scheduled for next week. Most experts polled by Bloomberg believe that the ECB can cut rates four times in the current year. The current week's fundamental data can influence officials' decisions. Today at 10:00 GMT+3, we are waiting for the publication of data on the index of consumer prices in Germany for December. Tomorrow at 13:00 GMT+3, a similar indicator will be released in the Eurozone. Also, today at 14:00 GMT+3, one should pay attention to the speech of the President of the German Federal Bank, Joachim Nagel.
On the daily time frame, the price is testing support with a linear alligator. According to the EUR/USD analysis, the breakdown of the range 1.0900-1.0870 may contribute to the resumption of the downward trend in the direction of 1.0720-1.0700. If the price consolidates above 1.1000, further growth in the direction of 1.1300 is possible.
USD/CAD
On the USD/CAD chart, the pair continues to strengthen. The price managed to go above the alligator line on the daily timeframe, if the buyers are firmly fixed above 1.3400, the pair's growth may continue in the direction of 1.3620-1.3550.
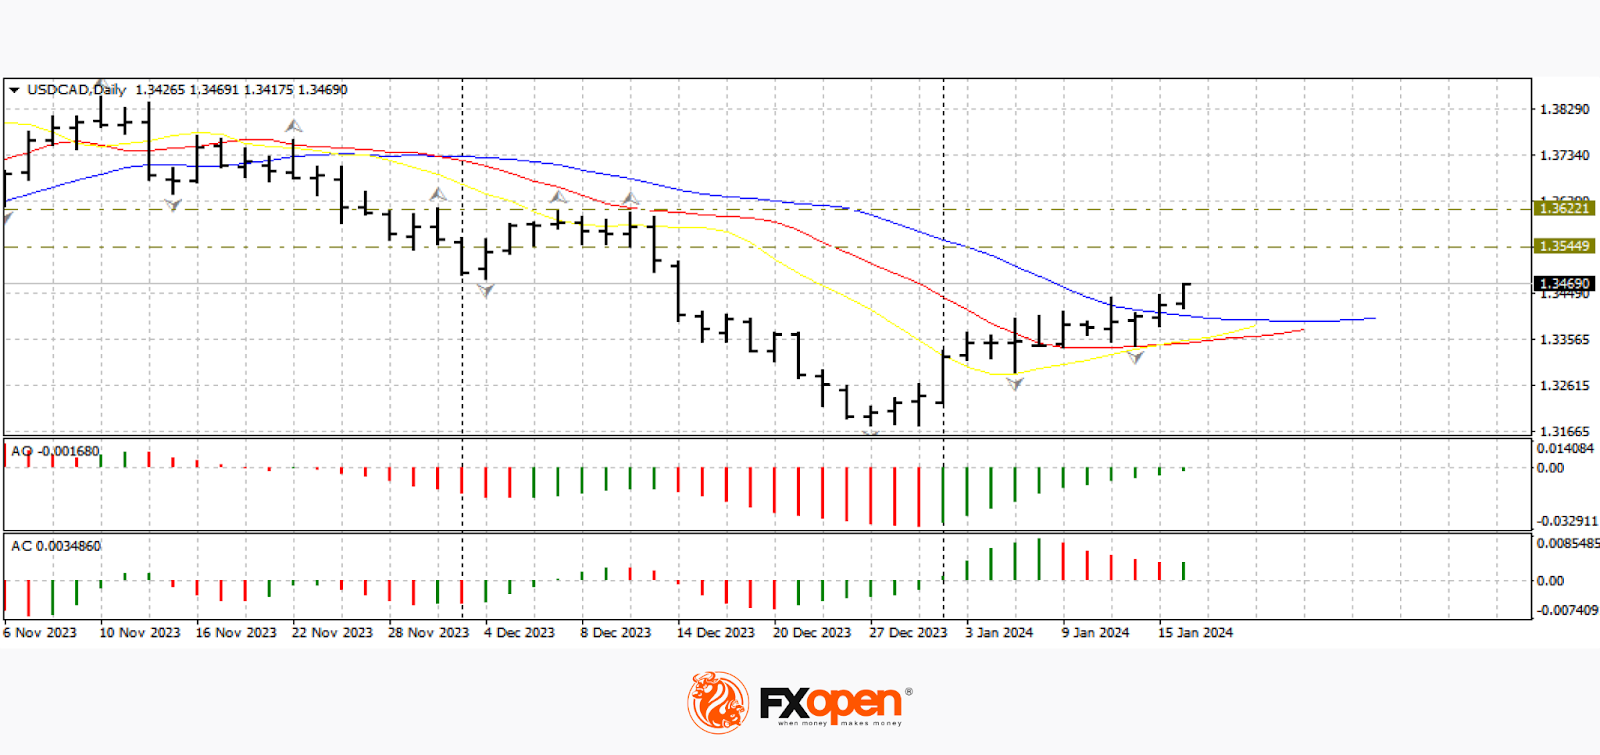
Today at 4:30 pm GMT+3, one should pay attention to the publication of data on the index of consumer prices in Canada for December.
Trade over 50 forex markets 24 hours a day with FXOpen. Take advantage of low commissions, deep liquidity, and spreads from 0.0 pips (additional fees may apply). Open your FXOpen account now or learn more about trading forex with FXOpen.
This article represents the opinion of the Companies operating under the FXOpen brand only. It is not to be construed as an offer, solicitation, or recommendation with respect to products and services provided by the Companies operating under the FXOpen brand, nor is it to be considered financial advice.
Stay ahead of the market!
Subscribe now to our mailing list and receive the latest market news and insights delivered directly to your inbox.


Latest articles

US Dollar Index: A Defining Week for the King of the Markets
The dollar heads into a pivotal week trading near 101.80, just off a 15-month high, with the Fed's July 29 meeting standing as the clear focal point. Markets currently price roughly a 65% chance of a hold, though renewed

NZD/USD: Inflation Surge Meets Strong US Dollar Pressure
On 21 July, Stats NZ reported an acceleration in inflation: the Consumer Price Index rose 1.5% in the second quarter, while the annual inflation rate climbed to 4.1%, its highest level in more than two years and slightly

Weekly Market Insights with Gary Thomson: The Week of Central Banks and Earnings
In this video, we’ll explore the key economic events and market trends, shaping the financial landscape. Get ready for insights into financial markets to help you navigate the week ahead. Let’s dive in!
In this episode of Market