


Market Analysis: Dollar Declines as Labour Market Cools
FXOpen

EUR/USD
The euro stabilised against the dollar on Thursday as optimism around the peak of policy tightening and possible rate cuts driven by easing inflation in major economies faded. During the week, inflation data from the US and UK fueled hopes that their central banks are done raising rates. The focus now turned to eurozone inflation on Friday. The euro was flat at USD 1.0853, up 2.5% for the month, while the dollar index, which tracks the greenback against a basket of currencies from other major trading partners, was marginally higher. According to EUR/USD technical analysis, the immediate resistance can be seen at 1.0881, a breakout to the upside could trigger a rise towards 1.0912. On the downside, immediate support is seen at 1.0833, a break below could take the pair towards 1.0761.
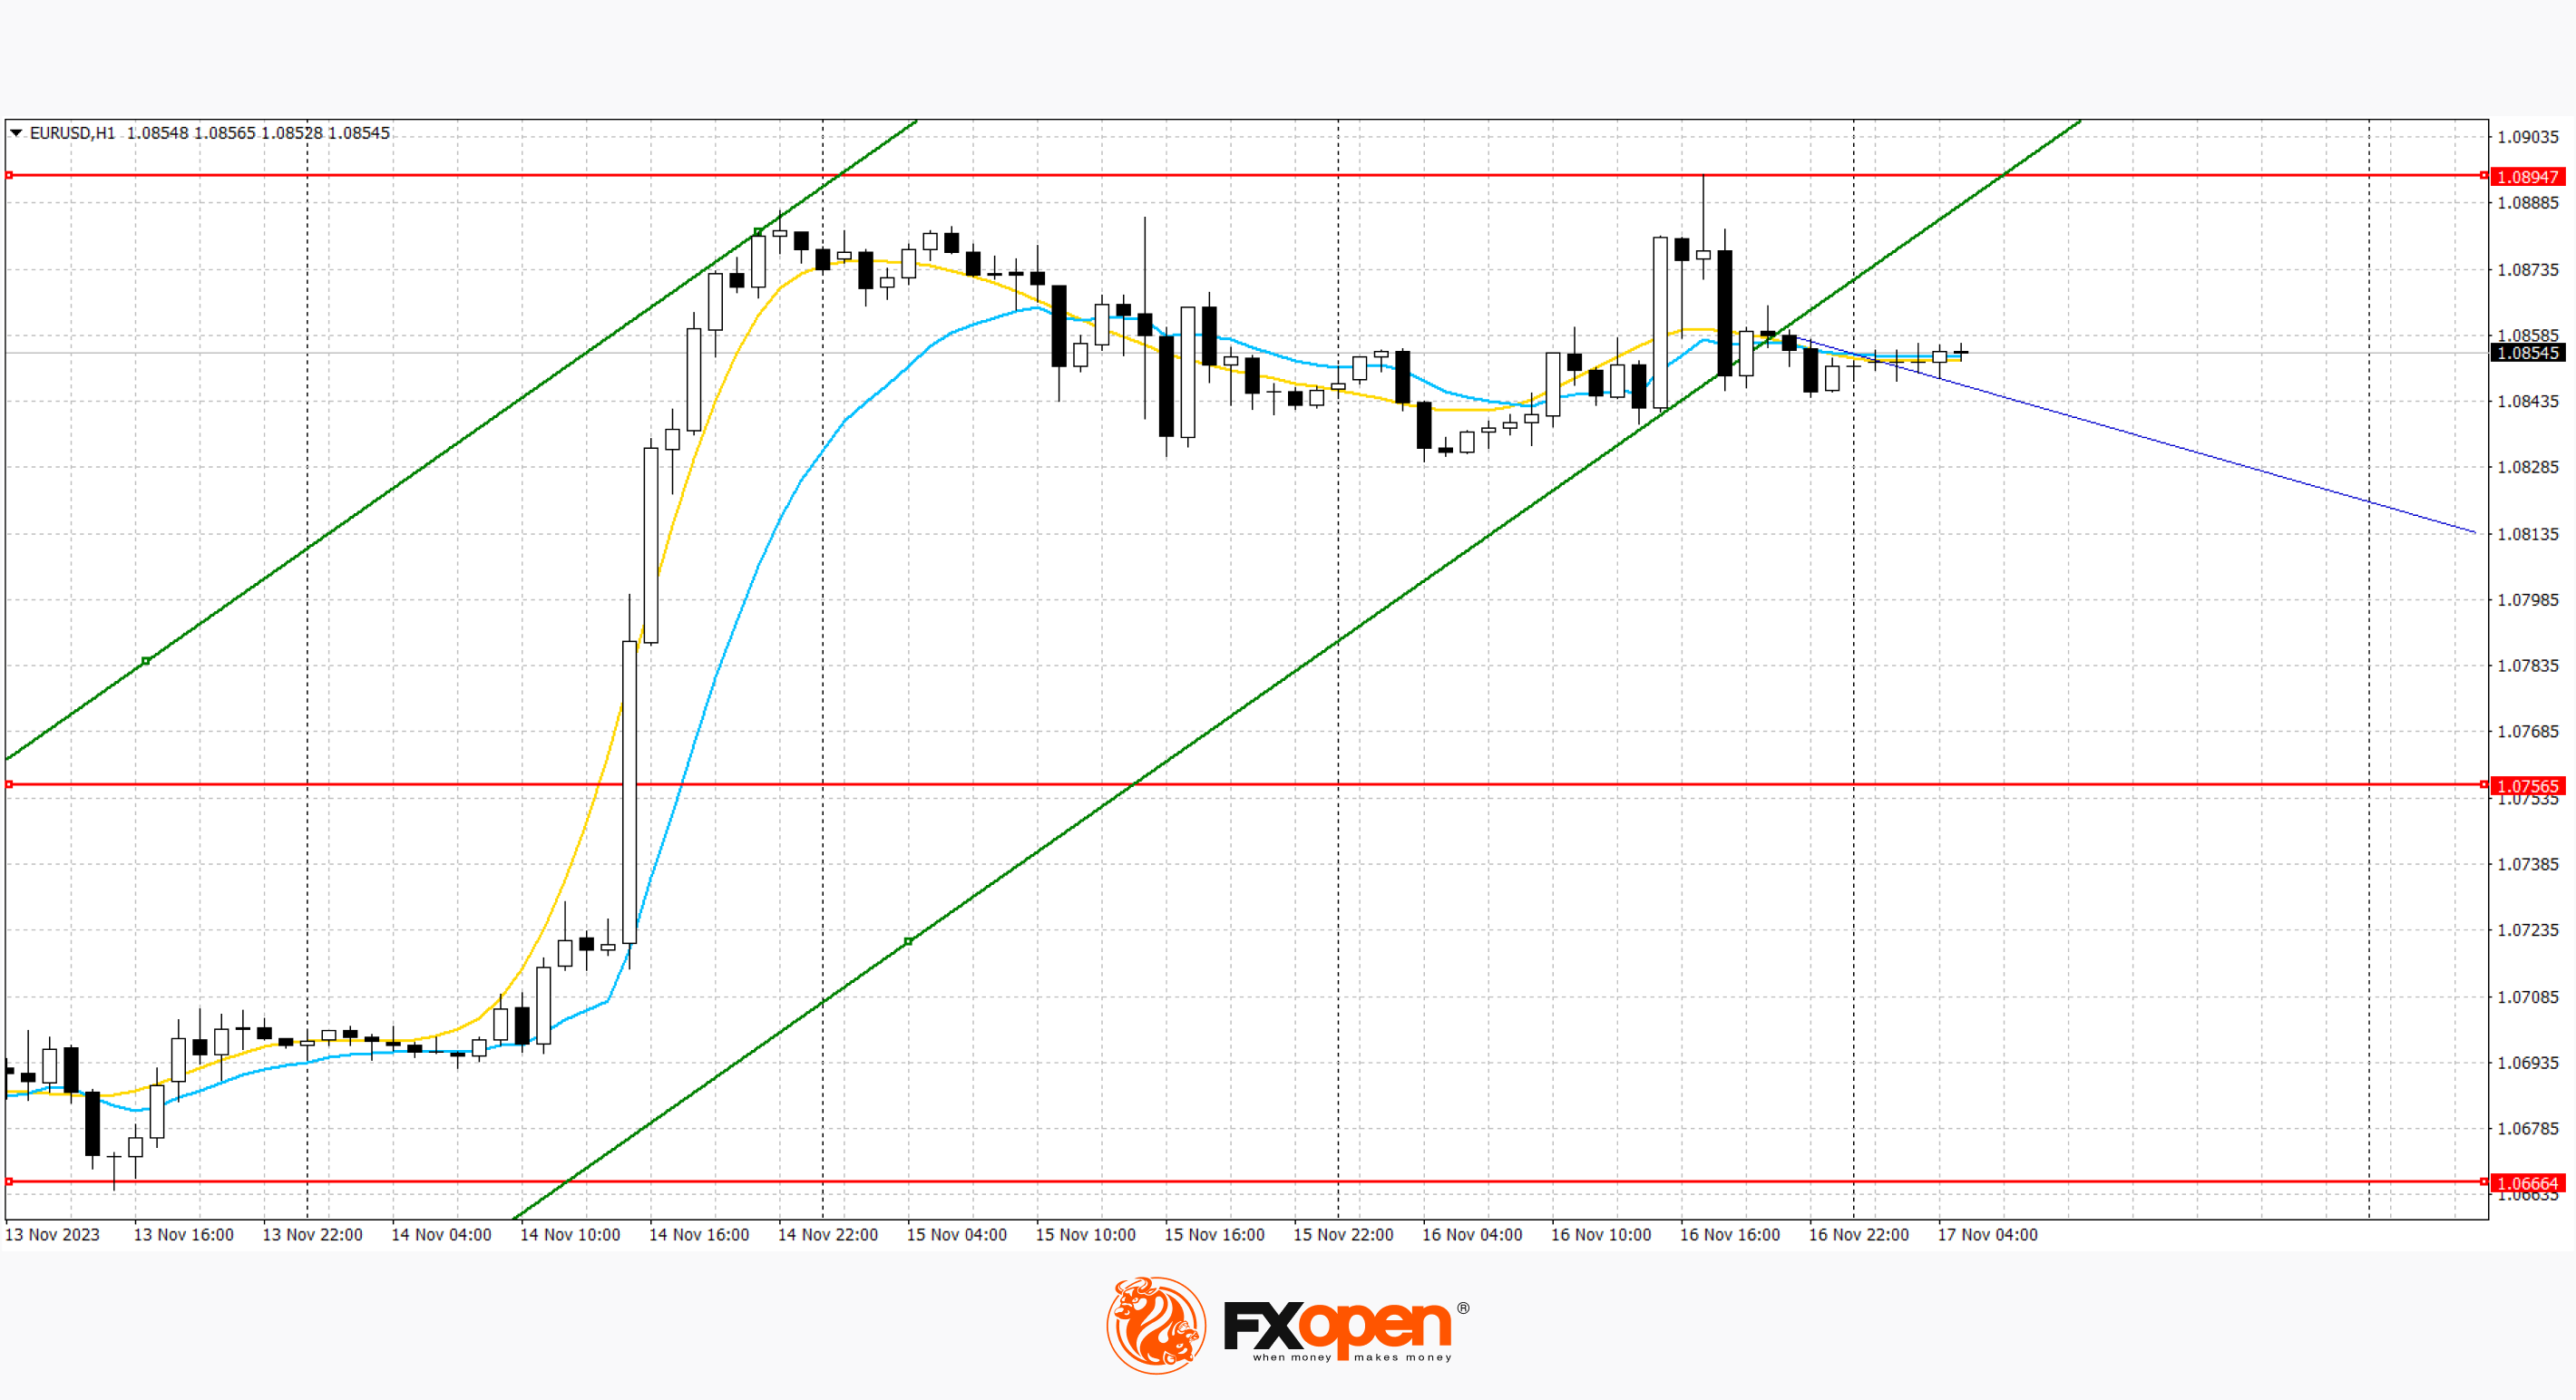
The price has broken through the lower boundary of the ascending channel and may continue to decline.
GBP/USD
The pound fell on Thursday after UK consumer prices rose less than forecast in October, prompting markets to raise their expectations of a rate cut from the Bank of England. Data showed domestic consumer inflation fell more than expected in October as household energy prices fell from a year earlier, fueling investor bets that the Bank of England may refrain from further tightening monetary policy to protect the economy's growth. Investors added to their bets that the Bank of England would cut rates next year, with three cuts of 25 basis points by December 2024 almost entirely coming to fruition. Sterling was last down 0.02% on the day at USD 1.2415. On the GBP/USD chart, the nearest resistance can be seen at 1.2433, a breakout to the upside could trigger a rise to 1.2529. On the downside, immediate support is seen at 1.2359, a break below could take the pair towards 1.2288.
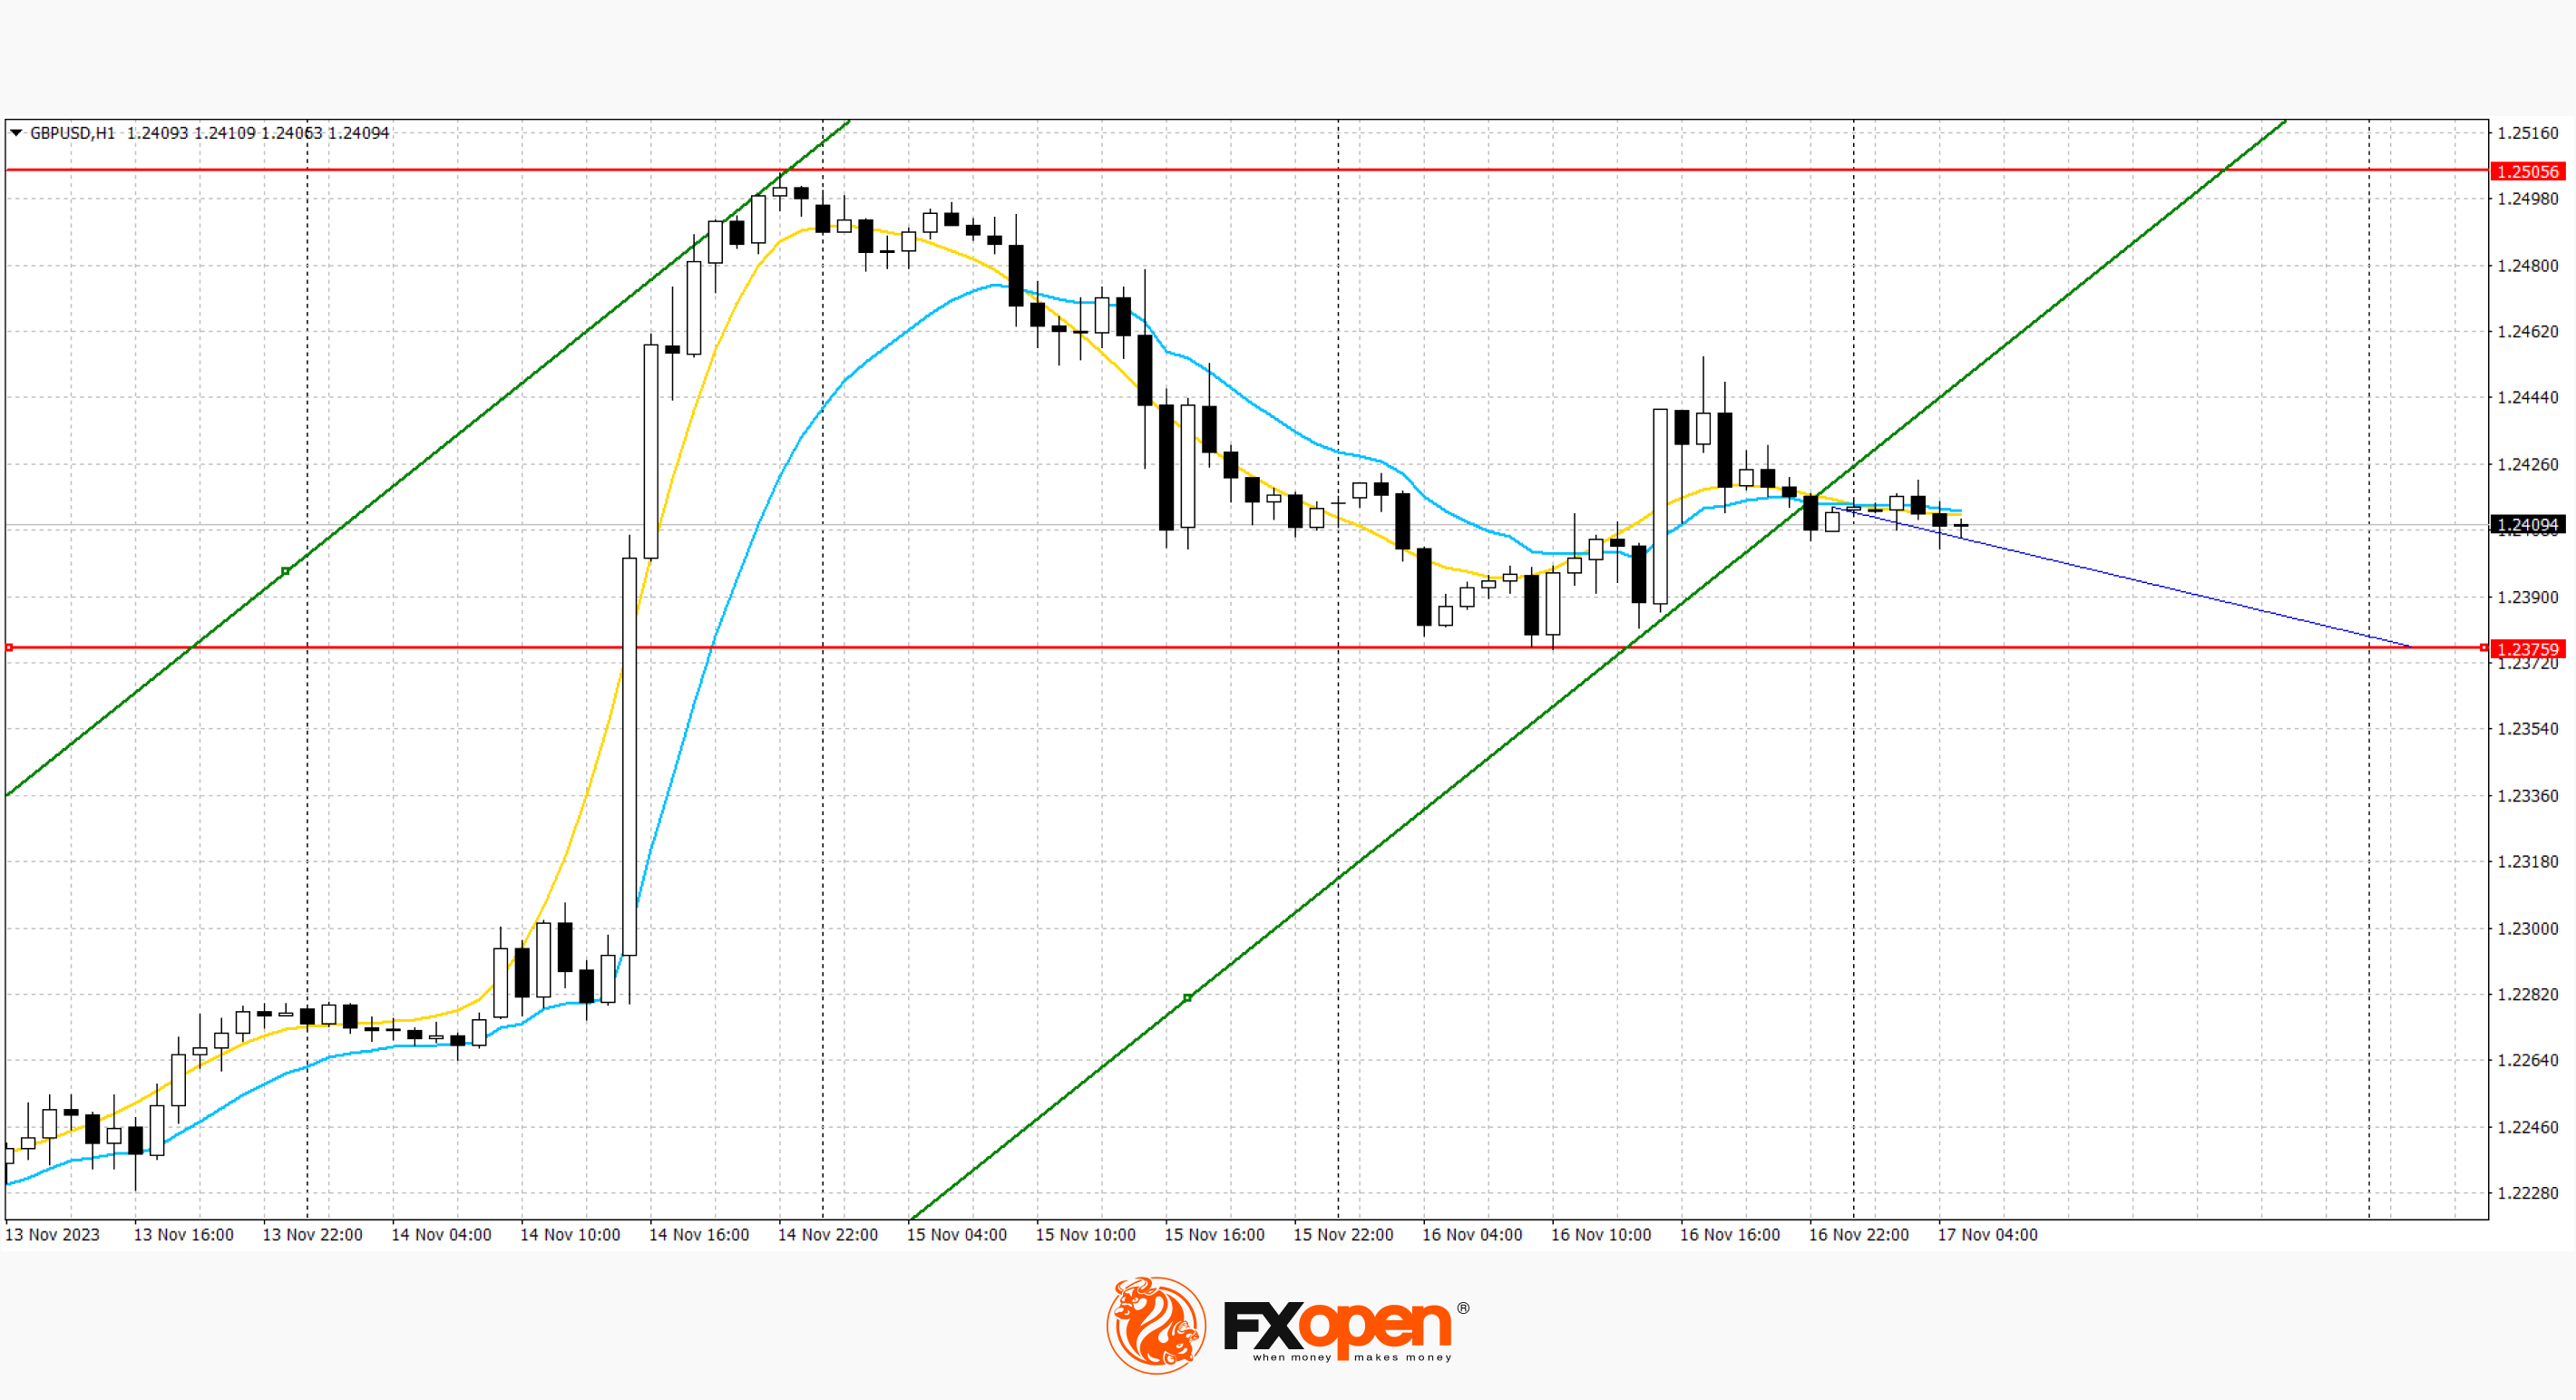
The price has broken through the lower boundary of the ascending channel and may continue to decline.
USD/JPY
The dollar fell against the yen on Thursday after US jobless claims rose more than expected last week, indicating a cooling labour market that could prompt the Federal Reserve to cut interest rates in early 2024 as it tries to orchestrate a soft landing. The dollar index rose 0.08%. Claims for state unemployment benefits rose 13,000 to a seasonally adjusted 231,000 in the week ended Nov. 11, the Labour Department reported. Economists polled by Reuters had forecast 220,000 claims for the latest week. On the USD/JPY chart, strong resistance can be seen at 150.96, a break higher could trigger a rise towards 151.52. In the fall, immediate support is visible at 150.34. A break below could take the pair towards 149.57.
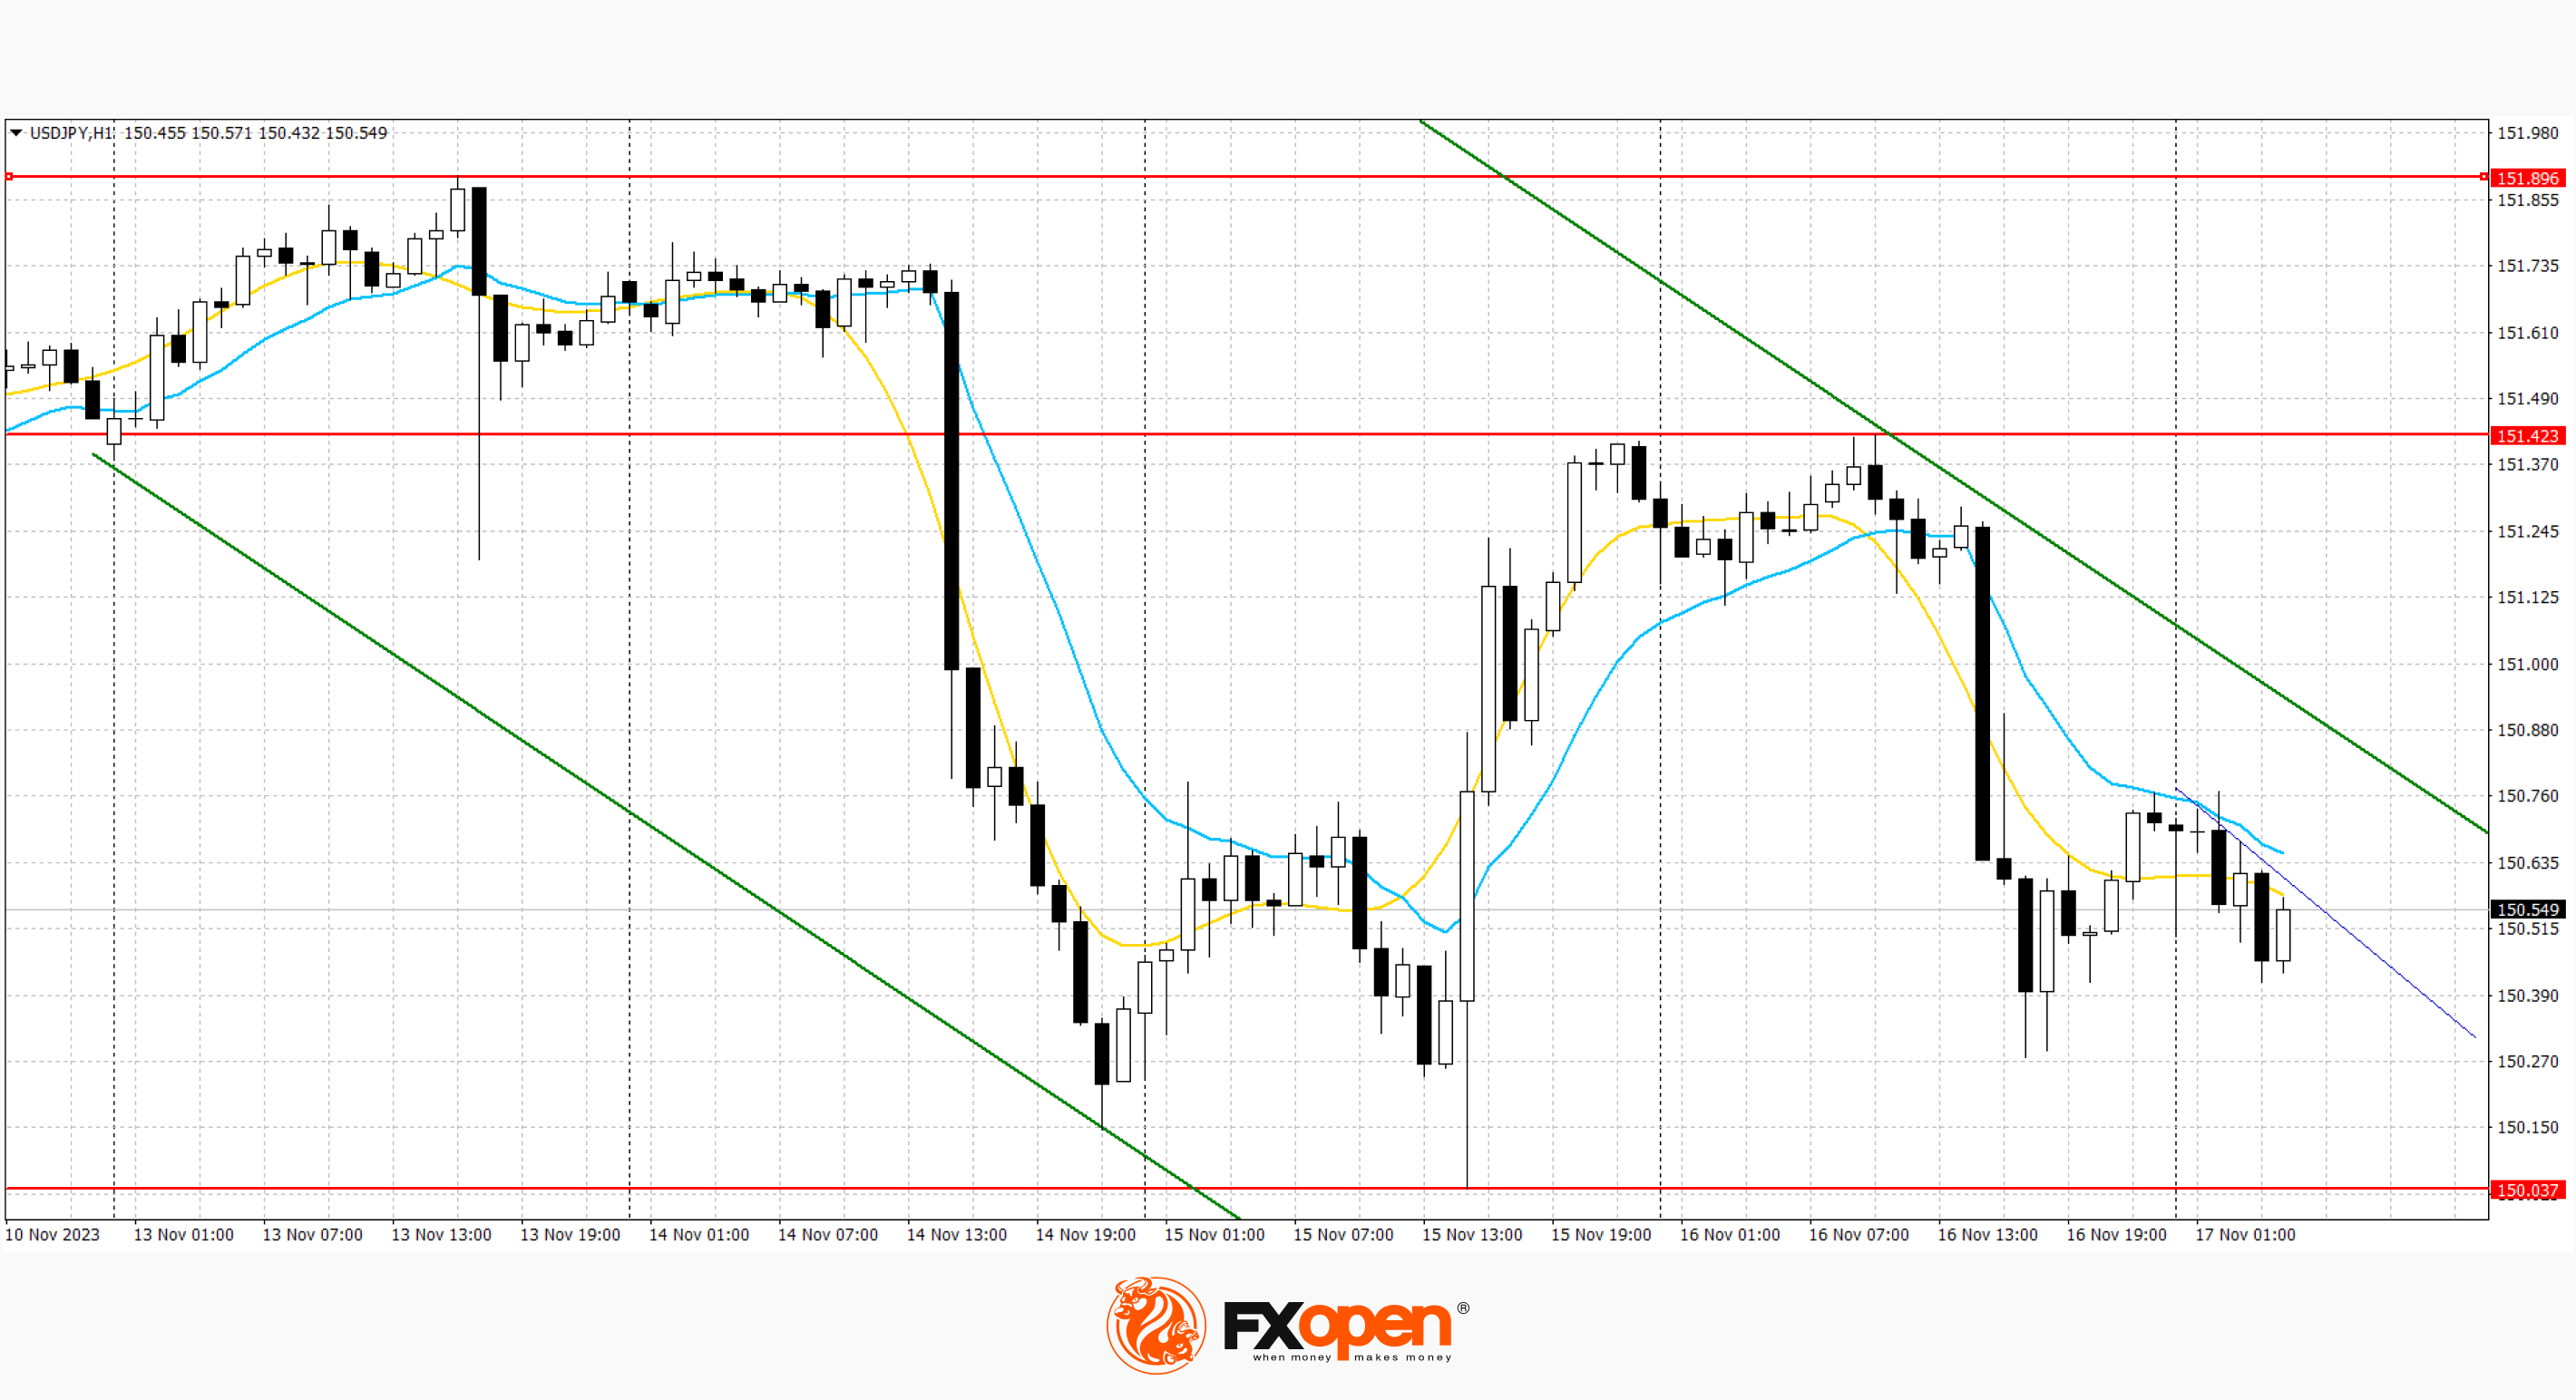
The downward channel is maintained. Now, the price is moving down along the upper border of the channel.
Trade over 50 forex markets 24 hours a day with FXOpen. Take advantage of low commissions, deep liquidity, and spreads from 0.0 pips (additional fees may apply). Open your FXOpen account now or learn more about trading forex with FXOpen.
This article represents the opinion of the Companies operating under the FXOpen brand only. It is not to be construed as an offer, solicitation, or recommendation with respect to products and services provided by the Companies operating under the FXOpen brand, nor is it to be considered financial advice.
Stay ahead of the market!
Subscribe now to our mailing list and receive the latest market news and insights delivered directly to your inbox.


Latest articles

AI Valuations Are Back in the Spotlight
Artificial intelligence remains the dominant investment theme of 2026, but investors are increasingly questioning whether AI stock valuations are keeping pace with reality.
💰 Big Tech continues to invest at an unprecedented scale, with hyperscaler AI spending projected to exceed $800

AUD/CAD: Months of Indecision — Is a Breakout Finally Coming?
The Australian dollar has clawed back most of its end-of-June losses, when it touched three-month lows against the greenback amid escalating Middle East tensions. Since then, sentiment has improved: the RBA's Assistant Governor Sarah Hunter signalled the board stands ready

USD/JPY: Battling at the Top of the Triangle
On 3 July, Japan's Finance Minister, Satsuki Katayama, stated that the Ministry of Finance remains in close contact with US authorities regarding developments in USD/JPY as the yen traded near its weakest level in almost 40 years. Similar verbal