FXOpen

EUR/USD
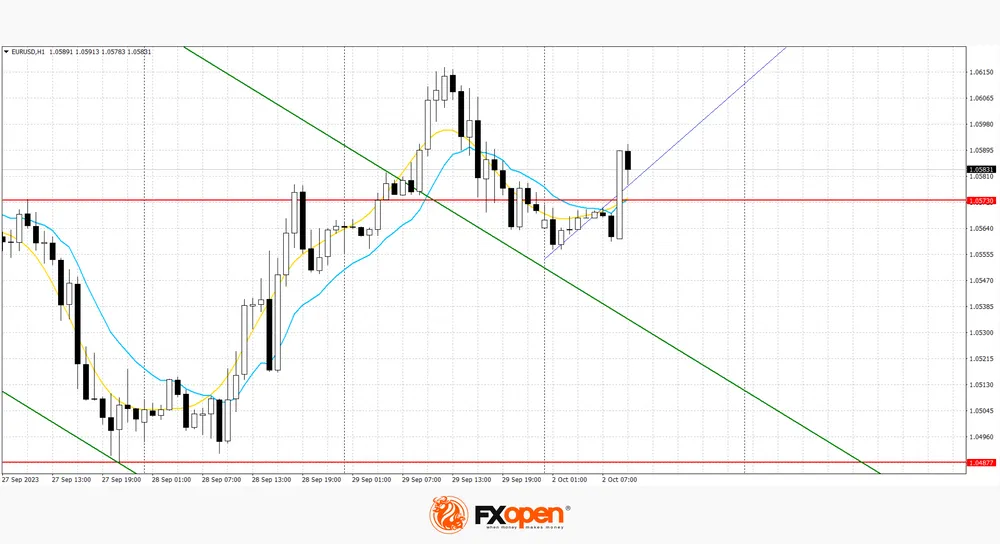
The euro rose on Friday following the release of softer-than-expected US inflation data. The data showed that the price index for personal consumption expenditures (PCE), excluding volatile components of food and energy, increased 3.9% year-on-year in August, the first time it fell below 4% in more than two years. The Fed tracks PCE price indexes to achieve its 2% inflation target. The euro was up 0.10% on the day at USD 1.0578, but it was its worst quarter against the dollar in a year, down 3.08%. The immediate resistance can be seen at 1.0582, and a breakout to the upside could trigger a rise towards 1.0619. On the downside, immediate support is seen at 1.0491, a break below could take the pair towards 1.0441.
The price has broken through the upper boundary of the downward channel and may continue to rise.

GBP/USD
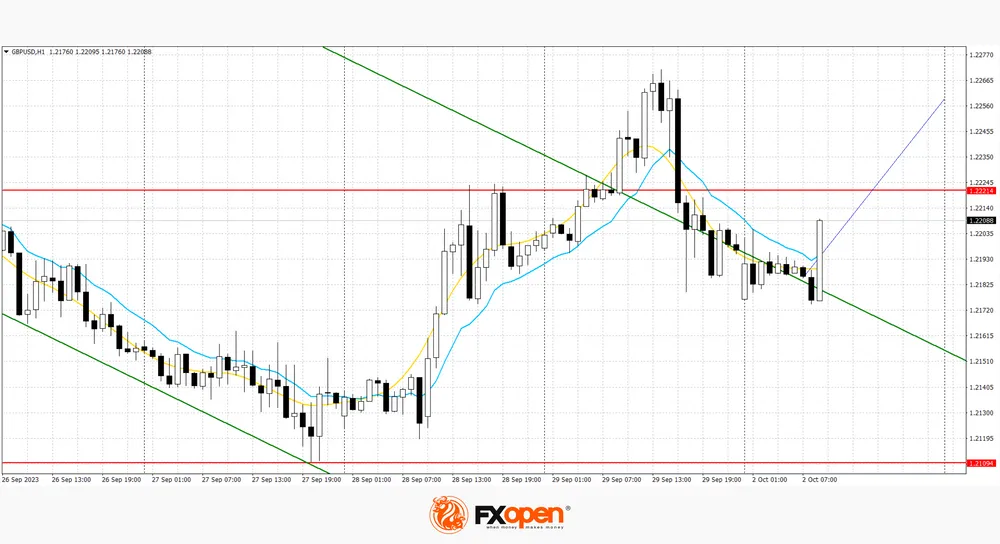
The pound rose on Friday after data showed the British economy has grown faster than expected since the start of the COVID-19 pandemic but is still forecast for its worst quarter against the US dollar in a year. The Office for National Statistics said the UK economy was 1.8% larger in the second quarter of 2023 than in the last quarter of 2019, the last full quarter before the pandemic hit. Sterling rose 0.04% to USD 1.2206, hitting its lowest level since March 17 this week. The British currency is on track for a quarterly loss of 3.85% against the US dollar, its worst performance in a year. The nearest resistance can be seen at 1.2274, a breakout to the upside could trigger a rise towards 1.2315. On the downside, immediate support is seen at 1.2179, and a break below could take the pair towards 1.2098.
The price has broken through the upper boundary of the downward channel and may continue to rise.

USD/JPY
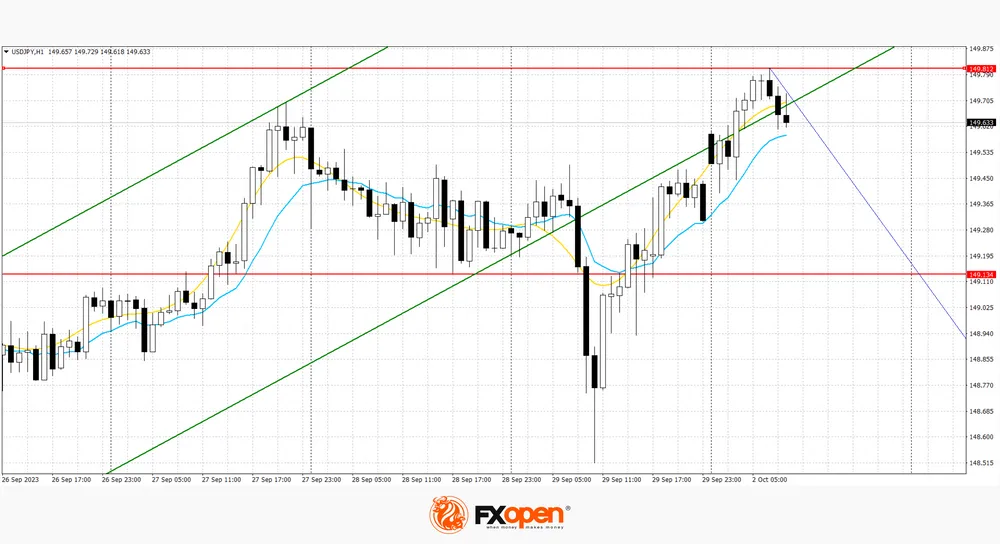
The US dollar weakened on Friday, giving the yen some breathing room as intervention measures tightened. Despite some respite on Friday, pressure remained on the yen as it traded around 150 to the US dollar, a level widely seen as a potential trigger for government intervention. Core inflation in Japan's capital slowed for the third month in a row in September, mainly due to lower fuel prices, data showed on Friday. The yen strengthened 0.10% on Friday against the greenback to 149.13 per US dollar. The dollar index, which measures the US dollar against a basket of major currencies, fell 0.16%. The US dollar has risen 3.54% against the yen this quarter after rising 8.66% last quarter. Strong resistance can be seen at 149.79, and a break higher could trigger a rise towards 150.09. On the downside, immediate support is visible at 149.04, a break below could take the pair towards 148.18.
The price has broken through the lower boundary of the ascending channel and may continue to decline.

Trade over 50 forex markets 24 hours a day with FXOpen. Take advantage of low commissions, deep liquidity, and spreads from 0.0 pips (additional fees may apply). Open your FXOpen account now or learn more about trading forex with FXOpen.
This article represents the opinion of the Companies operating under the FXOpen brand only. It is not to be construed as an offer, solicitation, or recommendation with respect to products and services provided by the Companies operating under the FXOpen brand, nor is it to be considered financial advice.
Stay ahead of the market!
Subscribe now to our mailing list and receive the latest market news and insights delivered directly to your inbox.


