


Market Analysis: The US Dollar Is Correcting in Anticipation of US GDP Data Publication
FXOpen

The sharp strengthening of the American currency was replaced by a no less sharp corrective rollback. But whether this will be the beginning of a full-scale correction, we will see after the publication of important data for this week. In the coming trading sessions, the US GDP for the Q2, ADP Employment Change, as well as the NBS Non-manufacturing PMI in China will be released. These macroeconomic data are very important for market participants and can both reinforce existing trends and contribute to a reversal.
USD/JPY
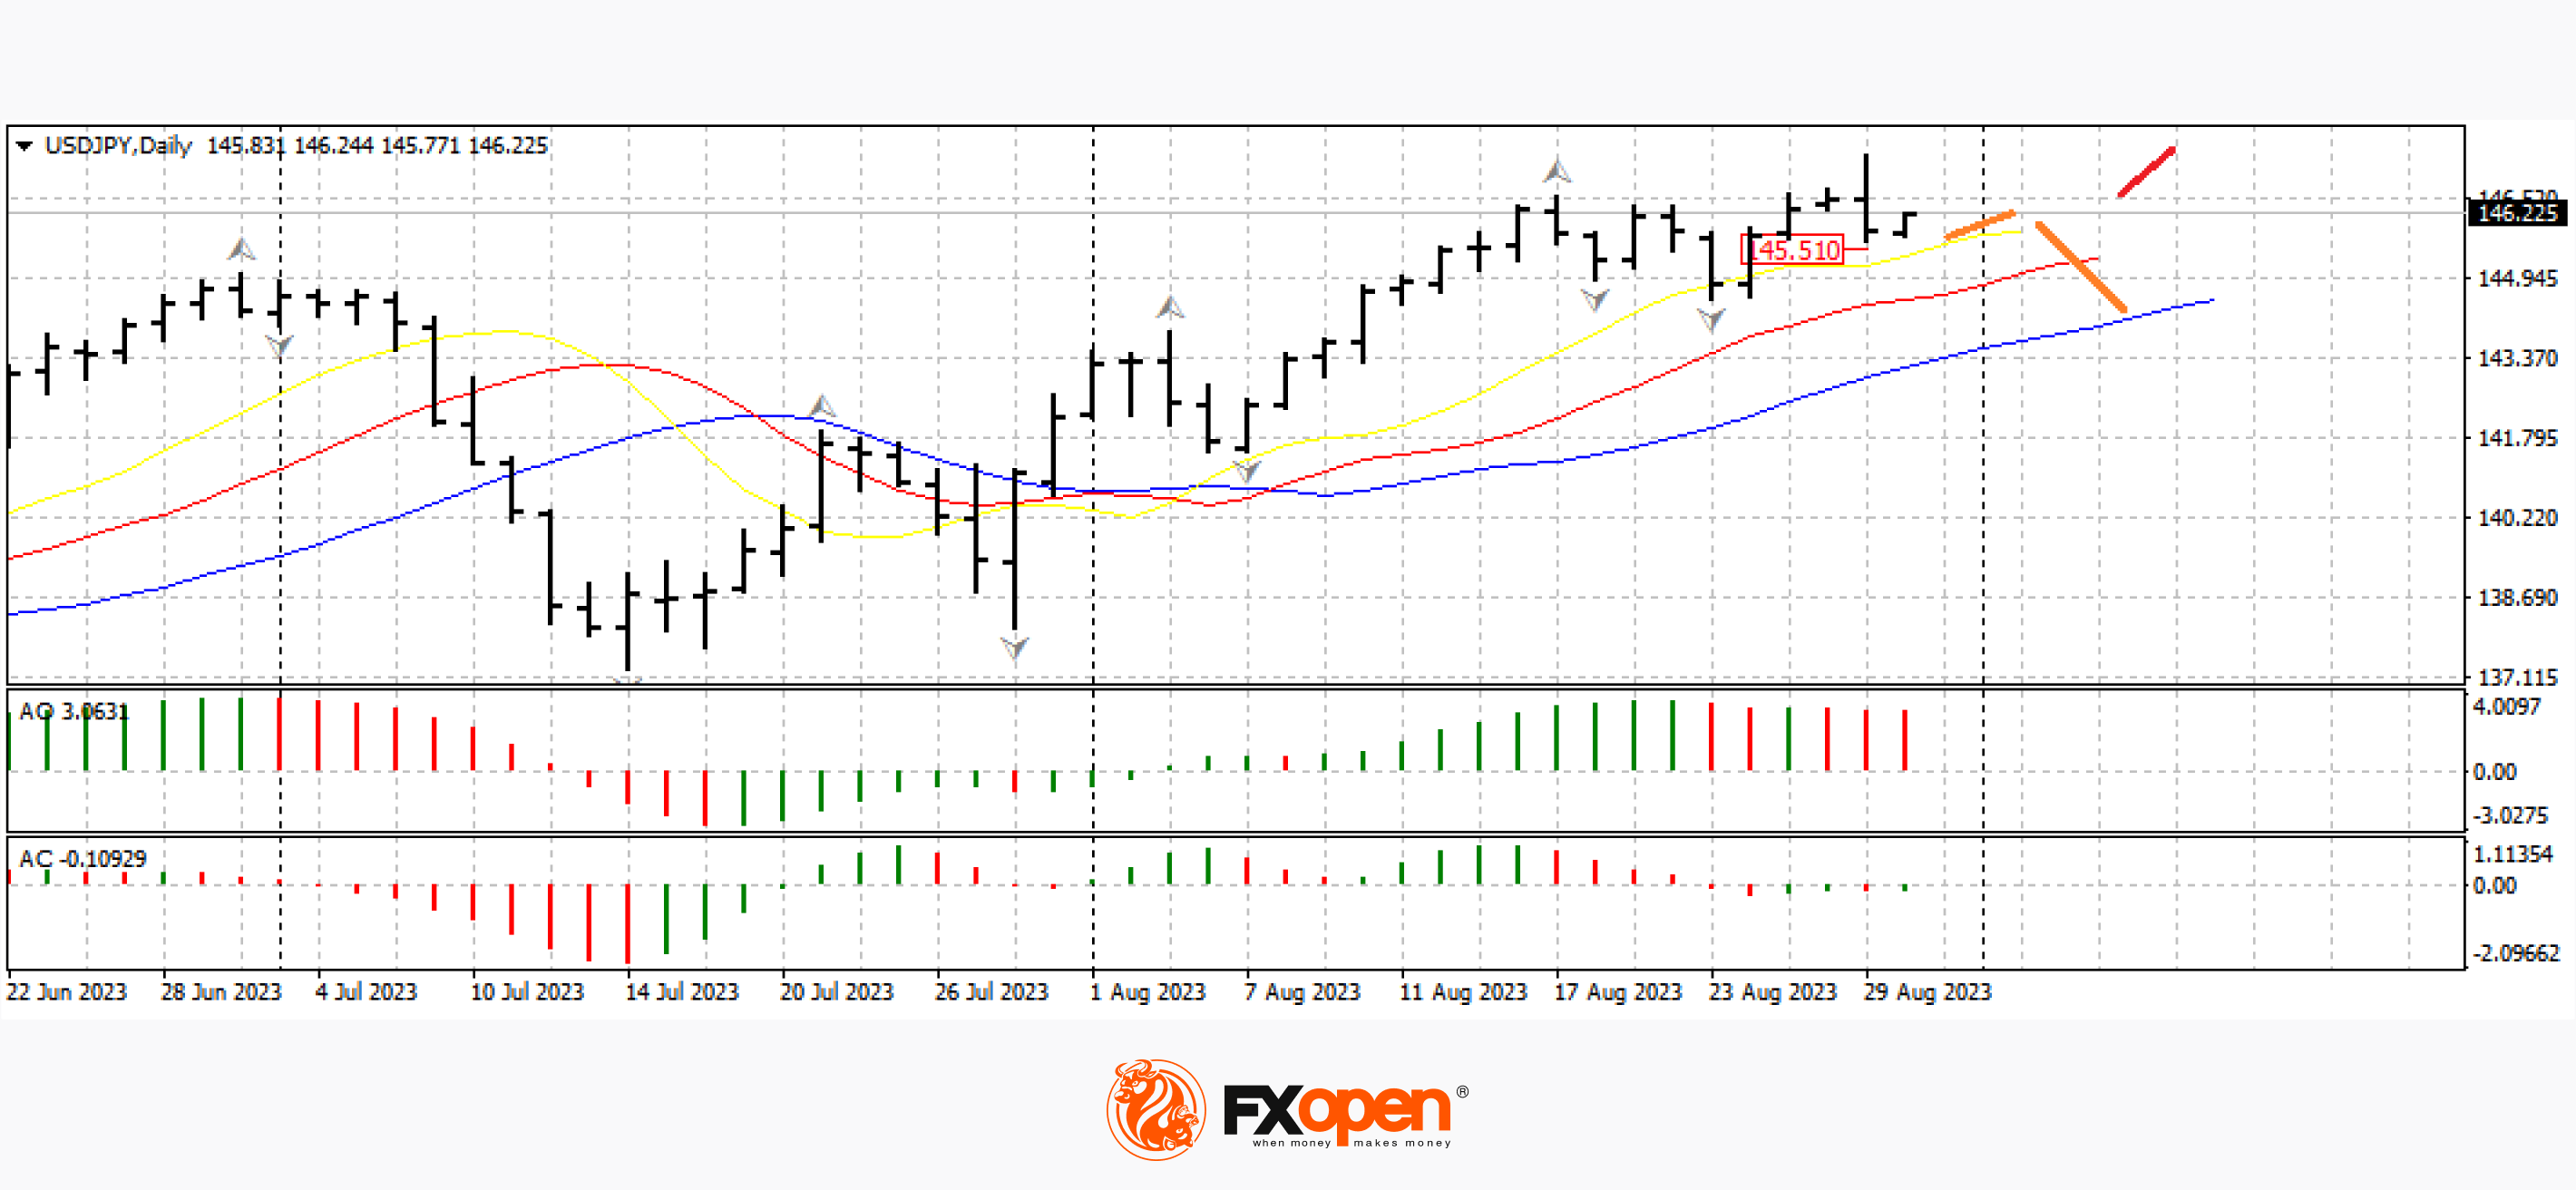
Yesterday, the US dollar/Japanese yen currency pair soared sharply above 147.00. Nevertheless, the greenback buyers failed to continue this upward impulse or at least gain a foothold above 147.00. In just a couple of hours, the pair lost more than 150 pips and fell below 146.00. Such a sharp rollback allowed the sellers of the US currency to form a reversal bearish bar on the daily timeframe near 145.70. At the moment, the price has retreated from yesterday's lows; an important range for the development of a corrective rollback is 146.20-146.50. If the pair fails to strengthen higher, a test of 145.70-145.00 may occur.
Today at 15:15 GMT+3, ADP Employment Change will be released, and a little later, data on US GDP for Q2 will be published. Also important for the pricing of the pair will be the US Pending Home Sales Index, the publication of which is scheduled for 17:00 GMT+3.
USD/CAD
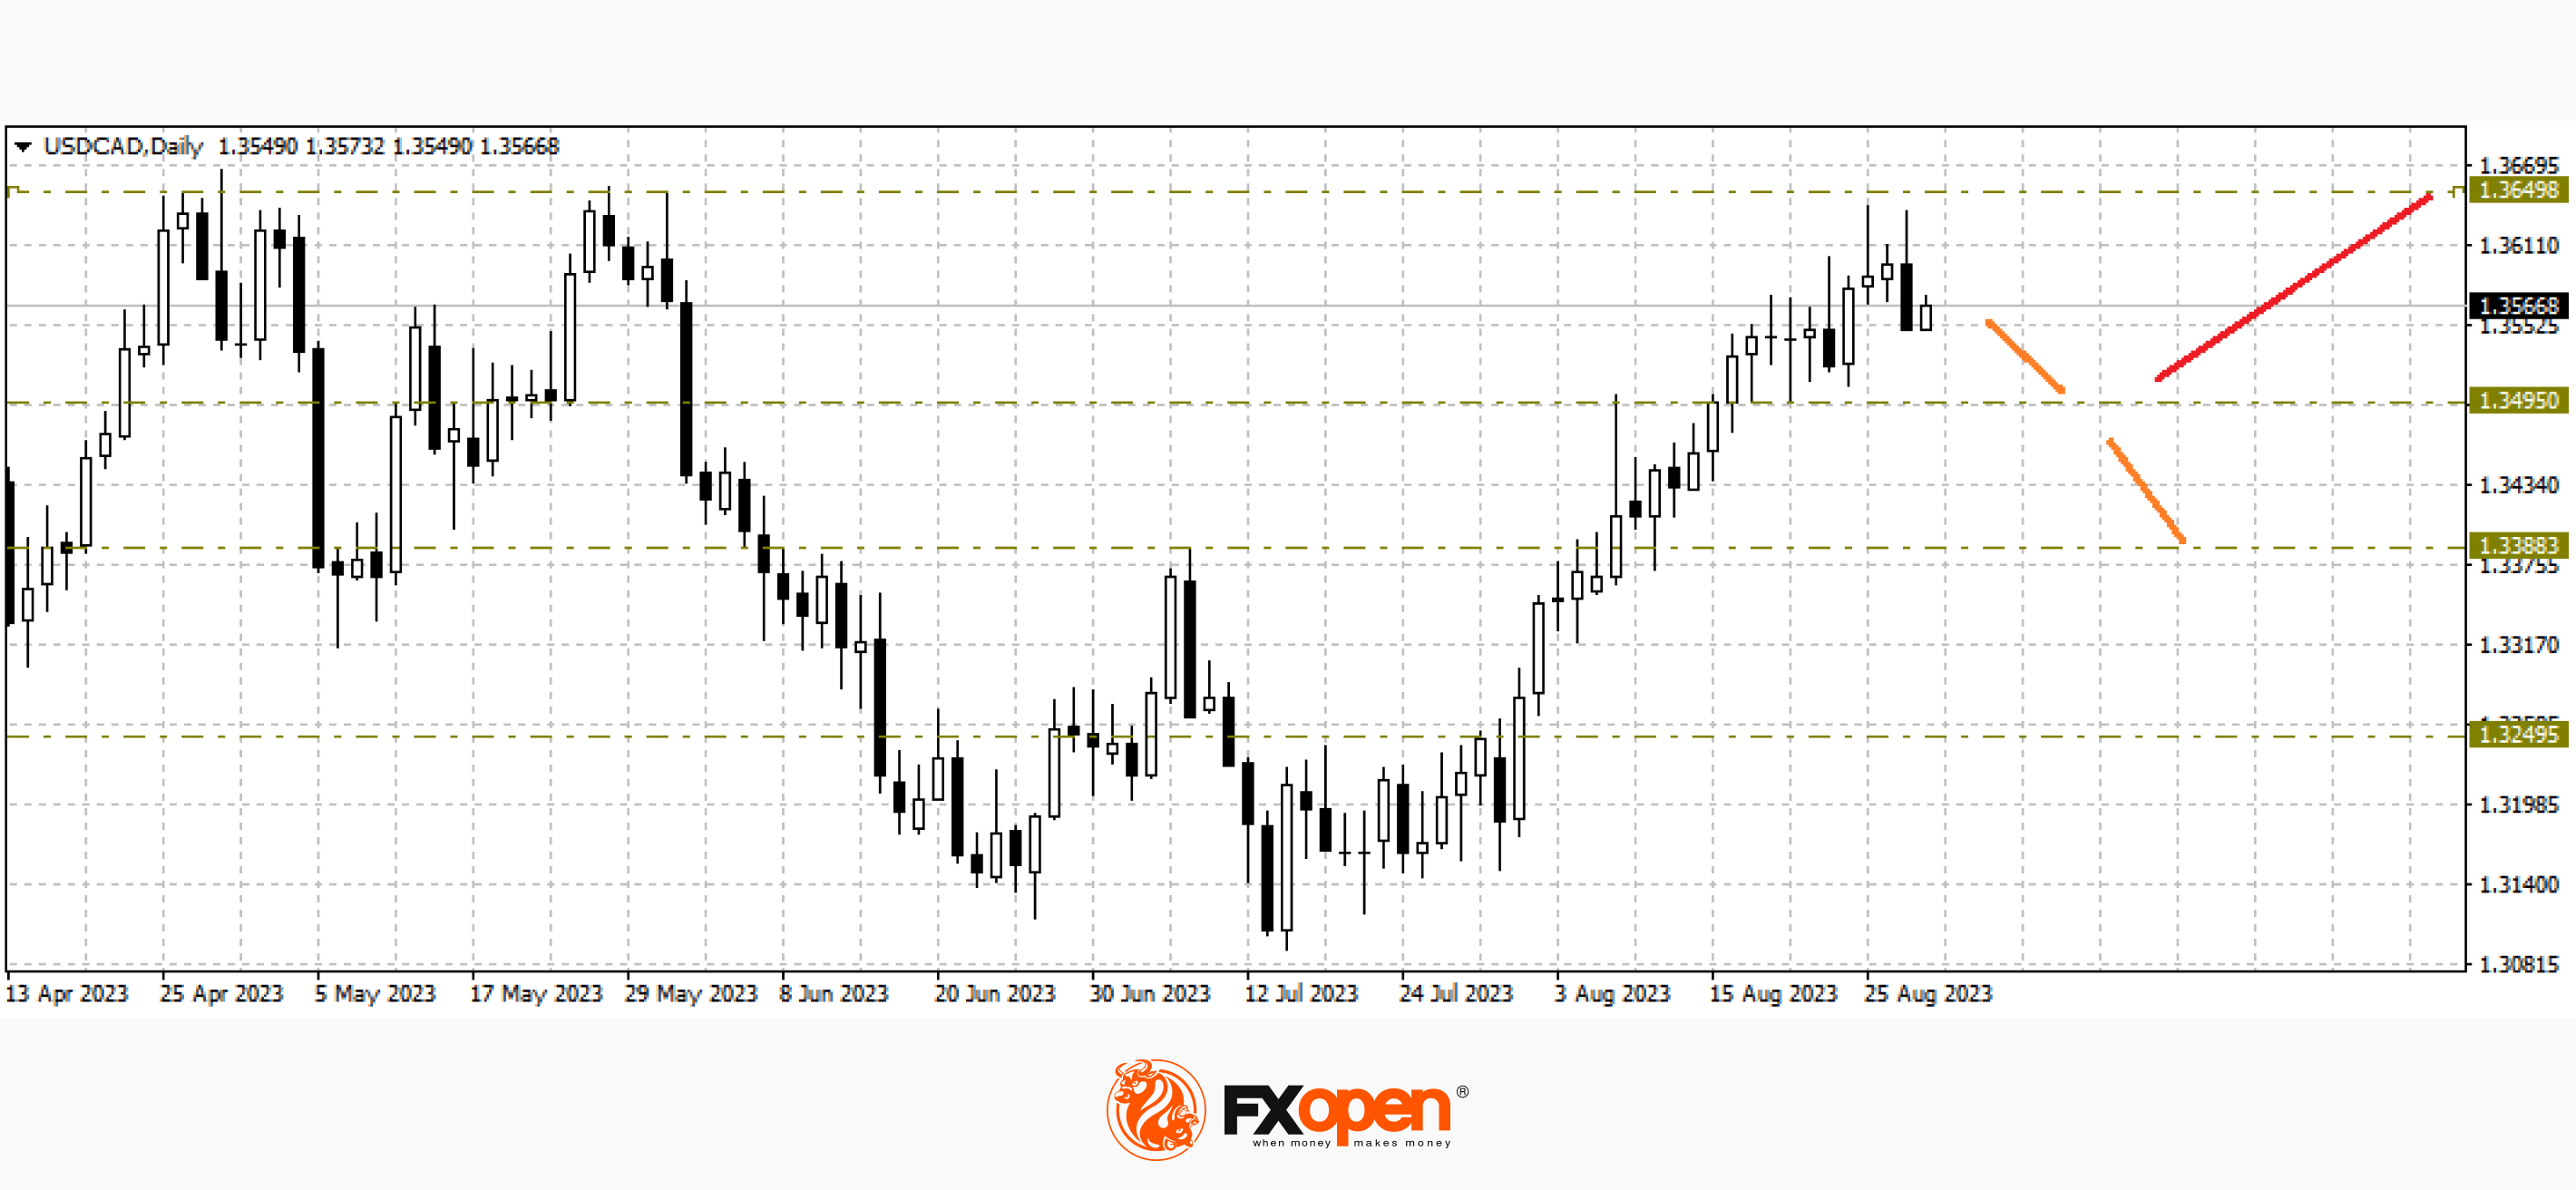
The range 1.3600-1.3650 has been holding back the onslaught of greenback buyers for several months now. The price tested it in April-May of the current year and failed to pass on the first attempt in August. On the daily timeframe, according to candlestick analysis, we observe a bearish engulfing combination, but so far, without confirmation. If today's daily candle is also bearish, a longer-term downward correction to 1.3380-1.3200 may happen. Cancellation of the downward scenario will be a confident rise above 1.3660.
Today at 18:00 GMT+3, we are waiting for weekly data on US crude oil inventories.
EUR/USD
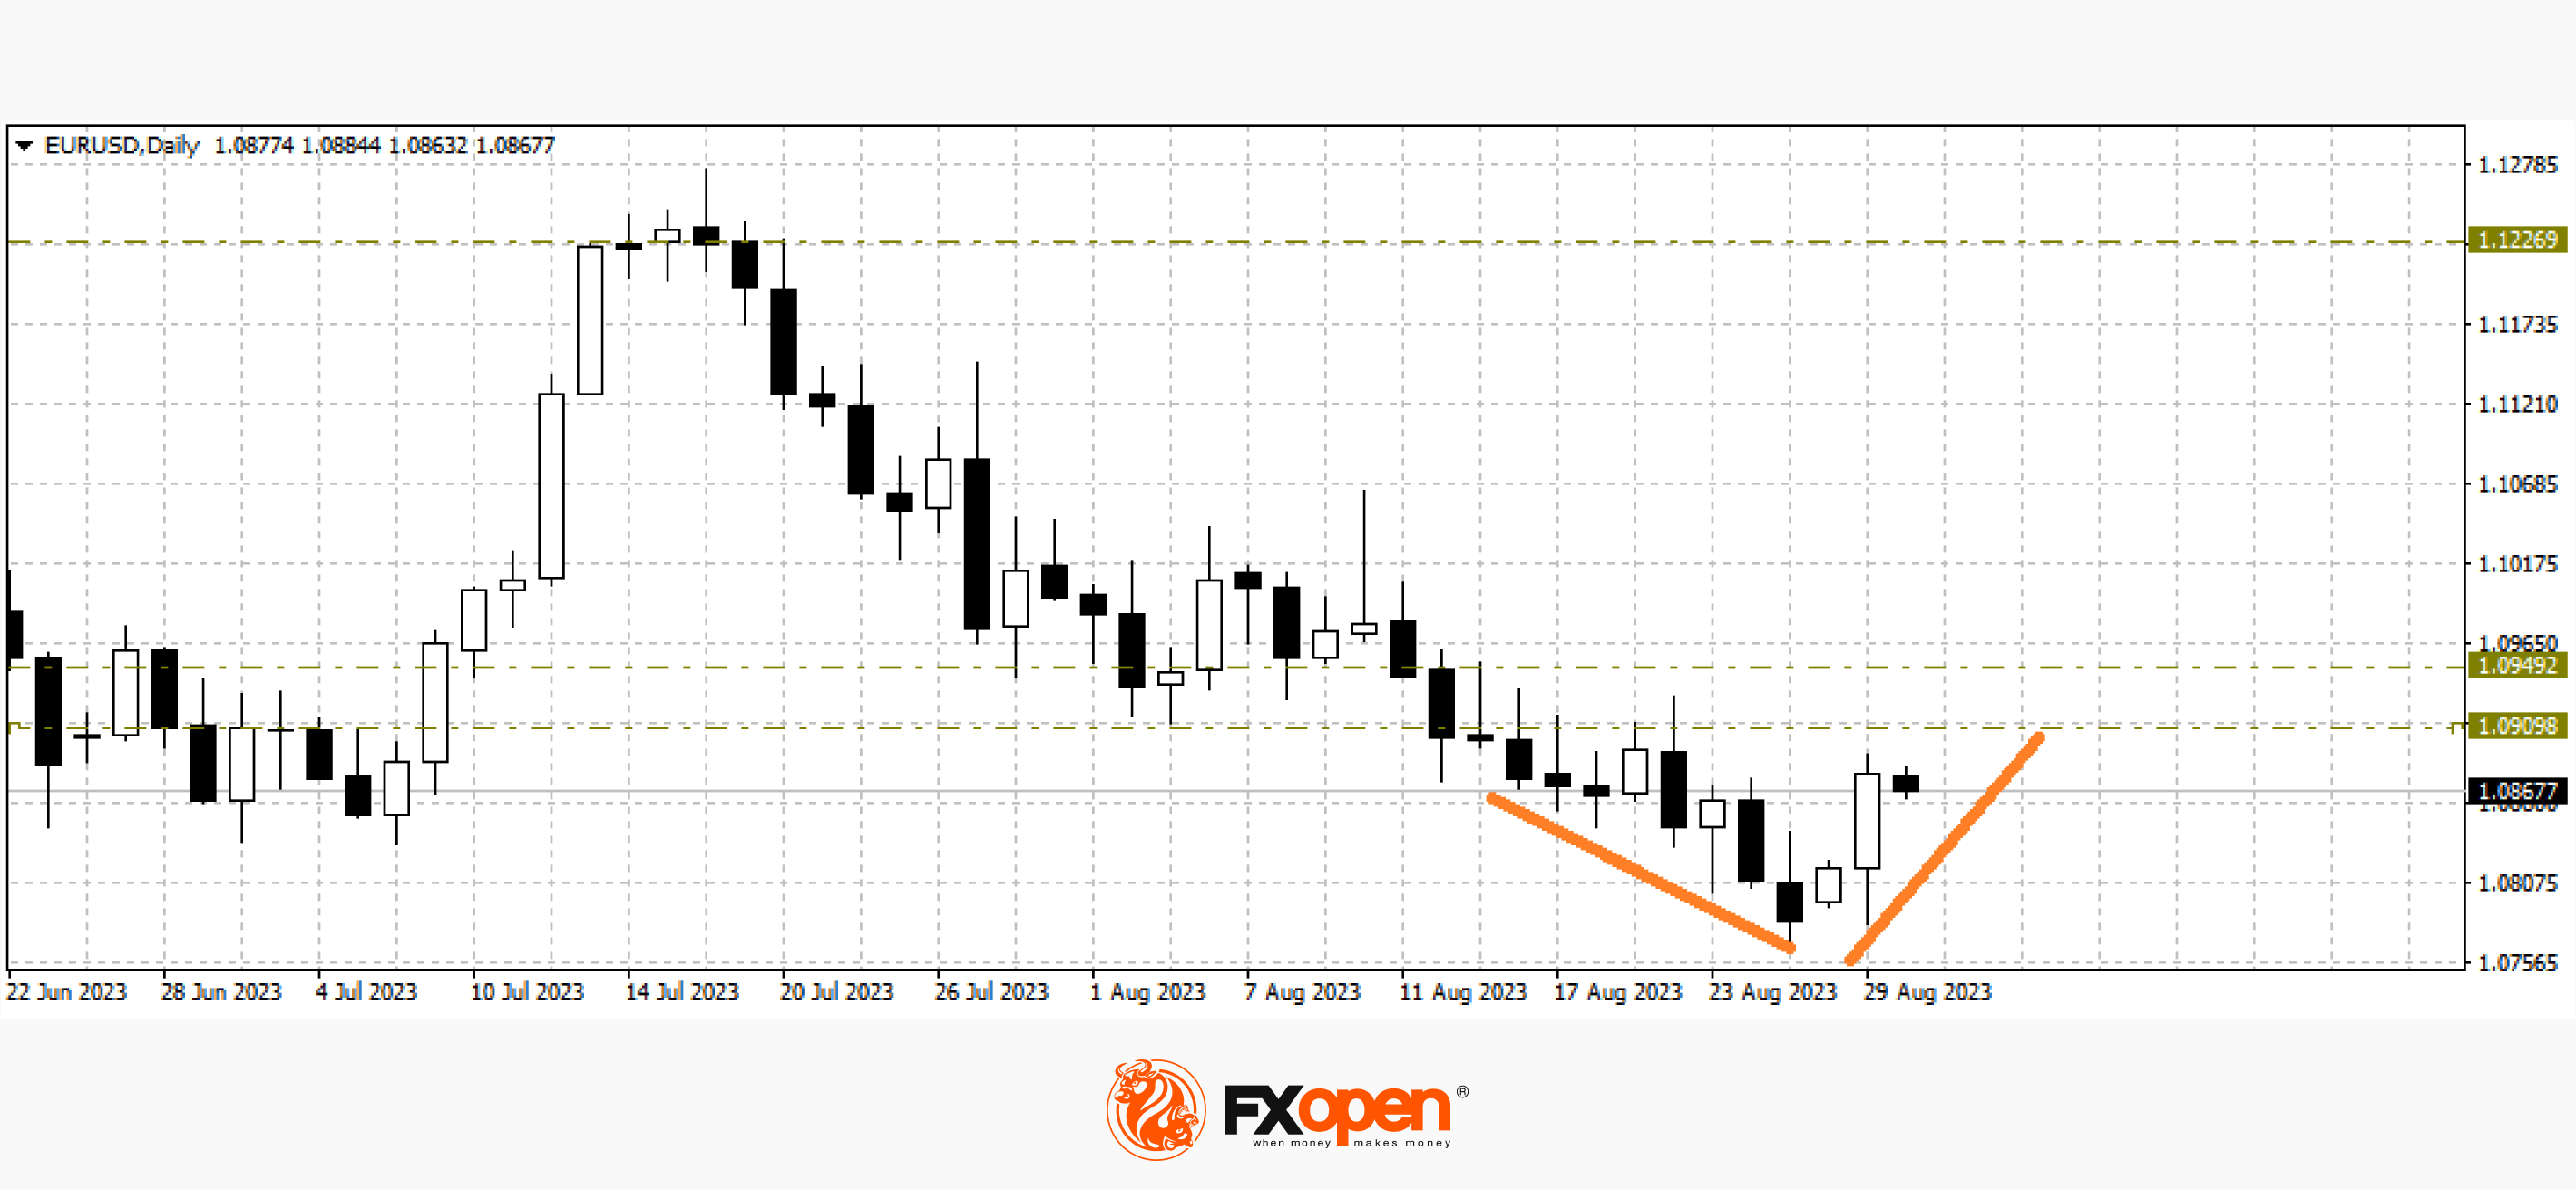
The buyers of the single European currency still managed to keep the important level of 1.0800 as a support. In the daily timeframe, we are seeing the emergence of a v-shaped reversal pattern. If buyers manage to strengthen above 1.0900-1.0950 in the coming trading sessions, a resumption of growth to the extremes of the current year at 1.1200 may occur. The pair may decline significantly after falling below 1.0750.
Today is an important day for the European currency. At 15:00 GMT+3, the Consumer Price Index (CPI) in Germany for the same period will be released.
Trade over 50 forex markets 24 hours a day with FXOpen. Take advantage of low commissions, deep liquidity, and spreads from 0.0 pips (additional fees may apply). Open your FXOpen account now or learn more about trading forex with FXOpen.
This article represents the opinion of the Companies operating under the FXOpen brand only. It is not to be construed as an offer, solicitation, or recommendation with respect to products and services provided by the Companies operating under the FXOpen brand, nor is it to be considered financial advice.
Stay ahead of the market!
Subscribe now to our mailing list and receive the latest market news and insights delivered directly to your inbox.


Latest articles

AI Valuations Are Back in the Spotlight
Artificial intelligence remains the dominant investment theme of 2026, but investors are increasingly questioning whether AI stock valuations are keeping pace with reality.
💰 Big Tech continues to invest at an unprecedented scale, with hyperscaler AI spending projected to exceed $800

AUD/CAD: Months of Indecision — Is a Breakout Finally Coming?
The Australian dollar has clawed back most of its end-of-June losses, when it touched three-month lows against the greenback amid escalating Middle East tensions. Since then, sentiment has improved: the RBA's Assistant Governor Sarah Hunter signalled the board stands ready

USD/JPY: Battling at the Top of the Triangle
On 3 July, Japan's Finance Minister, Satsuki Katayama, stated that the Ministry of Finance remains in close contact with US authorities regarding developments in USD/JPY as the yen traded near its weakest level in almost 40 years. Similar verbal