


Market Analysis: The Yen and European Currencies Strengthen Sharply
FXOpen

In the last five-day trading period of the outgoing year, we observed the “pre-New Year’s rally” characteristic of this period in the market. In just a few trading sessions, the euro/US dollar pair has consolidated above 1.1100, the pound/US dollar pair is preparing to test 1.2800, and the US dollar/yen pair has fallen below 142.00.
GBP/USD
On the GBP/USD chart, buyers of the pound this week managed to update the December high and test important resistance at 1.2800. If the current situation continues for several weeks, a test of the psychological level of 1.3000 and continued growth towards the July highs at 1.3150 are possible.
Today at 16:30 GMT+3, weekly data on the number of applications for unemployment benefits in the United States will be released. Tomorrow at 10:00 GMT+3, the UK house price index for December will be published.
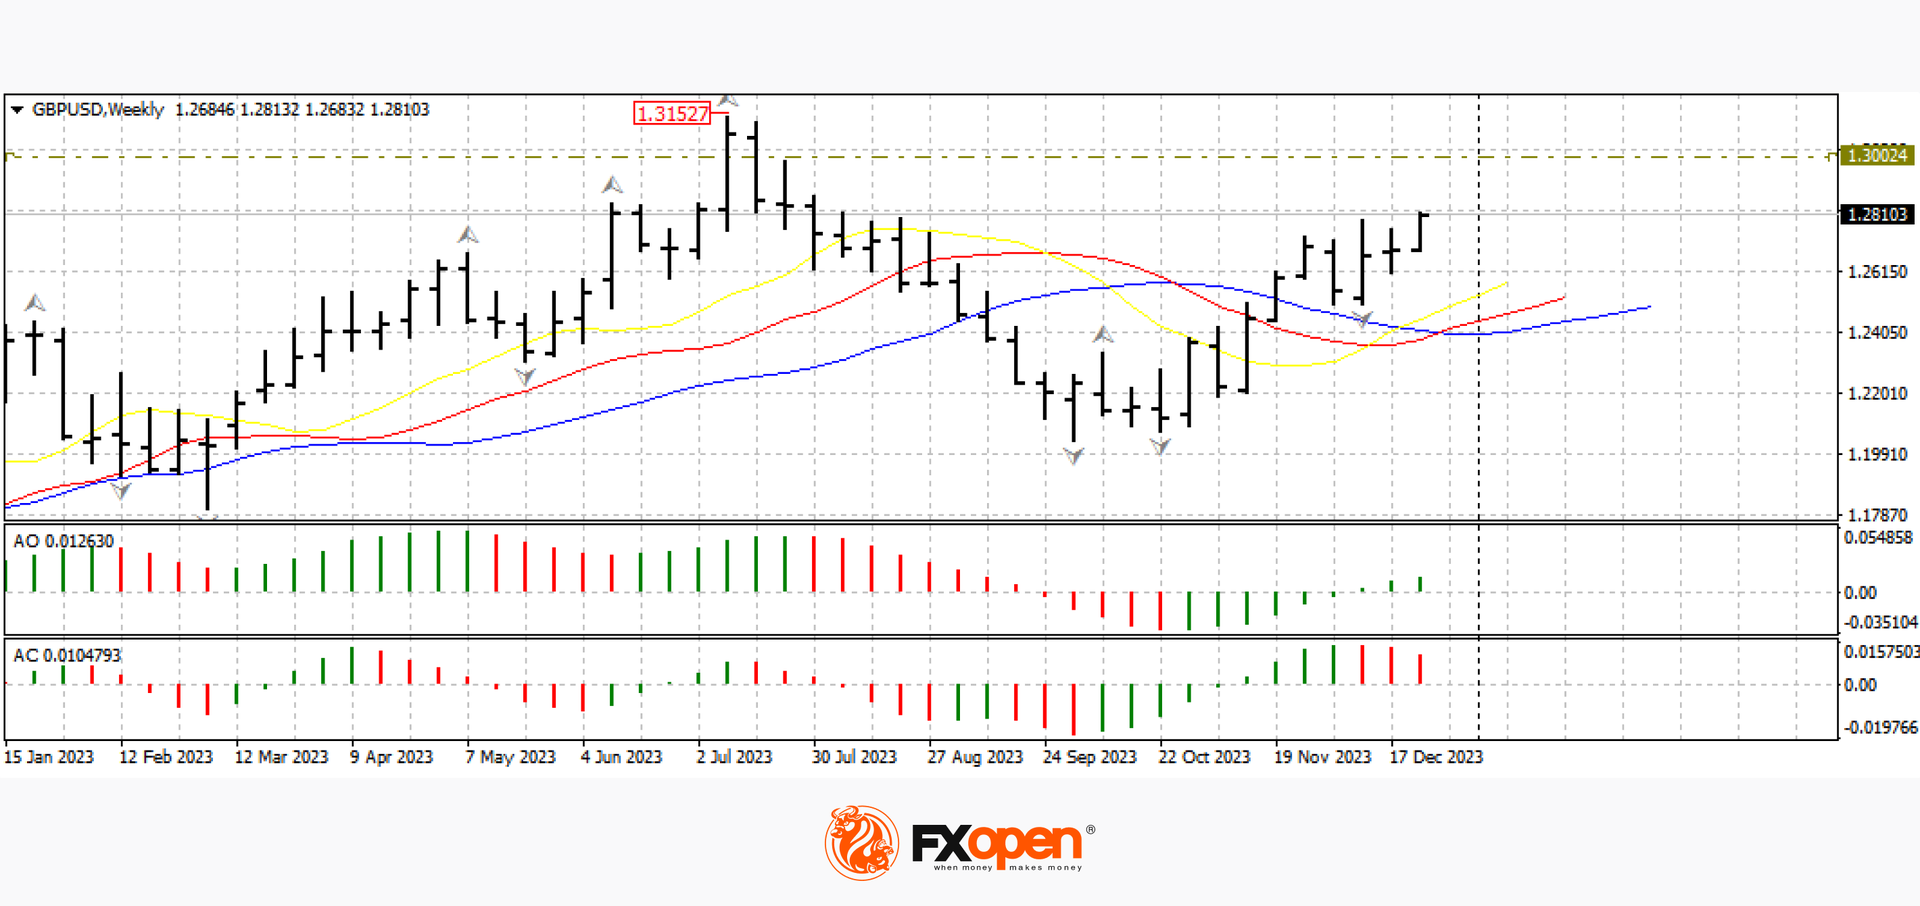
On daily and weekly time frames, the price is above the alligator lines, the AO oscillator is green, which indicates growth on the breakout of the upper fractal. We can consider a reversal of the upward scenario if it confidently consolidates below 1.2600.
EUR/USD
According to EUR/USD technical analysis, the single European currency not only confidently strengthened above the psychological level of 1.1000, but also tested 1.1120. If investors remain in a buying mood for the euro, the price may update the current year’s maximum at 1.1270.
From the point of view of fundamental analysis, tomorrow at 11:00 GMT+3, we are waiting for the publication of data on the harmonised consumer price index in Spain. Also, at 15:10 GMT+3, it is worth paying attention to the speech of the representative of the Bundesbank Burkhard Balz.
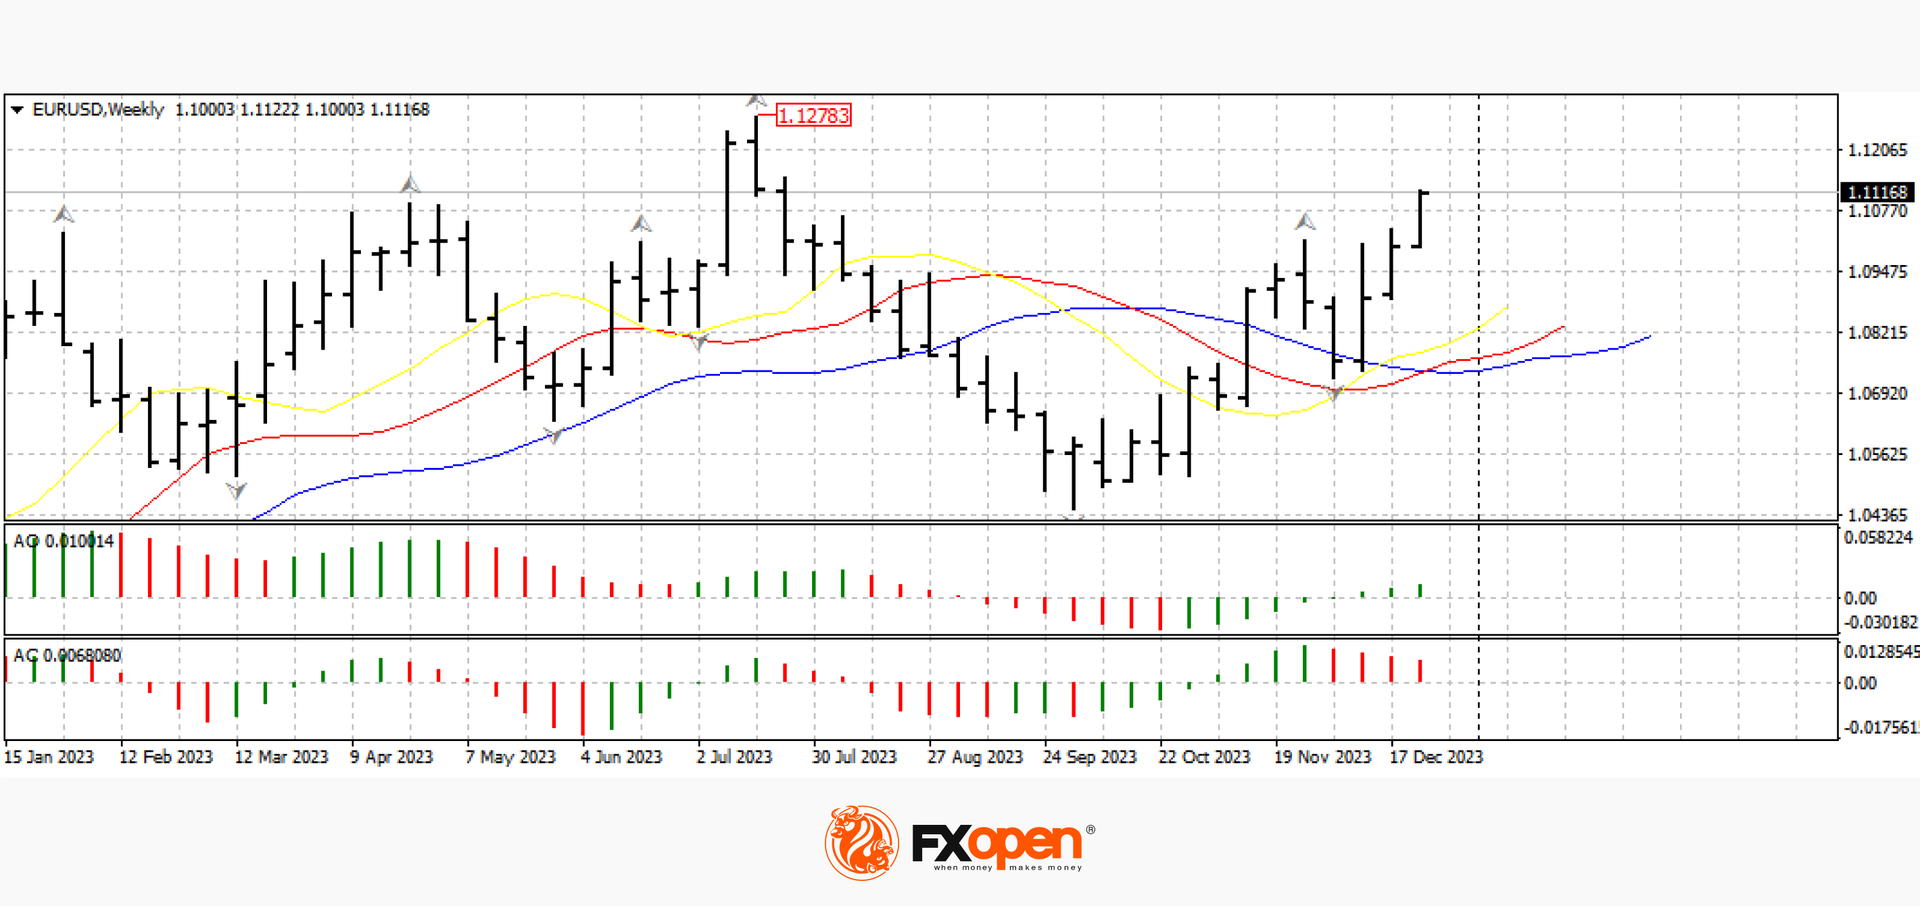
On the weekly timeframe, the price is above the alligator lines, the AO oscillator is green and above zero, which may signal further strengthening of the pair.
USD/JPY
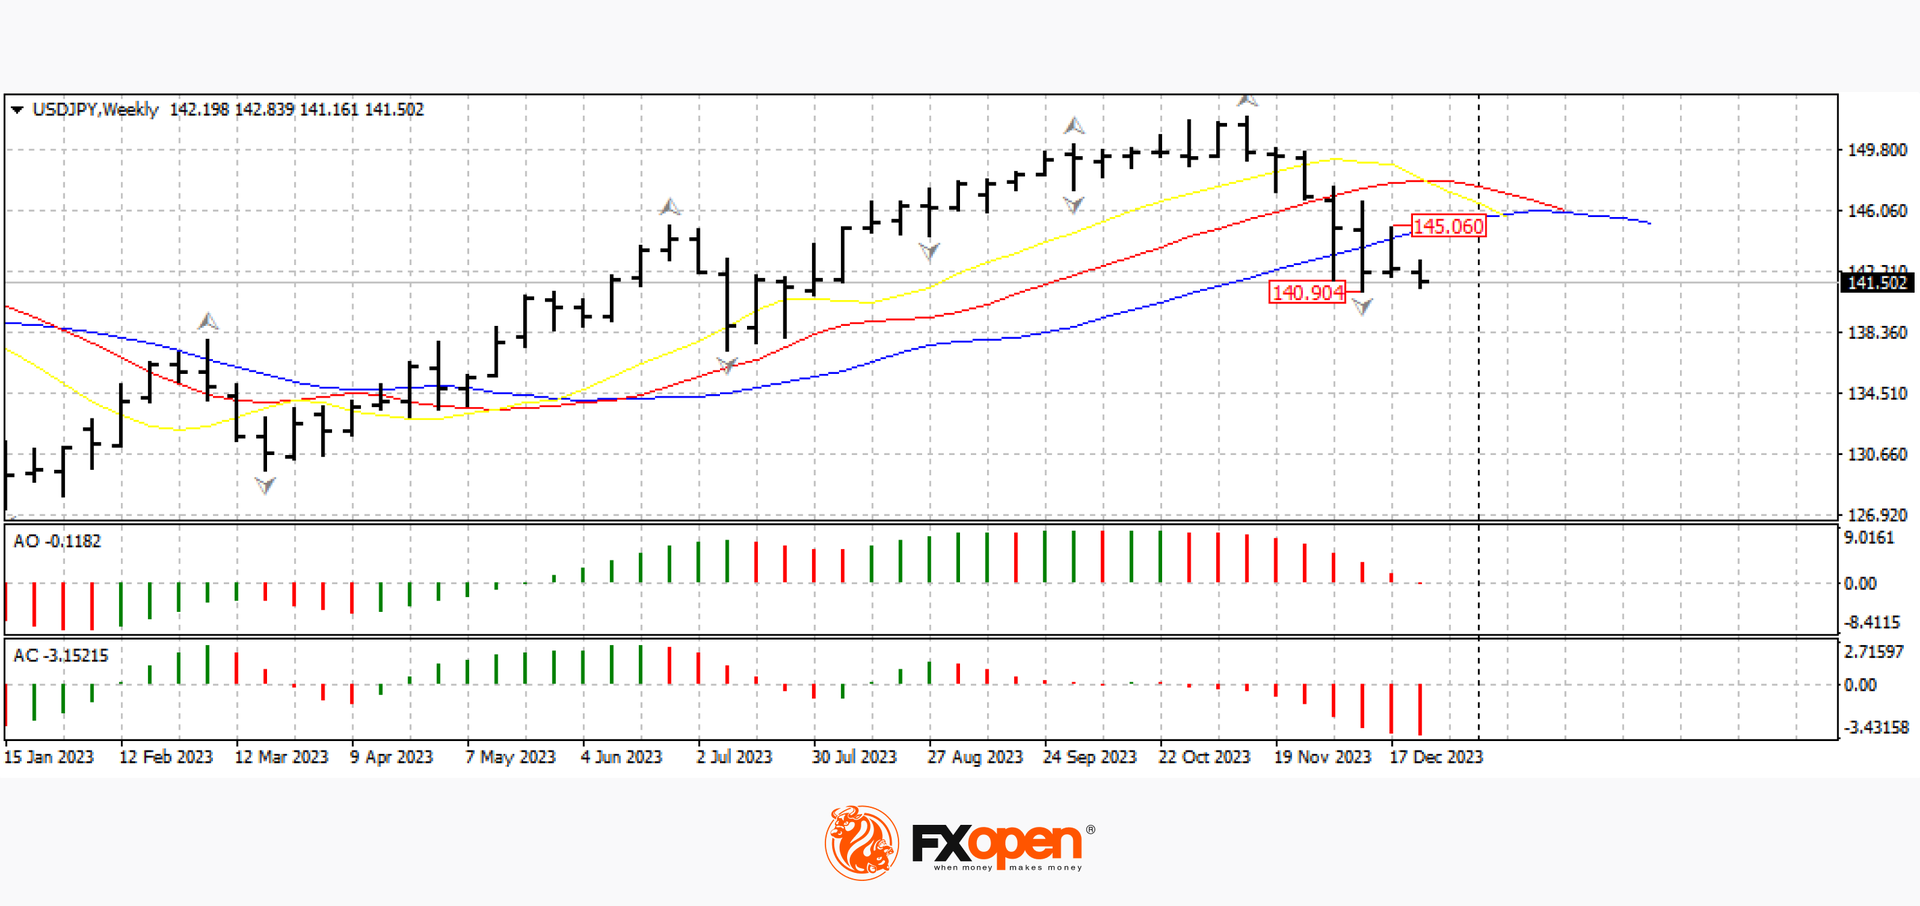
Investors' expectations about a change in the vector of the Fed's monetary policy are pushing the US dollar/yen pair lower and lower. Last week, on the USD/JPY chart, the price corrected to the 145 figure, but failed to develop a full-fledged upward movement. Yesterday, the pair lost more than 100 pips and is currently trading slightly above 141.00. If the downward movement continues, a breakdown of the recent low at 140.90 is quite possible.
Today at 18:00 GMT+3, it is worth paying attention to the publication of data on the index of pending sales in the US real estate market for November.
This article represents the opinion of the Companies operating under the FXOpen brand only. It is not to be construed as an offer, solicitation, or recommendation with respect to products and services provided by the Companies operating under the FXOpen brand, nor is it to be considered financial advice.
Stay ahead of the market!
Subscribe now to our mailing list and receive the latest market news and insights delivered directly to your inbox.

Latest articles

US Dollar Strengthens Amid Equity Market Weakness and Hawkish Fed Rhetoric
The US dollar continues to hold firm near multi-year highs as sentiment across equity markets deteriorates and investors increasingly expect the Federal Reserve to maintain a restrictive monetary policy stance for longer. The US economy remains resilient, while inflation risks

Bitcoin: Corrective Channel Broken as Traders Turn More Active
Bitcoin has come under the influence of several factors simultaneously. The wave of selling at the beginning of June was linked to Strategy's first disclosed Bitcoin sale in several years, a prolonged series of outflows from spot ETFs, and a

DAX 40: consolidation amid technology sell-off
A wave of selling in the technology sector that emerged earlier this week has weighed on European equities. The trigger was investor concern over the profitability of large-scale debt-funded investments by major US tech companies in AI infrastructure. The Nasdaq