FXOpen

The US dollar fell after data showed the world's largest economy created fewer jobs than expected last month, raising expectations that the Federal Reserve is likely to keep interest rates steady again at its December meeting. Nonfarm payrolls increased by 150,000 jobs last month, the data showed. Figures for September were revised down to show 297,000 jobs created instead of 336,000 as previously reported. The US dollar index, a measure of the greenback's exchange rate against six major currencies, fell 0.8% to 105.29. Investors also paid attention to the decline in business activity: the indicator in the services sector from S&P Global in October adjusted from 50.9 points to 50.6 points, while analysts did not expect changes, and the index from the Institute for Supply Management (ISM) — from 53. 6 points to 51.8 points, which also turned out to be worse than the expected 53.0 points.
EUR/USD
The EUR/USD pair is showing slight growth, developing the bullish momentum formed at the end of last week. The instrument is testing the 1.0735 mark for an upward breakout, updating local highs from September 14. The immediate resistance can be seen at 1.0758, a breakout to the upside could trigger a rise towards 1.0798. On the downside, immediate support is seen at 1.0703, a break below could take the pair towards 1.0596.
Investors are focusing on the October US labour market report, published on Friday. In turn, export volumes from Germany lost 2.4% in September after growing by 0.1% in the previous month, while experts expected -1.1%, and imports fell by 1.7% after -0 .3% with a forecast of 0.5%. Thus, Germany's trade surplus in September decreased from 17.7 billion euros to 16.5 billion euros, with expectations at 16.3 billion euros.

At the highs of the week, a new ascending channel has formed. Now the price has moved away from the upper border of the channel and may continue to decline.
GBP/USD
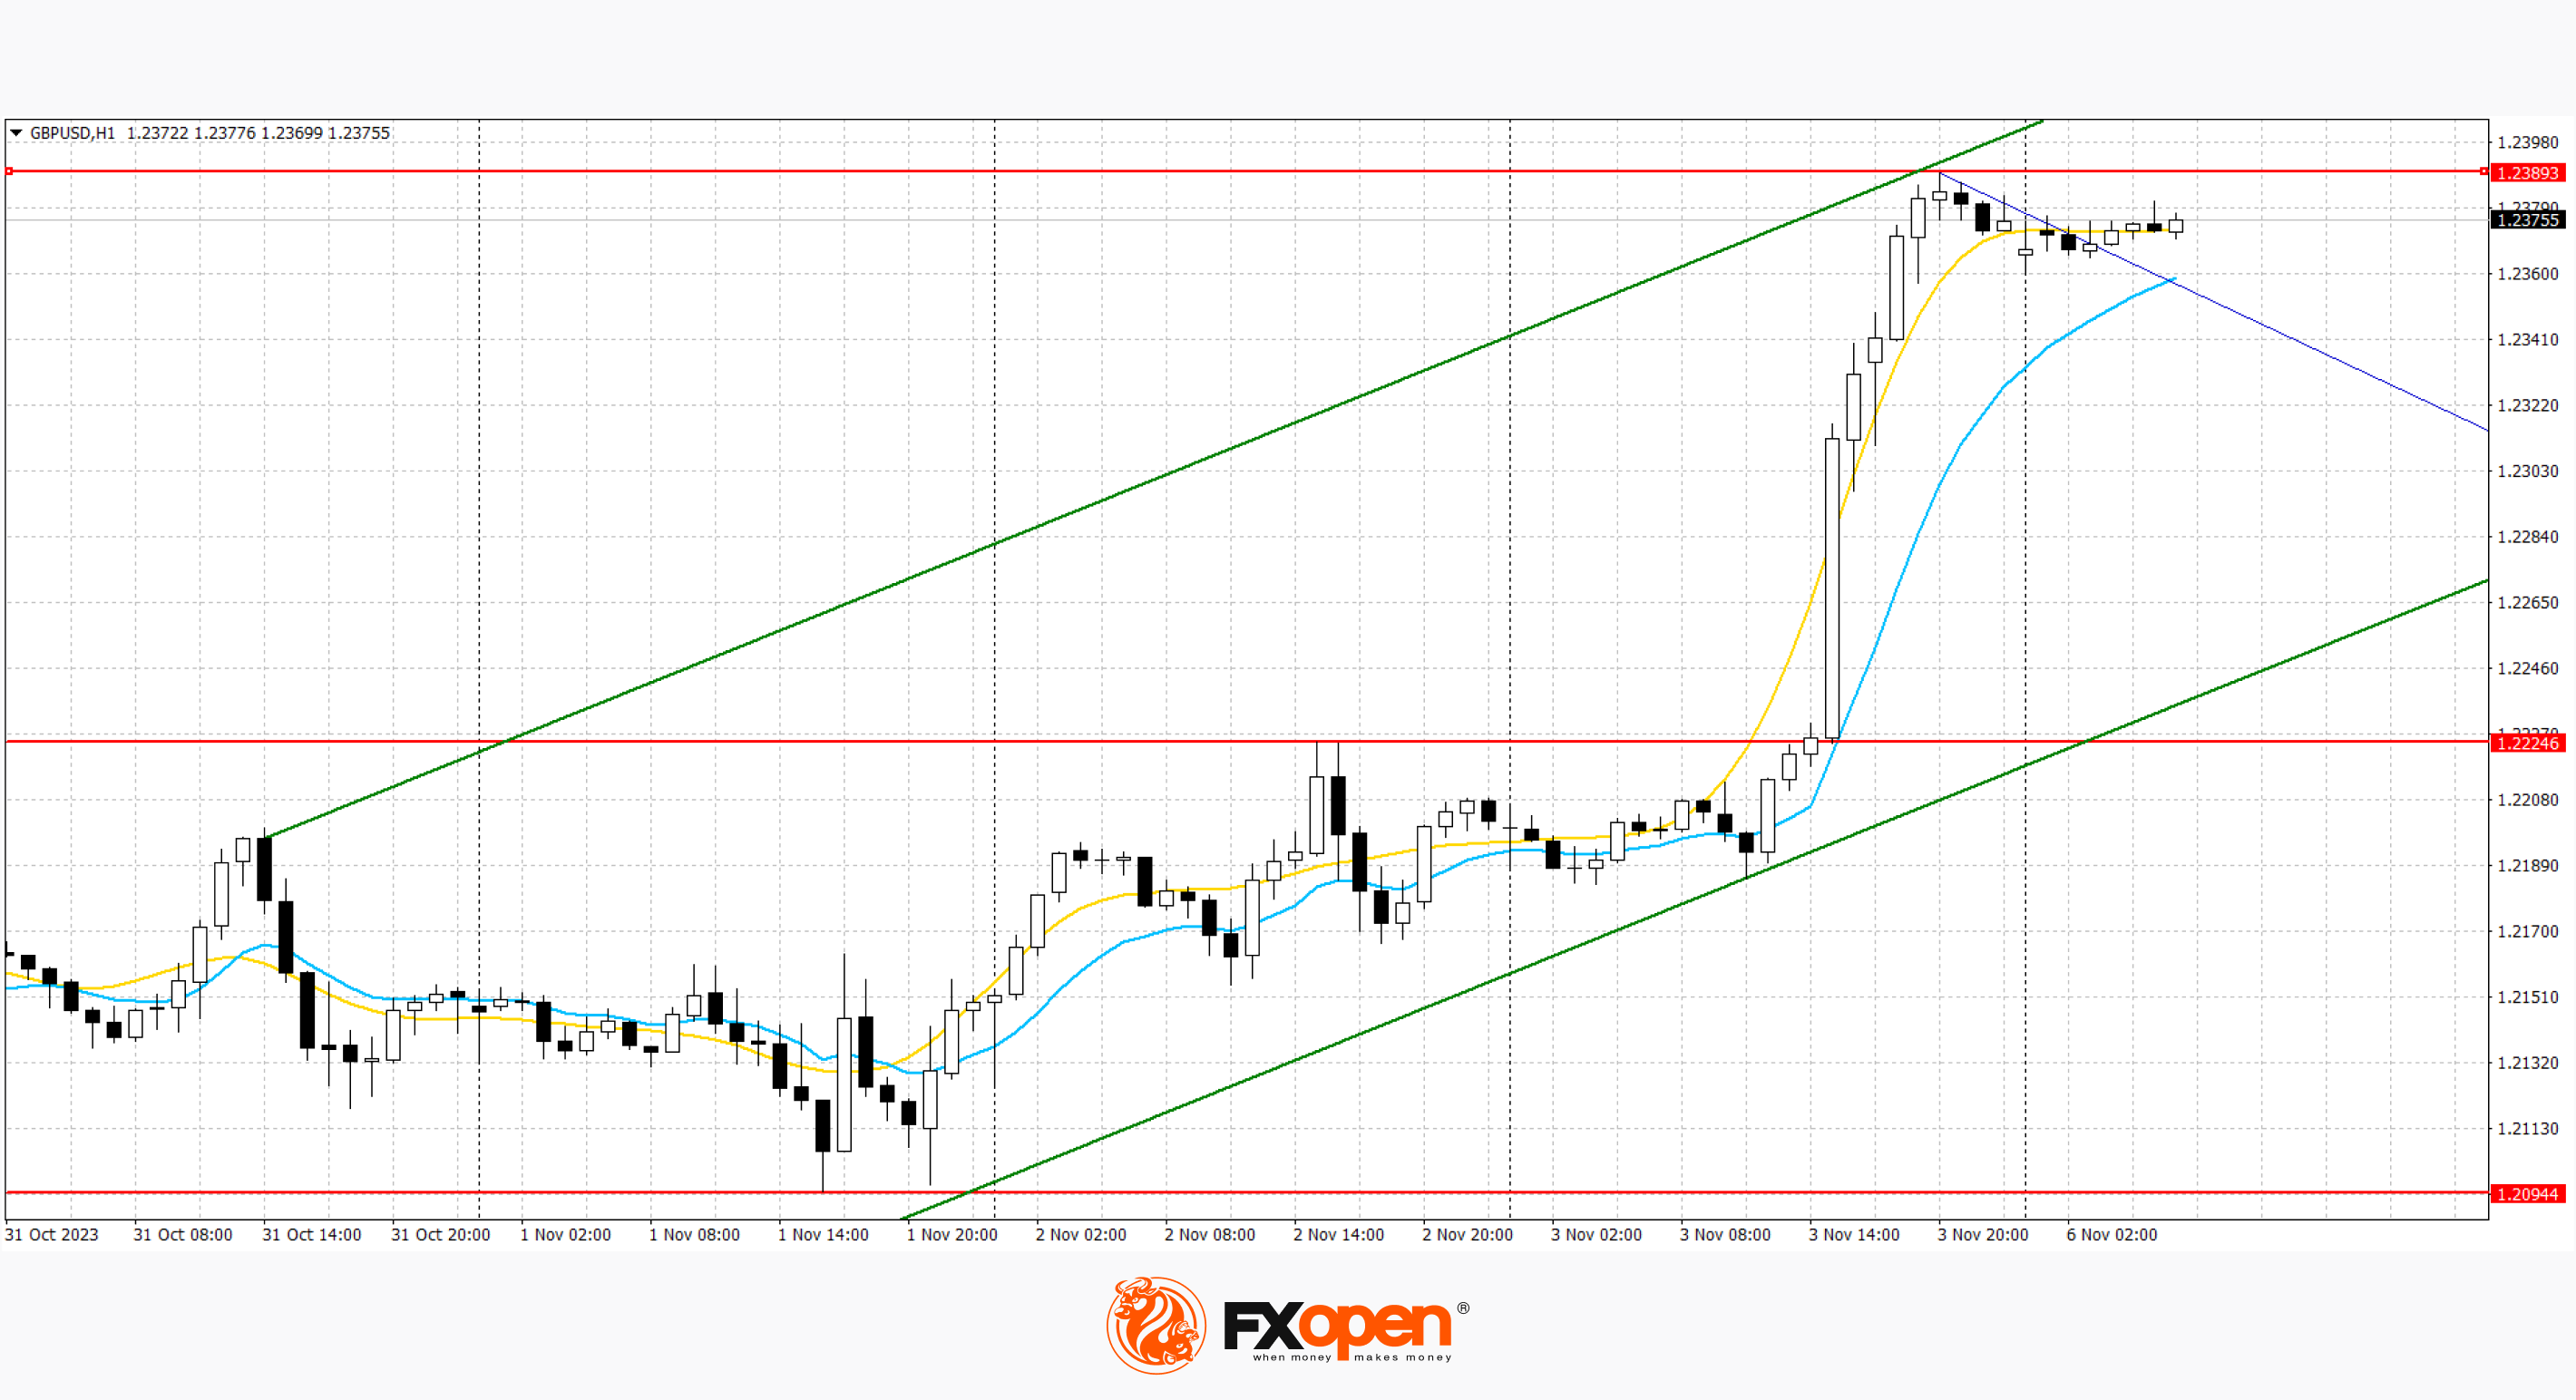
The GBP/USD pair is developing mixed dynamics, consolidating near the local highs of September 20, updated the day before. The instrument is again testing the 1.2370 mark for an upward breakout. %. The nearest resistance can be seen at 1.2230, a breakout to the upside could trigger a rise to 1.2277. In the fall, the nearest support is seen at 1.2192, a break below could take the pair to 1.2165.
The Bank of England last week published updated forecasts according to which the British economy is approaching a recession and will only be able to show near-zero growth in the coming years. This week, investors will be assessing UK gross domestic product (GDP) data for September and the third quarter: forecasts suggest the national economy will contract by 0.1% in the quarter after growing by 0.2% in the previous period, and In annual terms, a slowdown is expected from 0.6% to 0.5.

The ascending channel is maintained. Now the price has moved away from the upper border of the channel and may continue to move towards the lower border.
USD/JPY
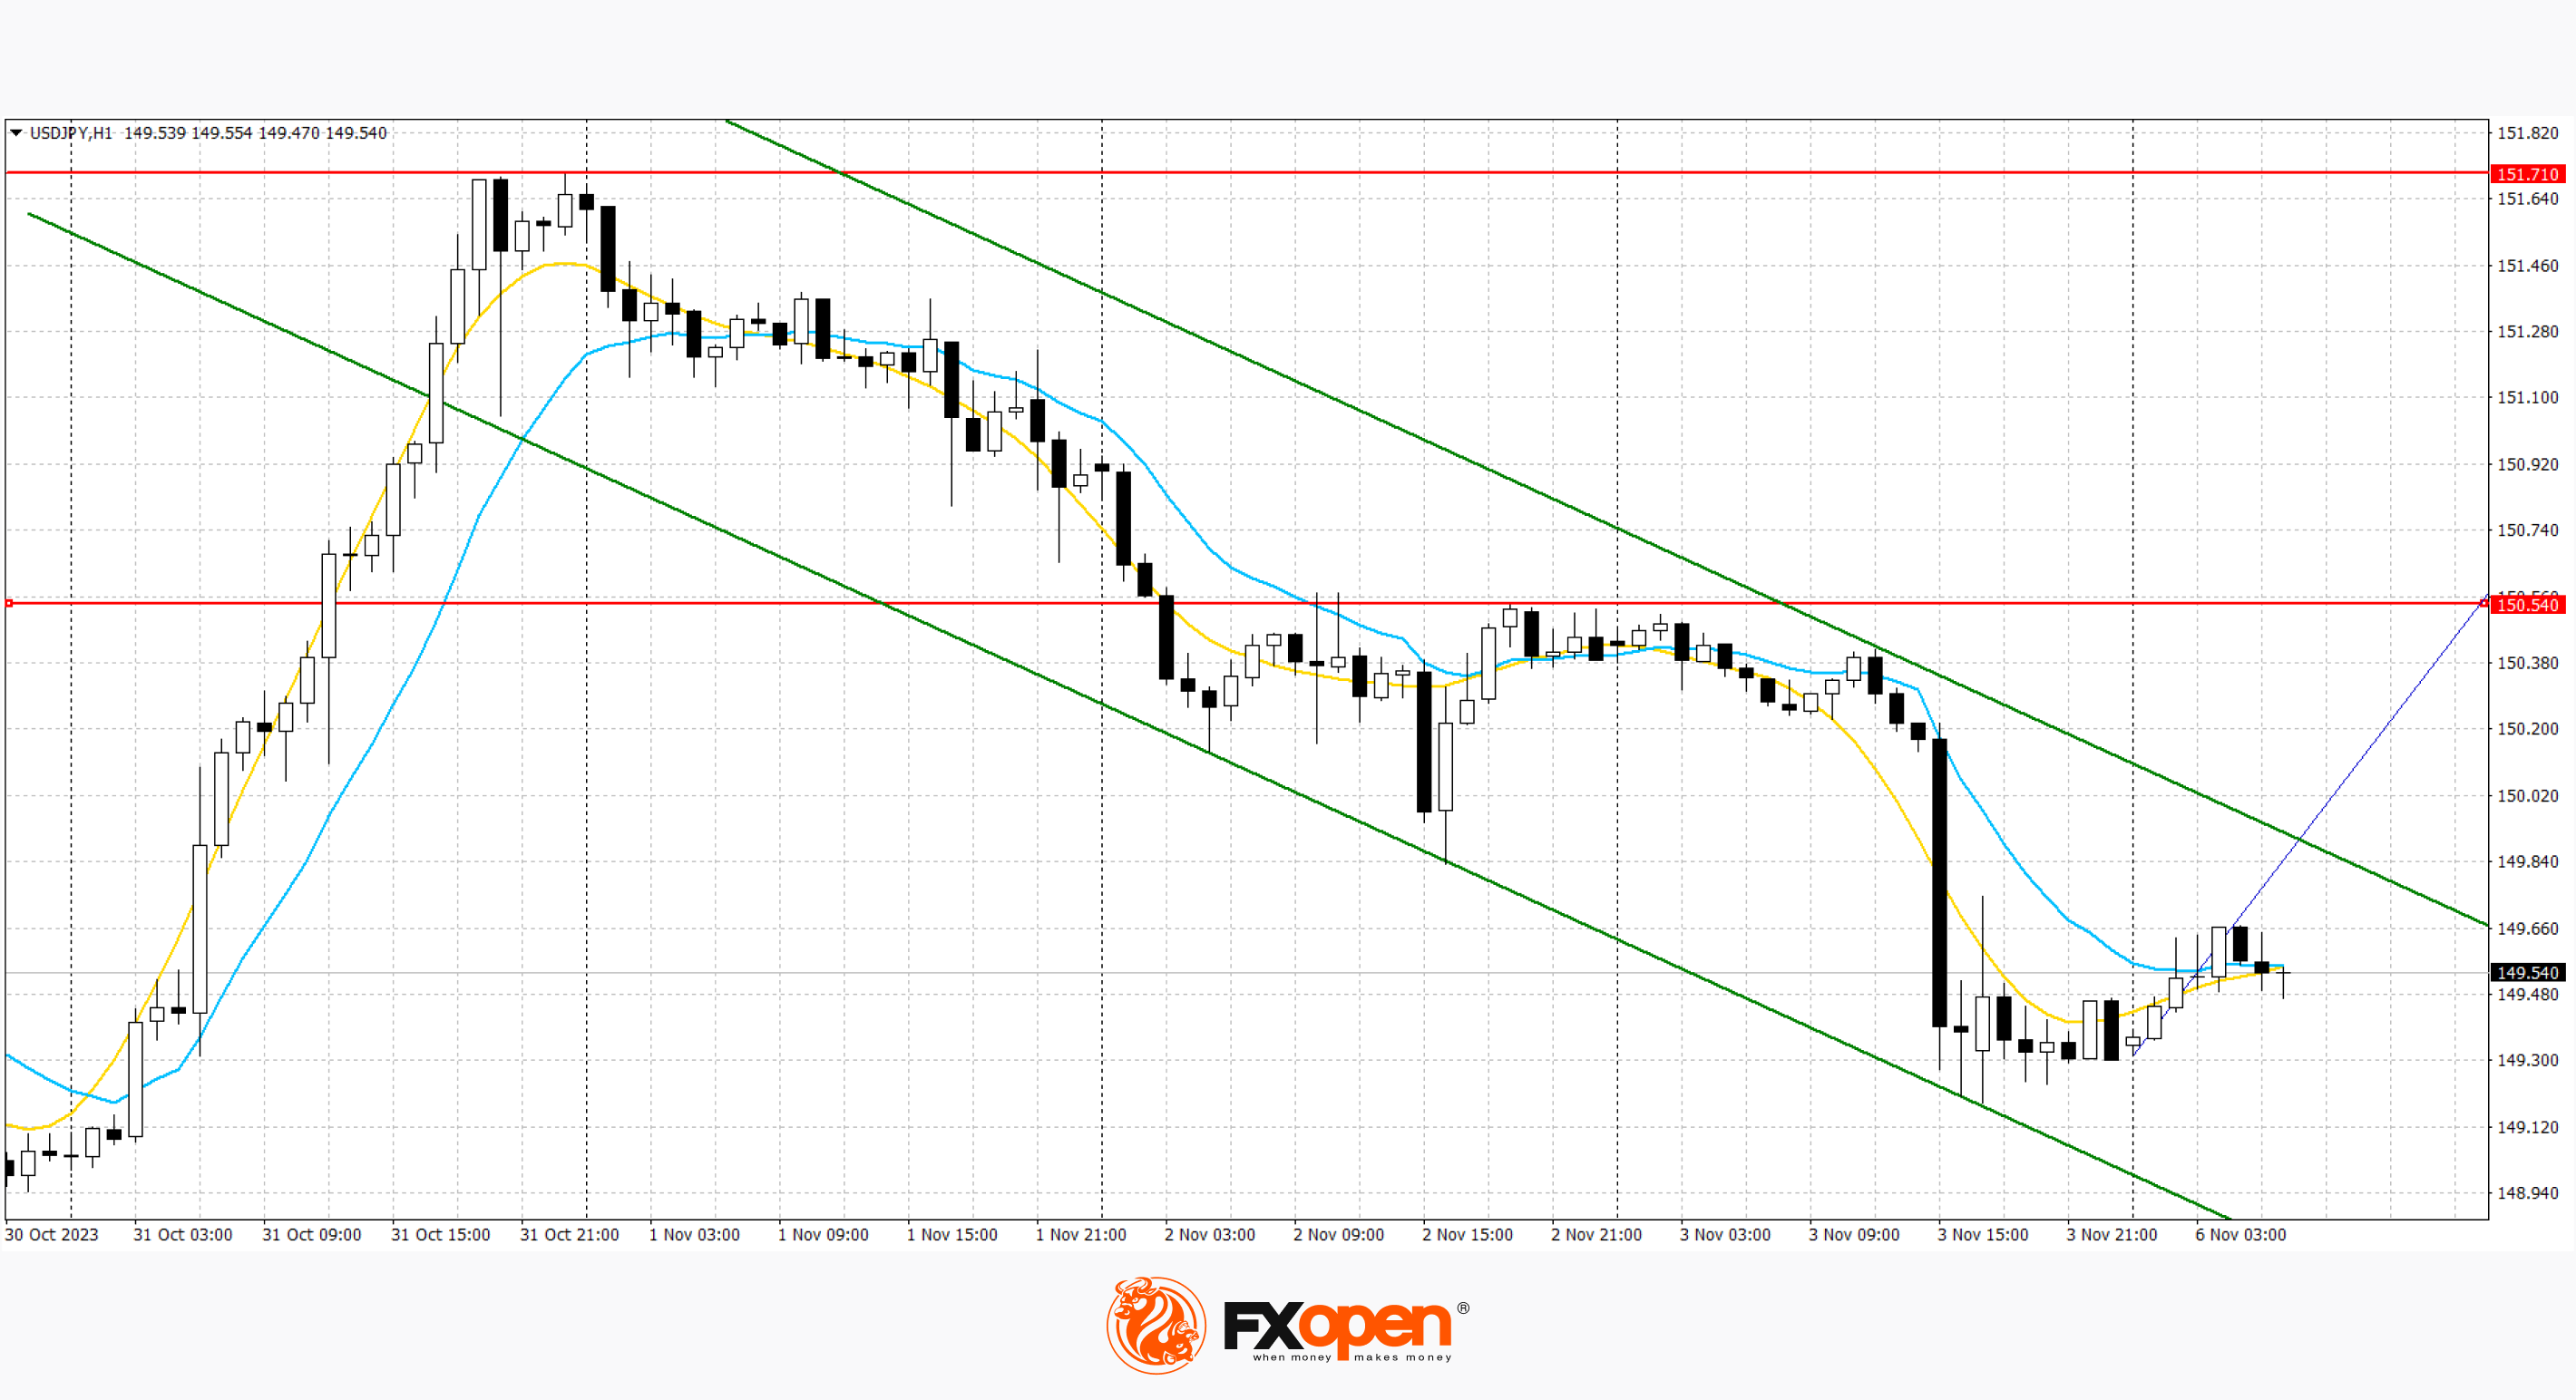
The USD/JPY pair is showing slight growth, correcting after a noticeable decline last week, as a result of which the instrument again dropped below the psychological level of 150.00. Strong resistance can be seen at 150.09, a break higher could trigger a rise towards 150.43. On the downside, immediate support is seen at 150.16. A break below could take the pair towards 148.57.
The yen was slightly supported by optimism from statistics from Japan: the manufacturing business activity index from Jibun Bank rose from 51.1 points to 51.6 points in October, while analysts did not expect any changes. Today, the dynamics of the instrument may be insignificant due to the lack of macroeconomic publications from Japan and the USA.

At the highs of the week, a new downward channel has formed. Now the price is approaching the channel border and may continue to rise if it breaks through.
Trade over 50 forex markets 24 hours a day with FXOpen. Take advantage of low commissions, deep liquidity, and spreads from 0.0 pips. Open your FXOpen account now or learn more about trading forex with FXOpen.
This article represents the opinion of the Companies operating under the FXOpen brand only. It is not to be construed as an offer, solicitation, or recommendation with respect to products and services provided by the Companies operating under the FXOpen brand, nor is it to be considered financial advice.
Stay ahead of the market!
Subscribe now to our mailing list and receive the latest market news and insights delivered directly to your inbox.


