


Market Analysis: Yen and European Currencies Rise Ahead of US Inflation Data
FXOpen

At the beginning of the week, the major currency pairs made attempts to begin a corrective pullback after a strong upward trend in the US dollar. Thus, the euro/US dollar pair found support at 1.0700 and strengthened by more than 50 pp, buyers of the pound/US dollar pair tried to push it above 1.2500, and the US dollar/yen pair opened the week with a downward gap of more than 100 pp. However, the upcoming fundamental data of the current five-day period are so saturated that they can both contribute to the development of corrective rollbacks and continue the main trends at lightning speed.
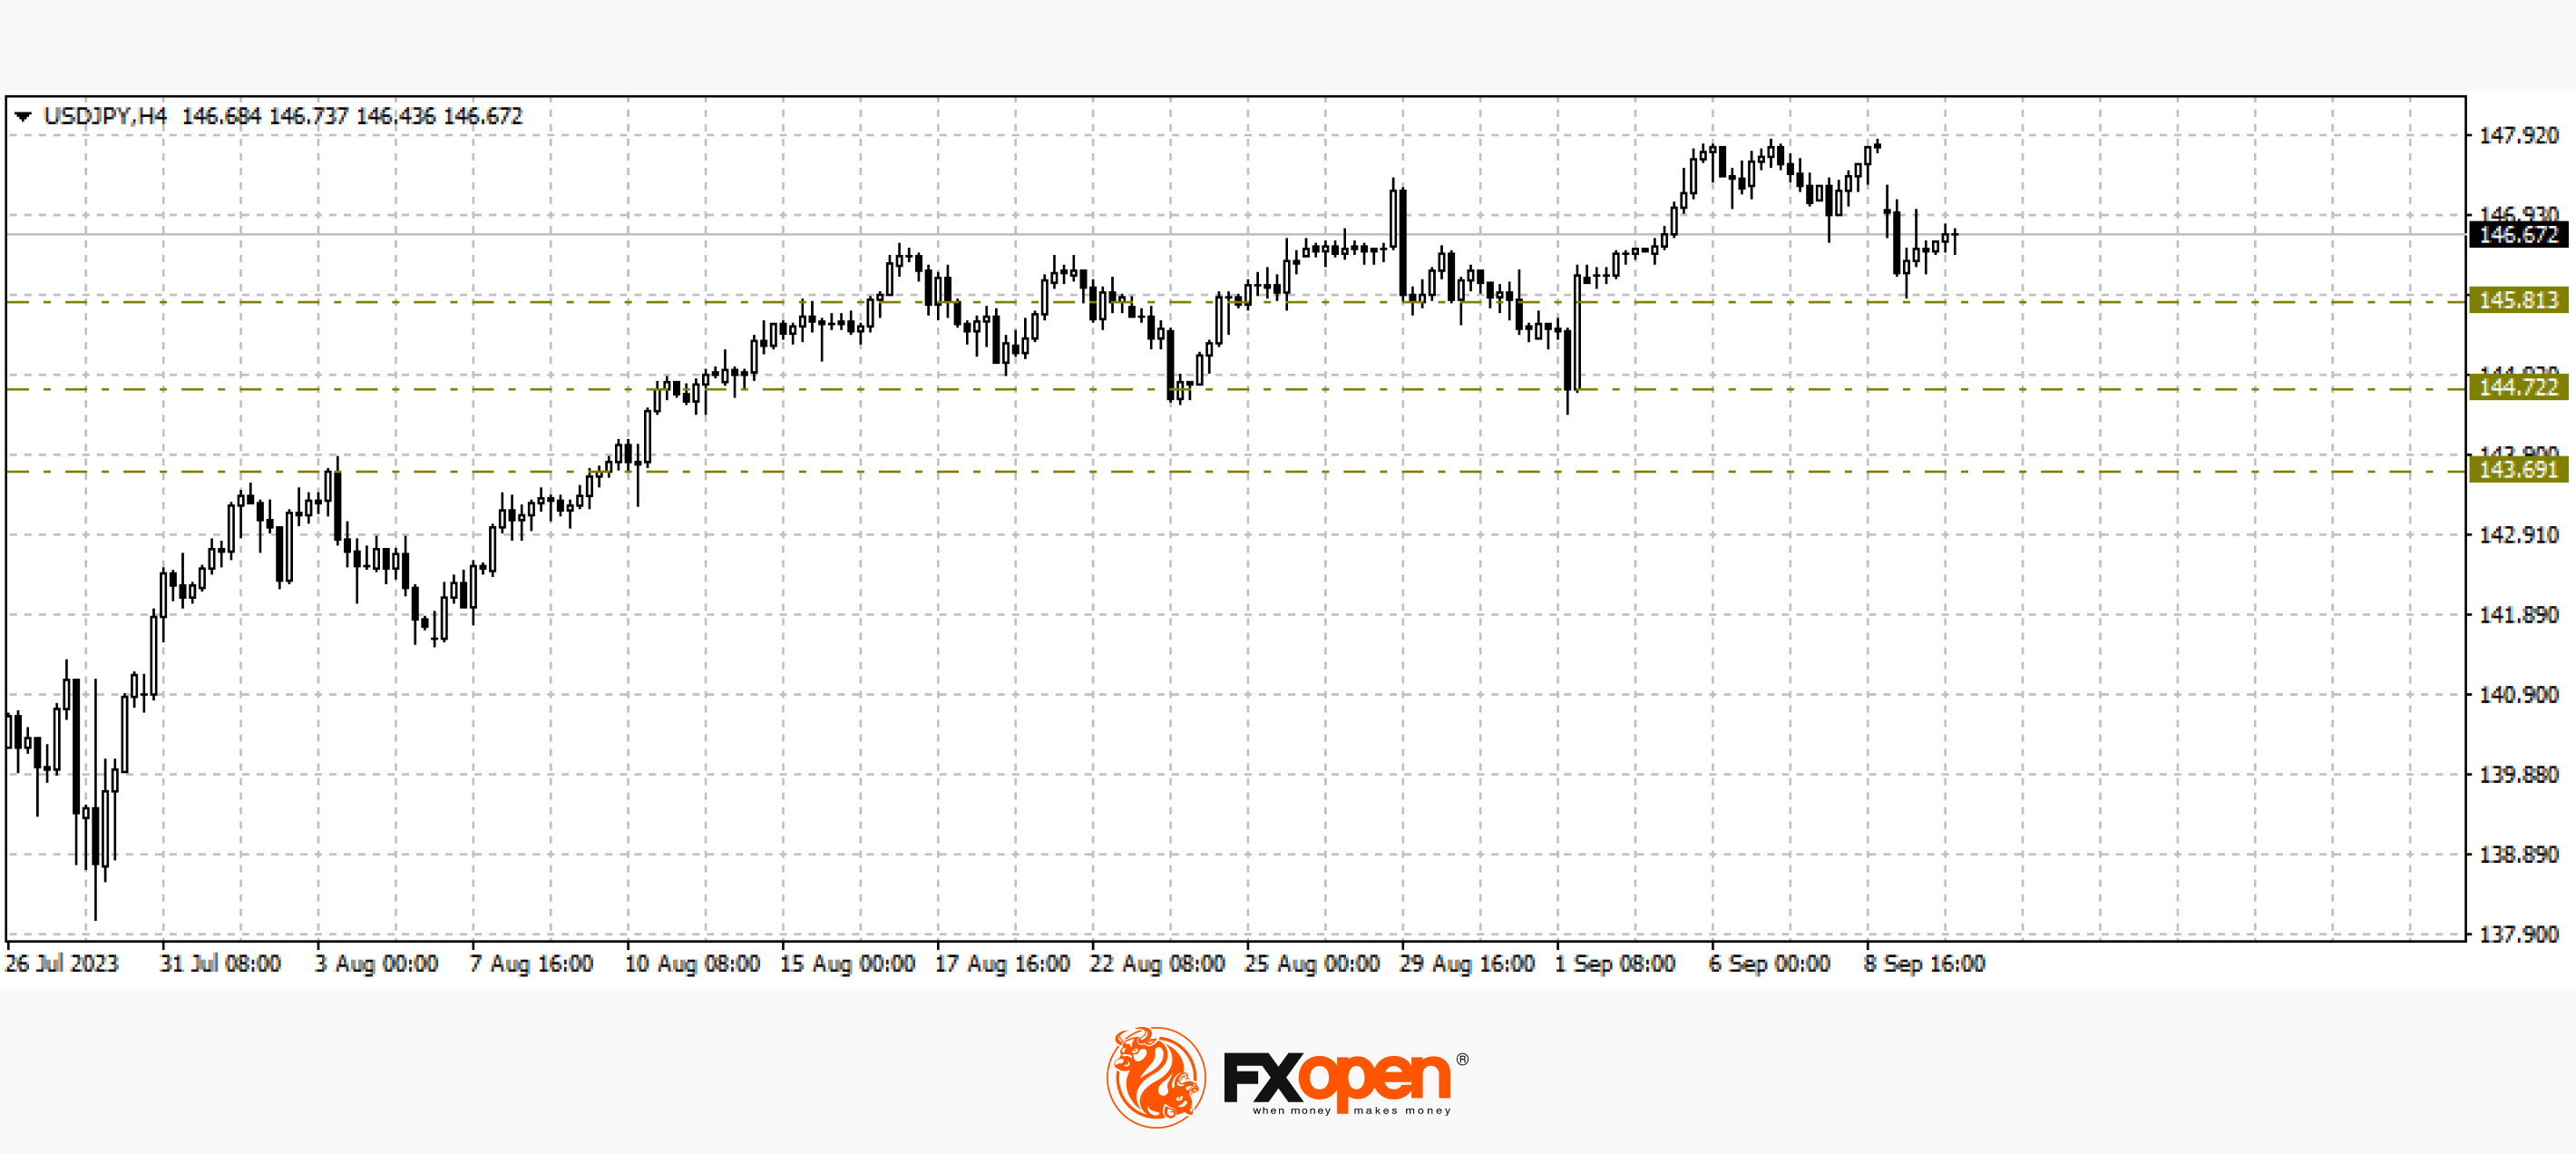
USD/JPY
The sharp growth of the USD/JPY pair last week slowed down slightly near 148, which allowed US dollar sellers to temporarily seize the initiative. The price tested the resistance level of 147.80 three times, and yesterday, the market opened with a downward gap in the direction of 145.80. During the day, the pair corrected after the price gap but is still far from reaching Friday's closing level. The main reason for the sharp decline in the pair is the comments of the head of the Bank of Japan (BOJ), Kazuo Ueda that at the end of this year, the Japanese regulator may end the policy of negative rates. If the situation continues, the USD/JPY pair may decline to 144.70-143.60. At the same time, strong fundamental data from the US may help break the resistance at 148.00 and resume growth in the direction of 150.
Today at 21:00 GMT+3, it is worth paying attention to the publication of a report on the execution of the US federal budget. Tomorrow at 15:30 GMT+3, we are waiting for important data on the consumer price index in the United States for August.
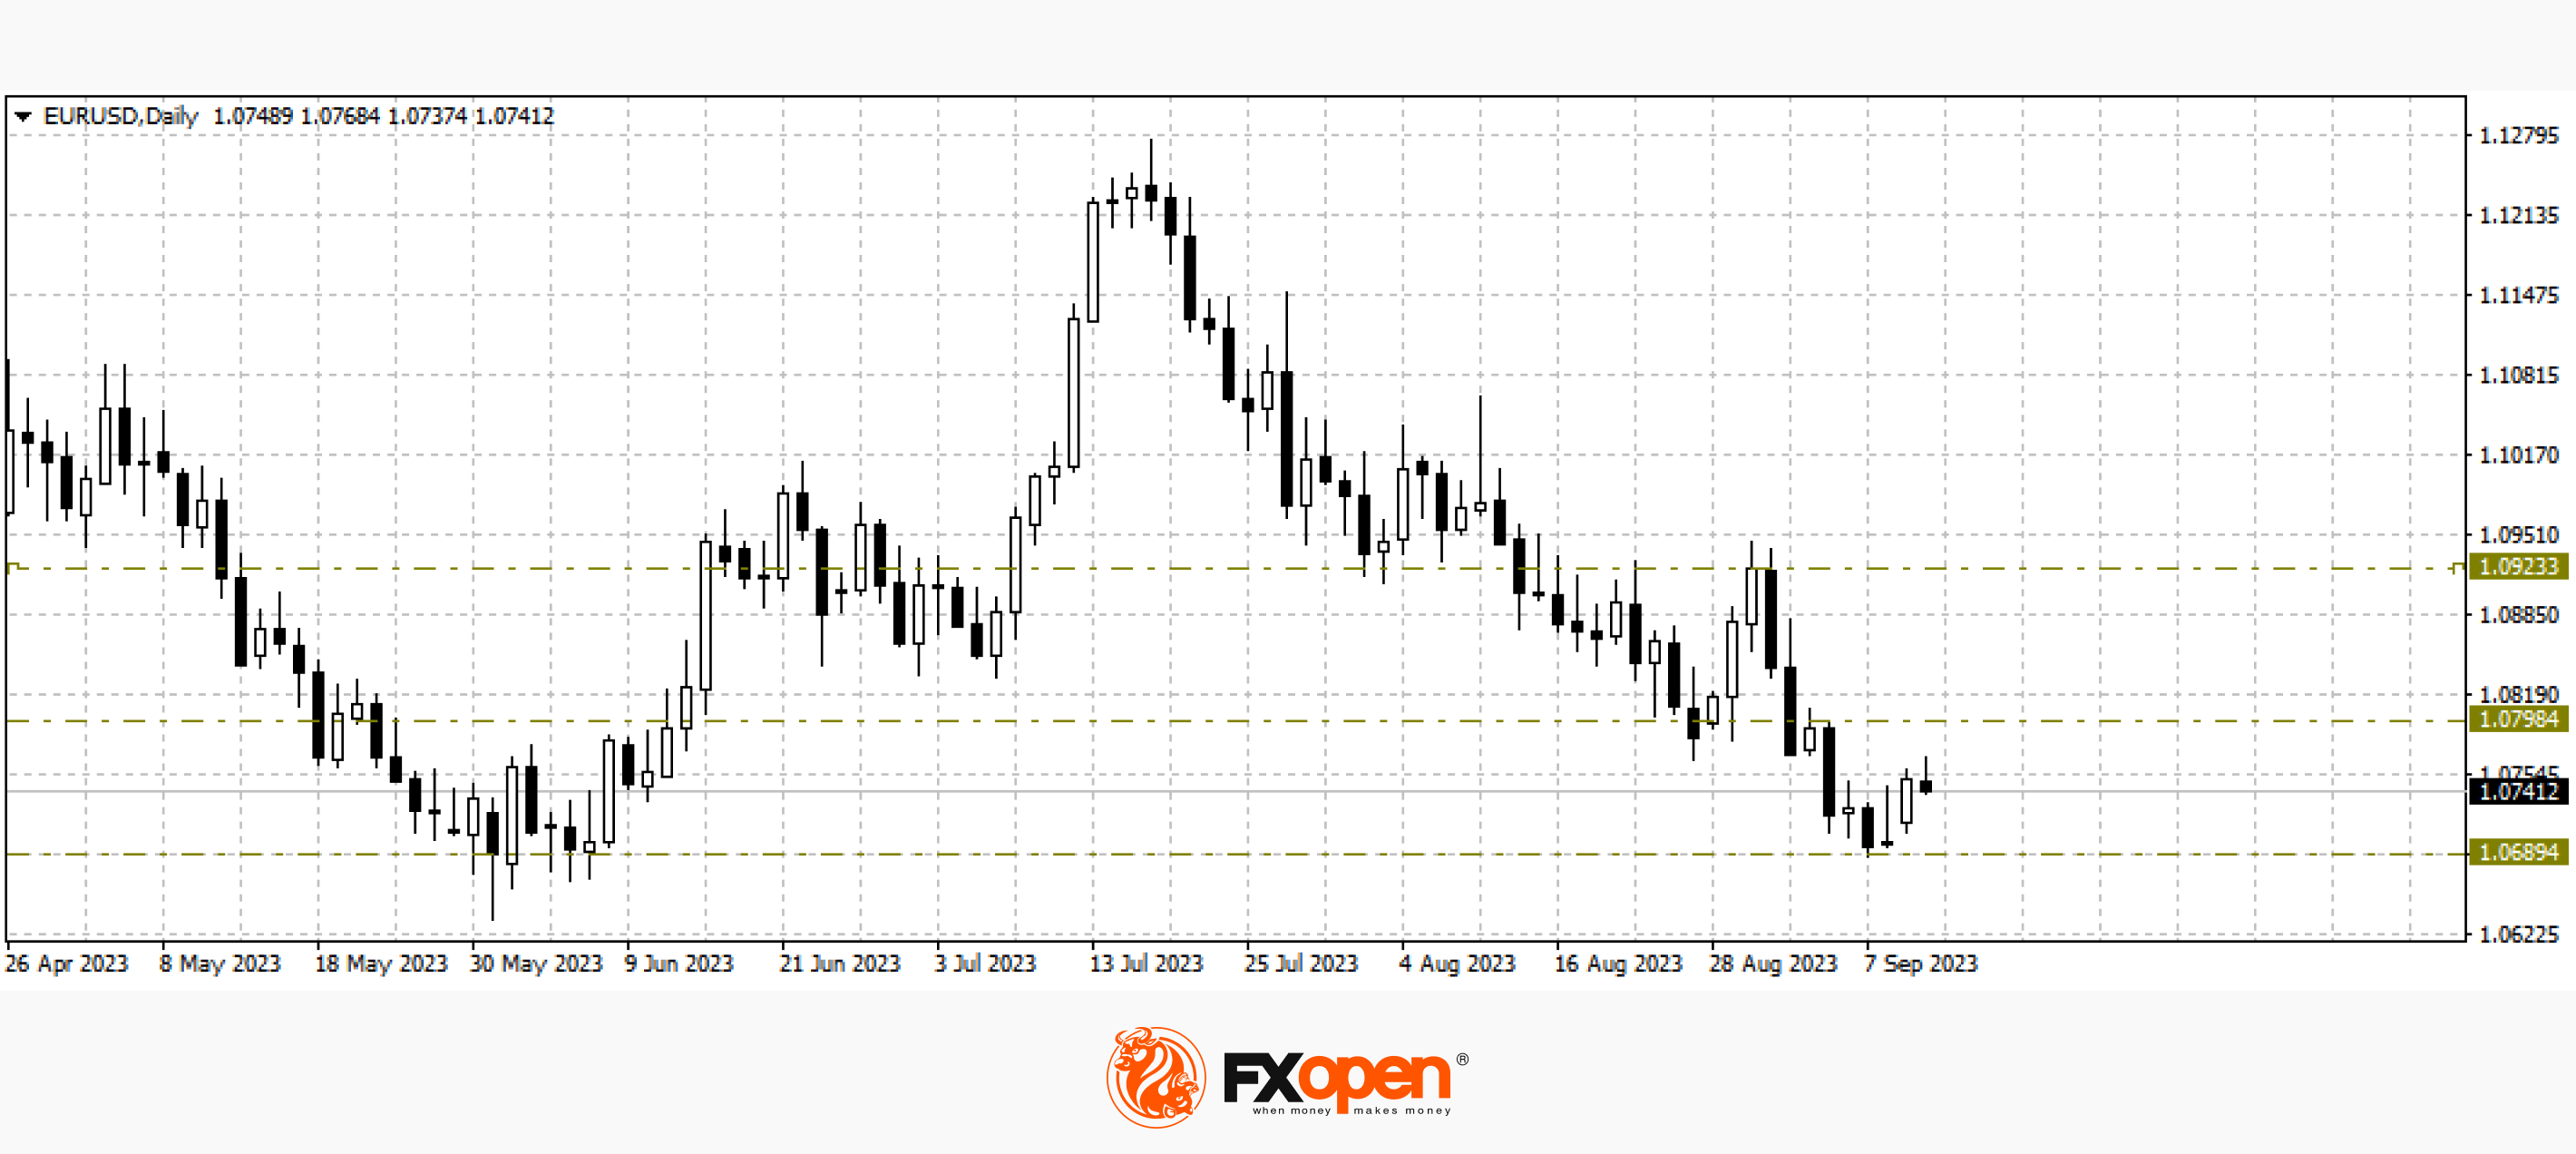
EUR/USD
The single European currency managed to stay above 1.0700 last week and is currently trying to develop an upward correction in the direction of 1.0800-1.0900. The development of the situation will largely depend on tomorrow's US inflation data for August. If inflation shows a slowdown, this may serve as a signal for a pause in interest rate increases by the American regulator. As a result, a full-scale downward correction in the US dollar may begin.
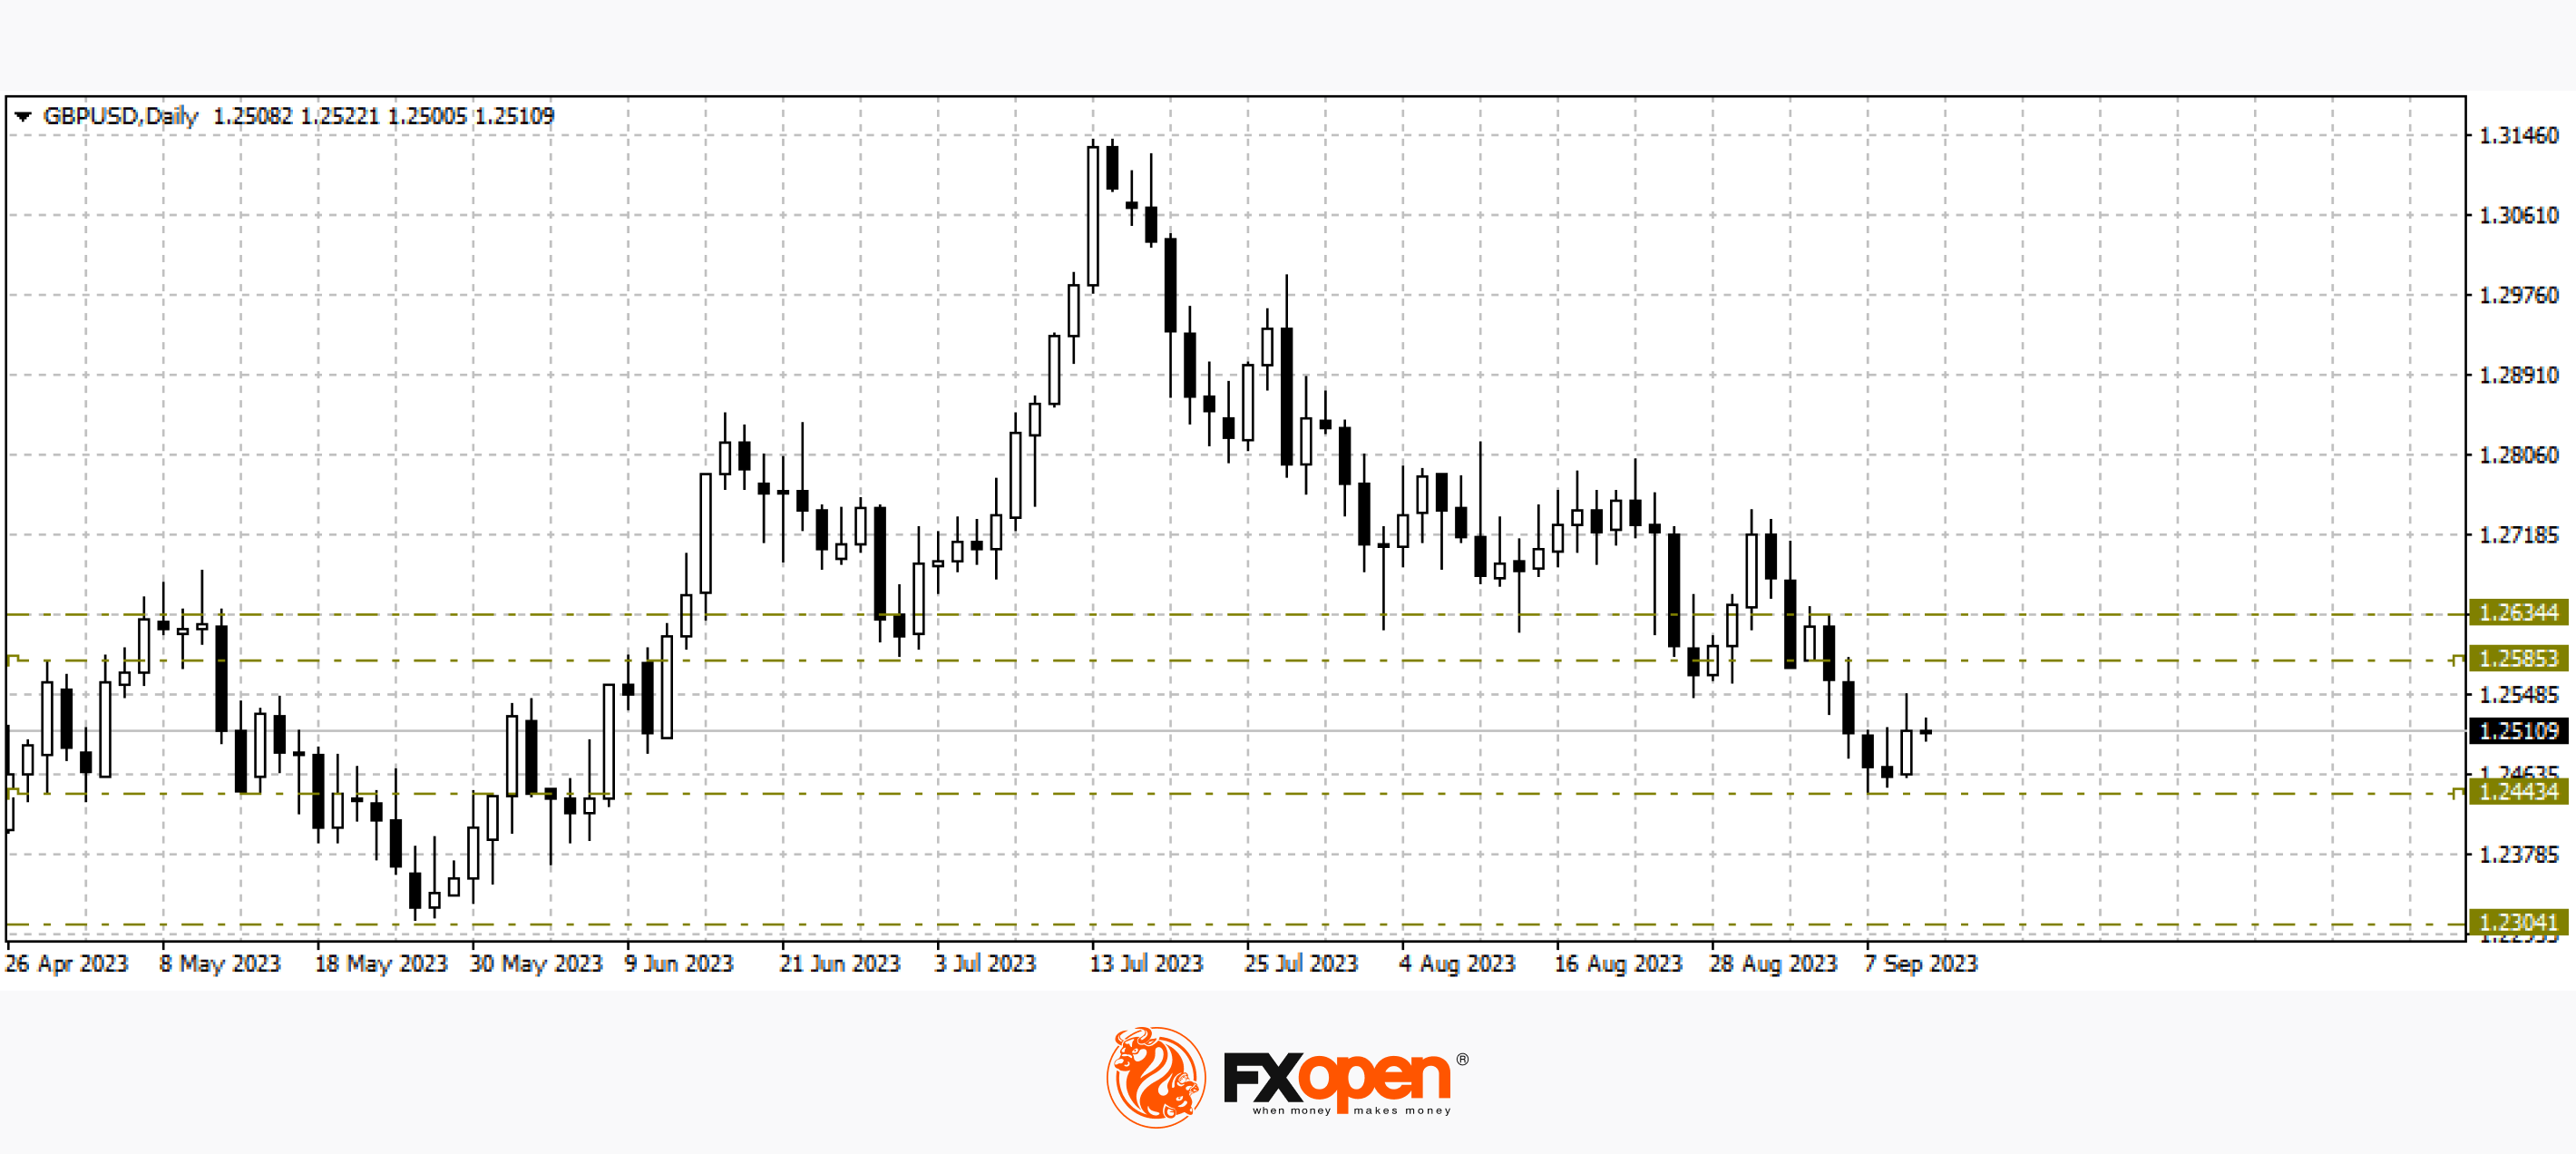
GBP/USD
We are seeing an upward correction in the pound/US dollar pair. Last week, the price was trading at 1.2440, and yesterday, it managed to correct by more than 100 pps. However, it makes no sense to consider the likelihood of a full-fledged upward correction without a confident strengthening above 1.2600. If the range of 1.2600-1.2640 remains in resistance status, the downward movement may continue in the direction of 1.2400-1.2300. Tomorrow morning, we are waiting for UK GDP data for July.
Trade over 50 forex markets 24 hours a day with FXOpen. Take advantage of low commissions, deep liquidity, and spreads from 0.0 pips (additional fees may apply). Open your FXOpen account now or learn more about trading forex with FXOpen.
This article represents the opinion of the Companies operating under the FXOpen brand only. It is not to be construed as an offer, solicitation, or recommendation with respect to products and services provided by the Companies operating under the FXOpen brand, nor is it to be considered financial advice.
Stay ahead of the market!
Subscribe now to our mailing list and receive the latest market news and insights delivered directly to your inbox.


Latest articles

Apple: Earnings Day Above the Activity Zone
On 30 April, after the market close, Apple Inc. will release its financial results for the second quarter of fiscal 2026. The consensus forecast, based on estimates from 31 analysts, points to revenue of around $109.7 billion, with expected

USD/JPY and USD/CHF Near Key Levels: The Dollar Supported by the Fed
The US dollar continues to trend upwards following the Federal Reserve meeting, drawing support from the regulator’s moderately hawkish stance and comments by Jerome Powell. Markets interpret the Fed’s rhetoric as a signal that restrictive policy is likely

EUR/USD and GBP/USD consolidate ahead of the Fed decision
European currencies are showing subdued dynamics, entering a consolidation phase following their previous advance. Earlier, EUR/USD and GBP/USD broke out of their ranges and strengthened; however, the subsequent correction has led both pairs to retest the previously breached