


The Market Focusing on Speech of Federal Reserve Head
FXOpen

Despite the abundance of fundamental data of the past trading week, the main currency pairs continue to trade in rather narrow flat corridors. Thus, the US dollar/yen currency pair is trading above 150.00, from time to time testing the figure 149, buyers of the pound/US dollar pair do not give up trying to go above 1.2700, and the euro/US dollar pair has been trading between 1.0900-1.0800 for about three weeks. Apparently, investors are waiting for more specific signals from leading central banks to open new positions.
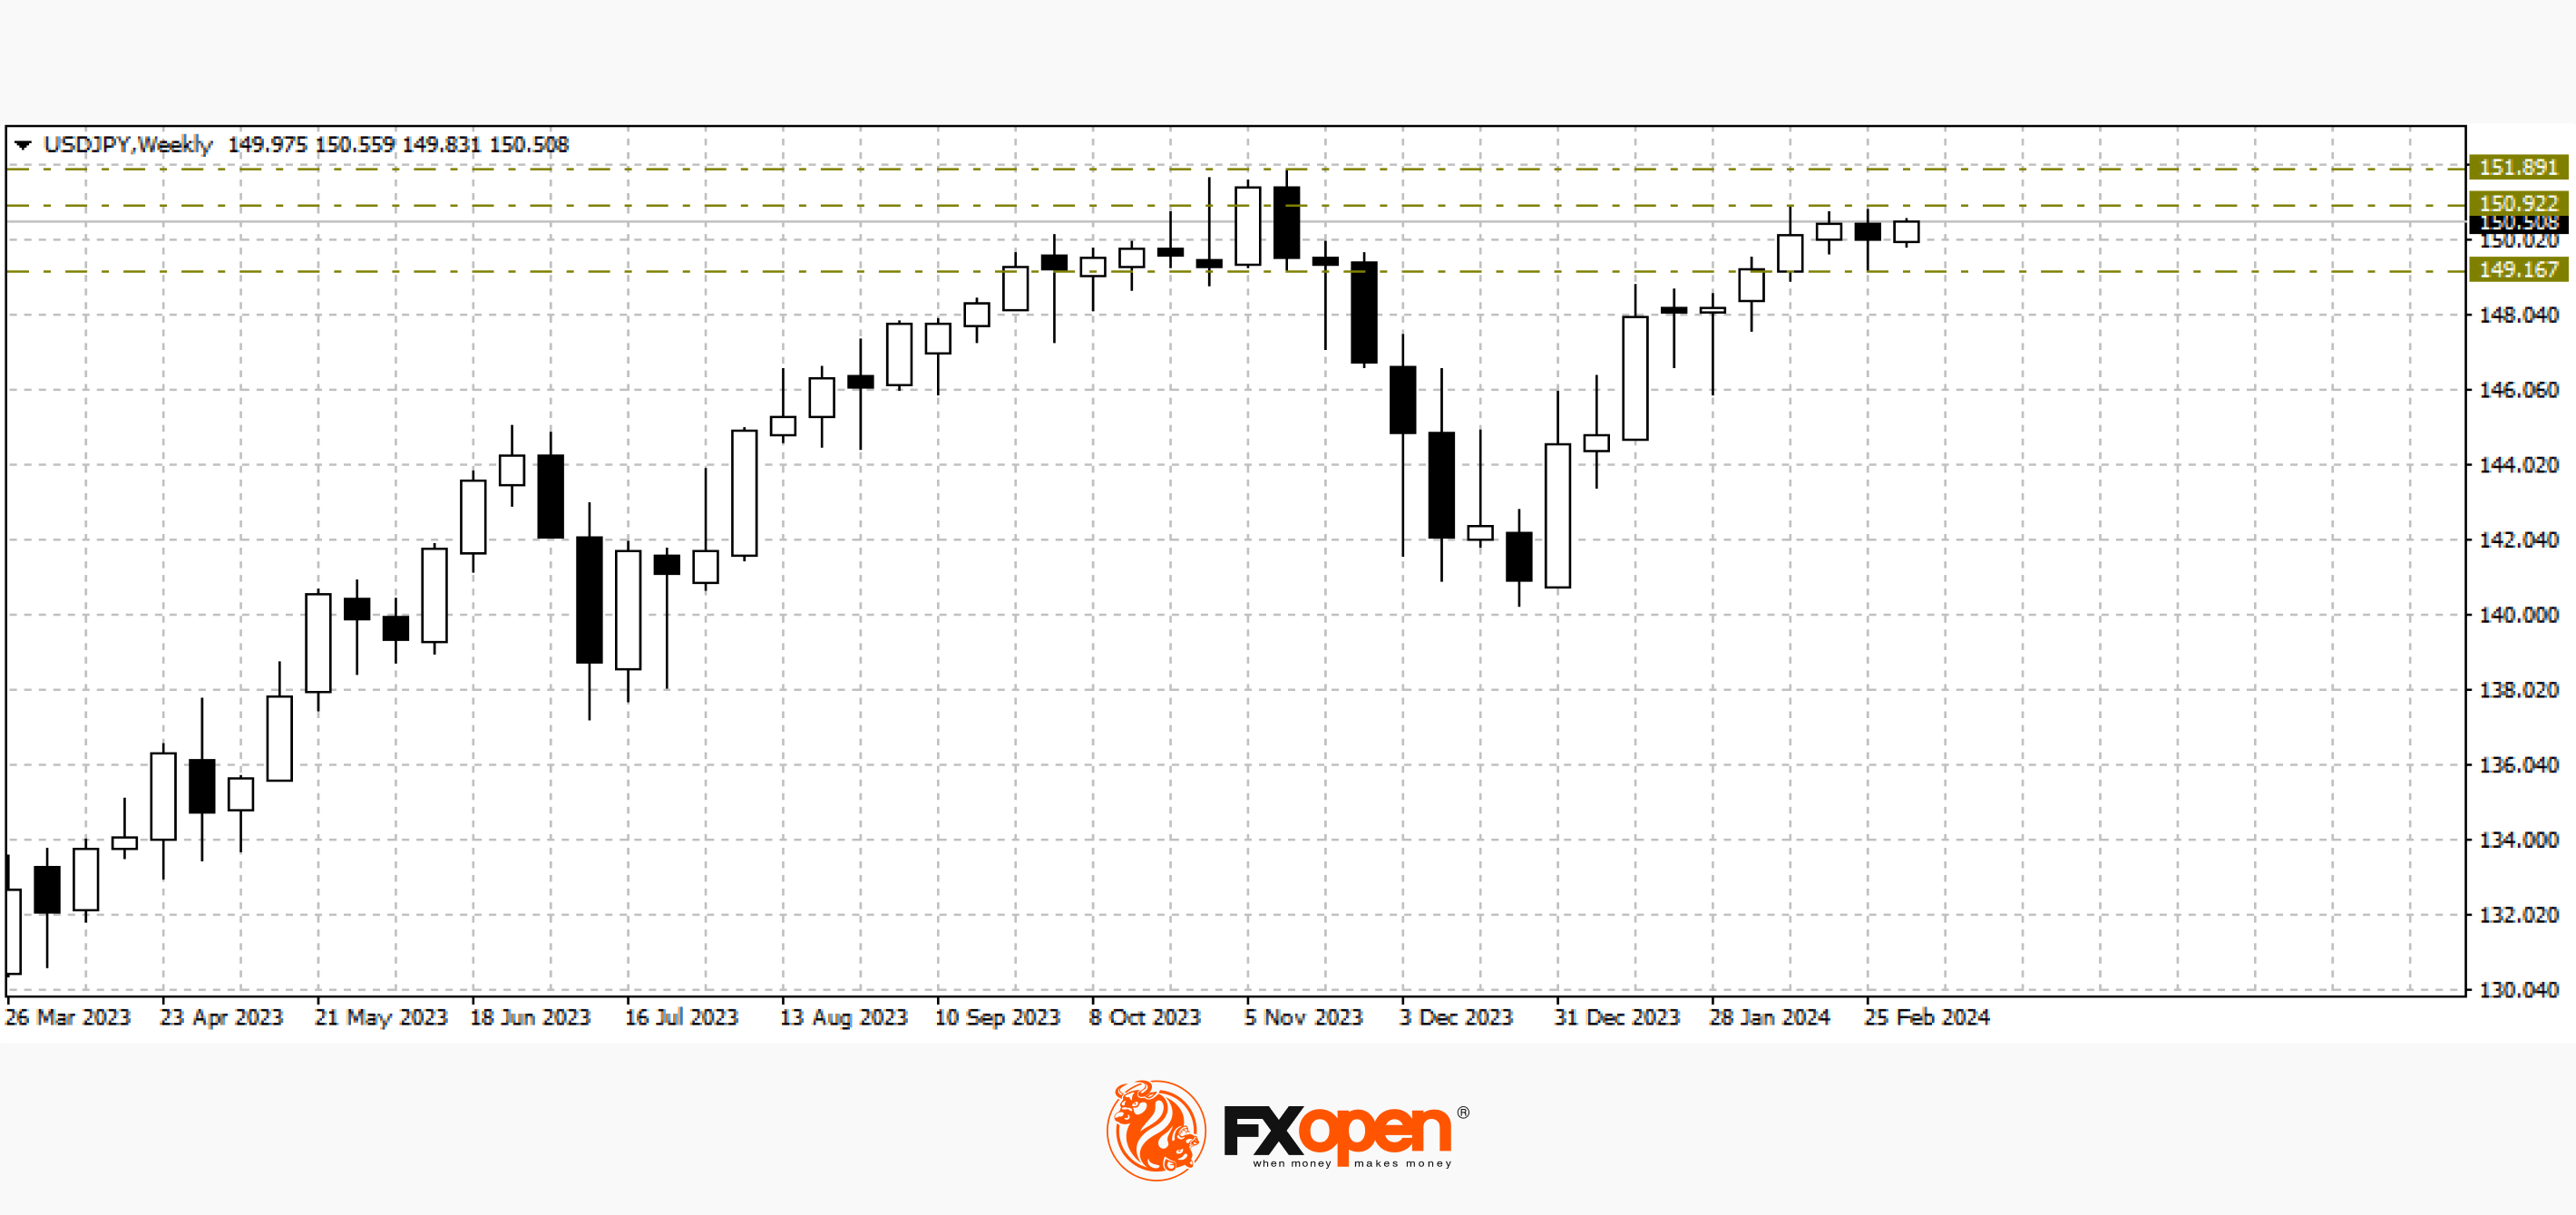
USD/JPY
Last week, greenback buyers in the USD/JPY pair once again tried to test important resistance at 151.00. The attempt was unsuccessful and ended with a sharp rollback to 149.10, which allowed the formation of a reversal pattern to begin on the weekly timeframe. If on the USD/JPY chart in the coming trading sessions the level of 151.00 remains in resistance status, the price may test 149.00 again. If buyers manage to gain a foothold above 151.00, growth may resume towards last year's highs at 151.90.
Today at 17:45 GMT+3, we are waiting for the publication of data on the business activity index (PMI) in the services sector for February. A little later, the Purchasing Managers' Index for the US non-manufacturing sector from ISM will be published for the same period.
Tomorrow at 18:00 GMT+3, Fed Chairman Jerome Powell is scheduled to speak.
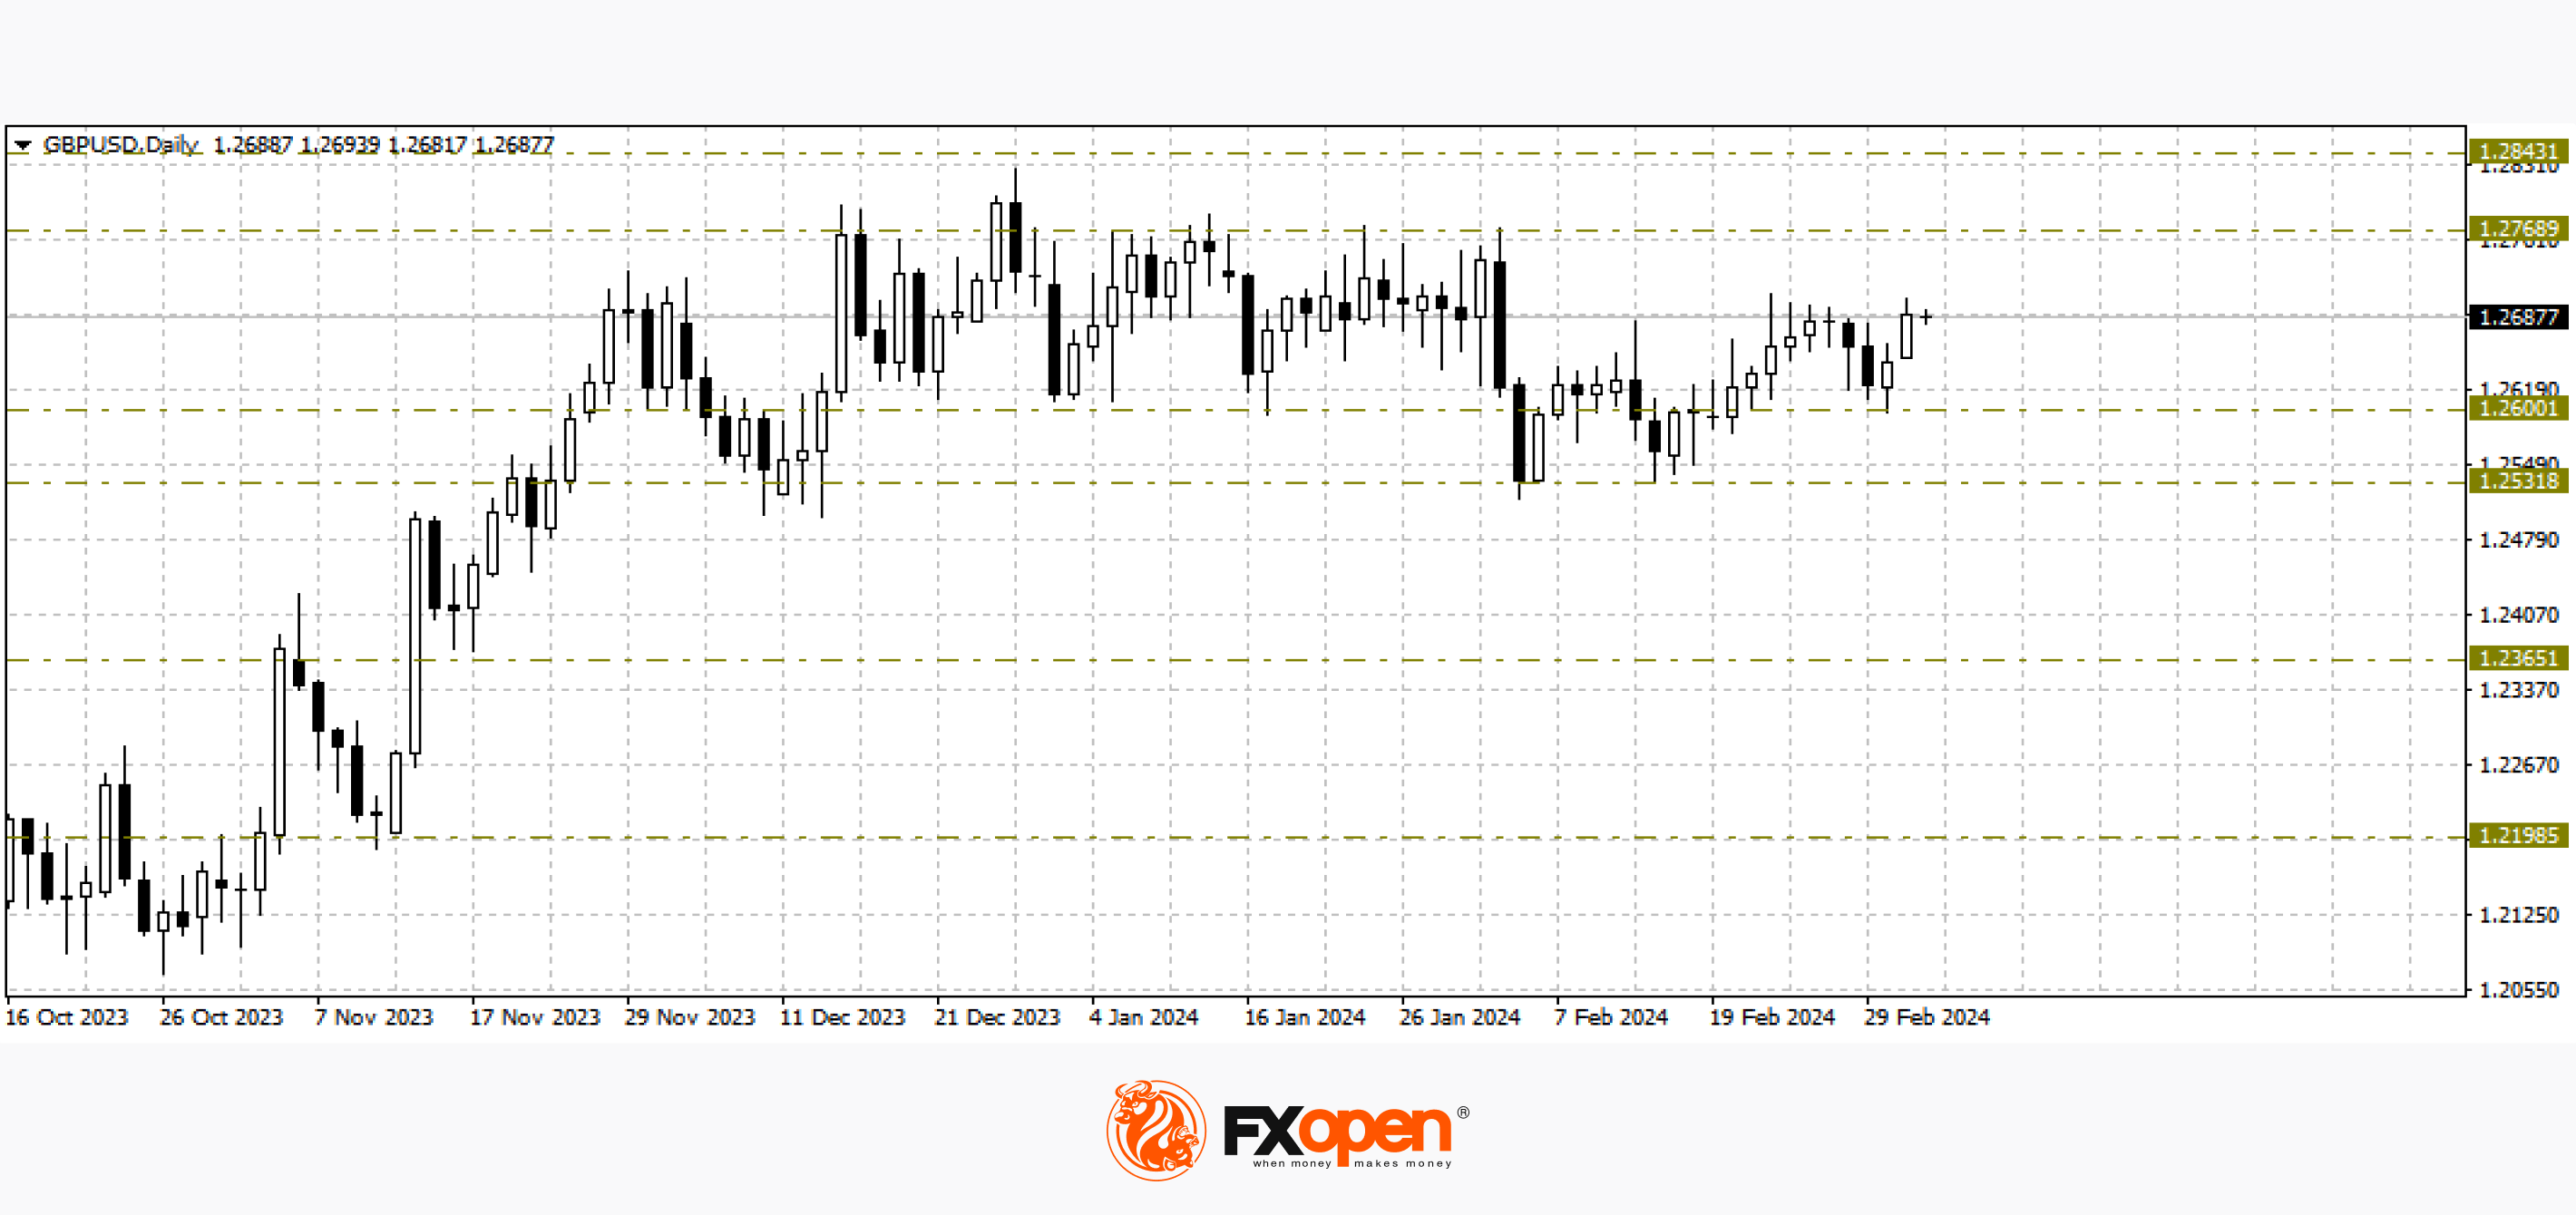
GBP/USD
The decline of the pound/US dollar pair last week slowed down at 1.2600. Buyers of the pair managed not only to find support, but also to return to the February highs at 1.2700. The coming trading sessions will be very important for the further pricing of the pair. If buyers manage to develop an upward trend, the price on the GBP/USD chart may strengthen towards 1.3000. A break of recently tested support levels at 1.2600-1.2500 could contribute to the resumption of the downtrend in the direction of 1.2300-1.2200.
Today at 12:30 GMT+3, it is worth paying attention to the publication of data on the UK composite business activity index (PMI) for February.
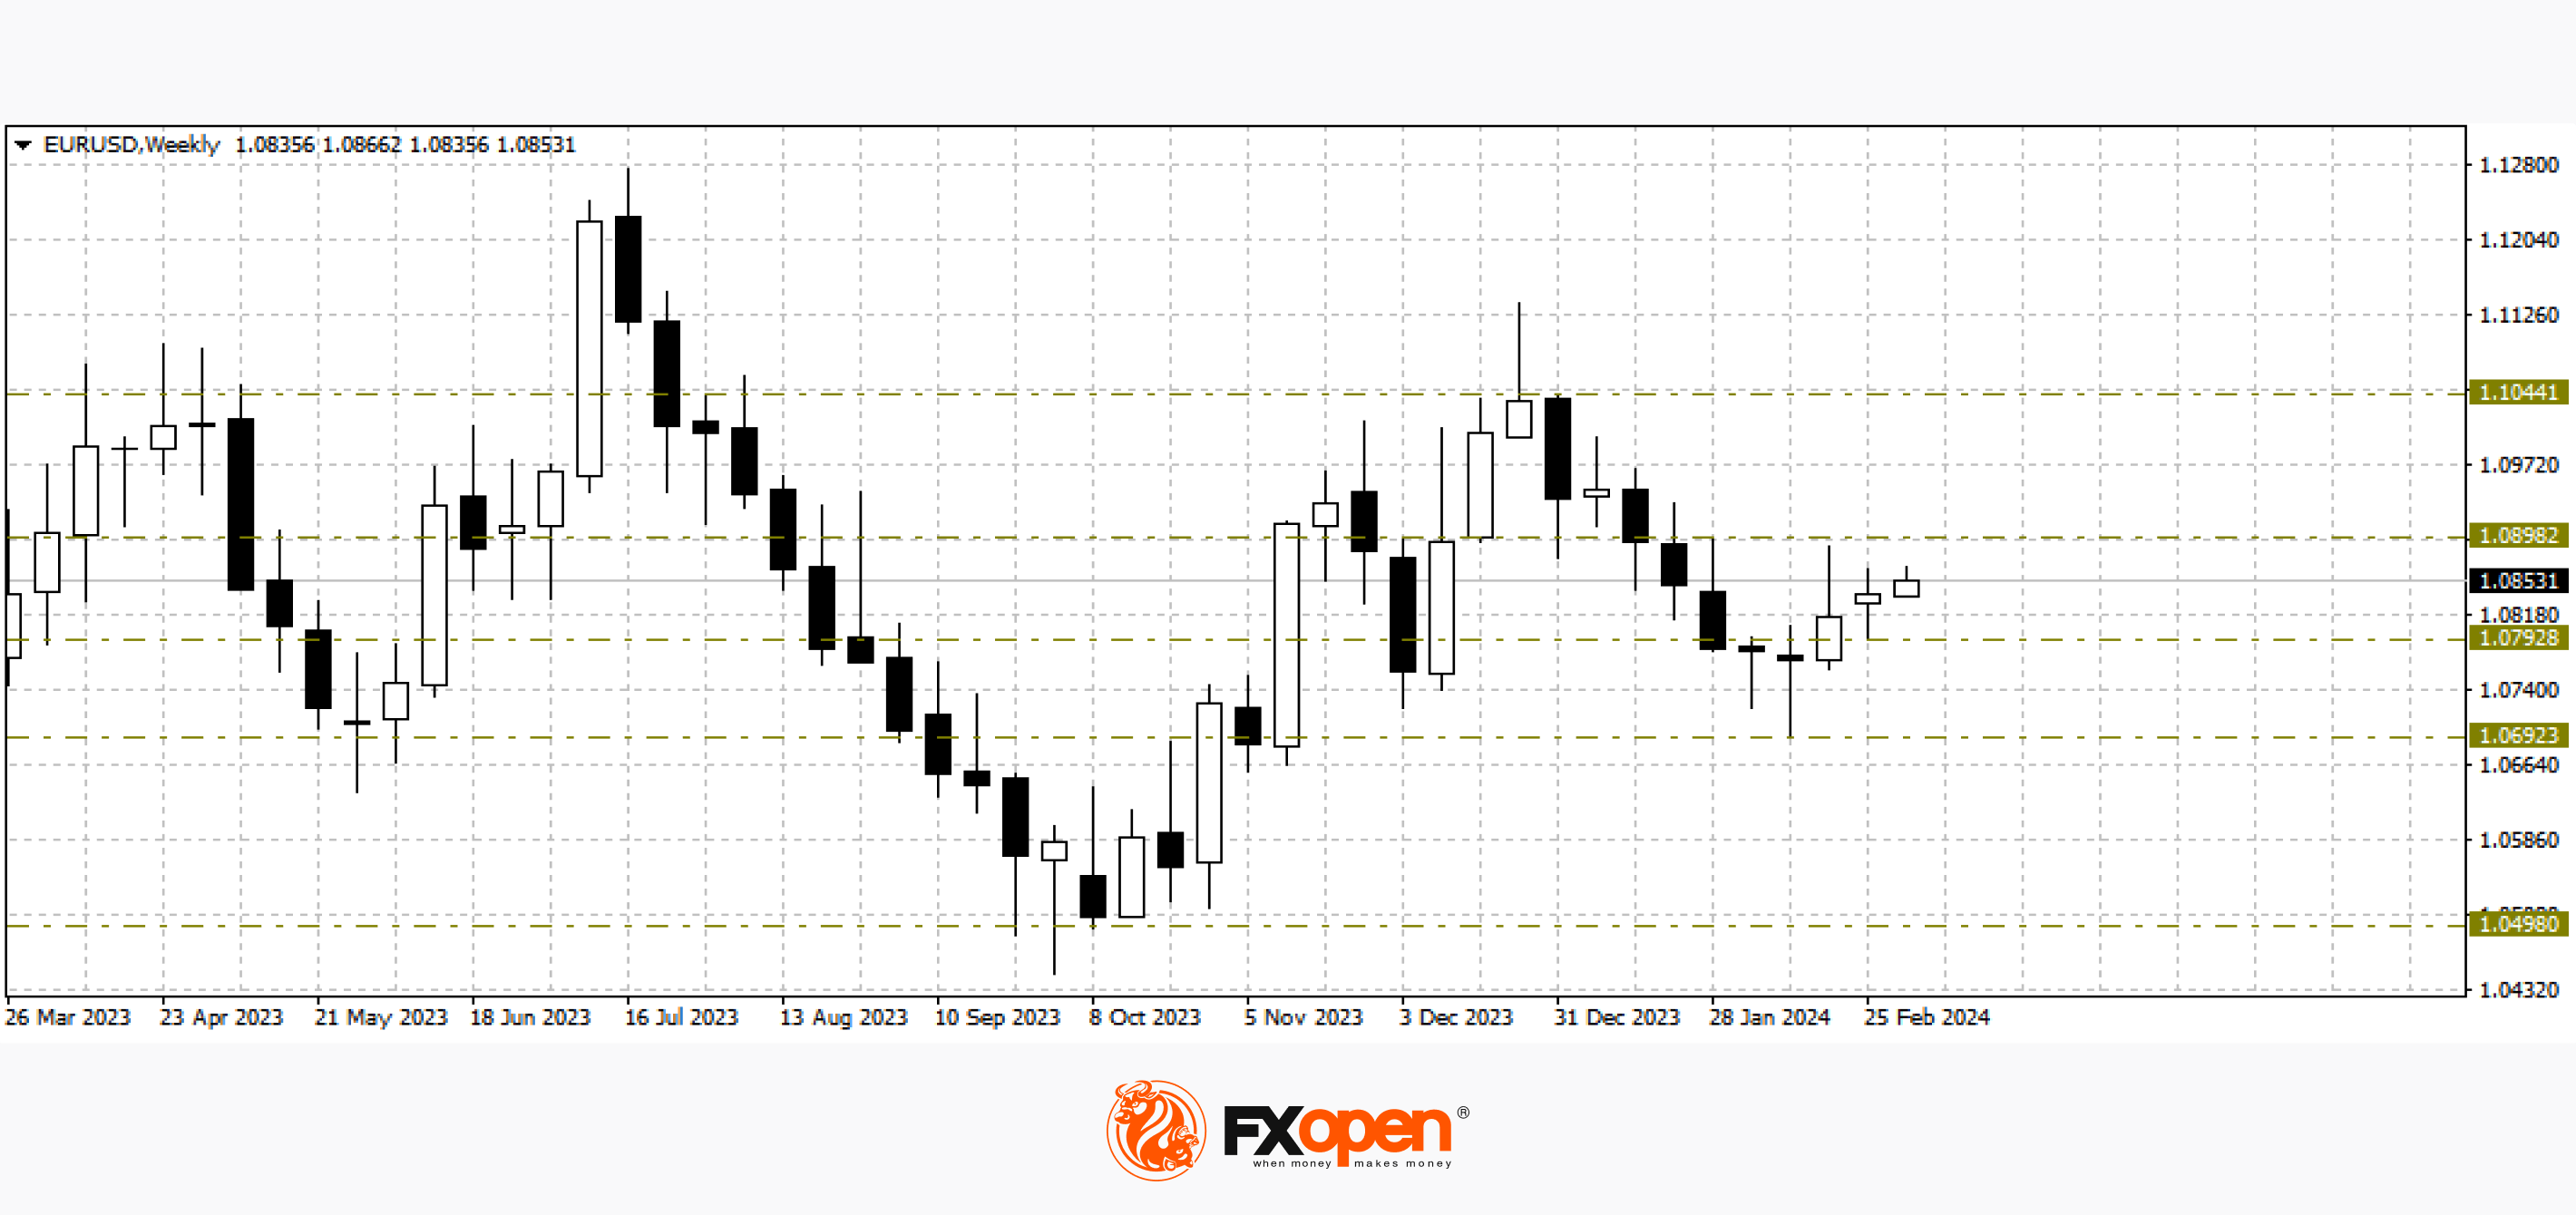
EUR/USD
The single European currency, after declining to 1.0700 in early February, managed to find support and test 1.0900. Buyers of the pair failed to go above this level, and at the moment the price is trading at 1.0850. Technical analysis of EUR/USD shows that if the upper limit of the specified range becomes a support status, the price may rise to the psychological level of 1.1000.
From the point of view of fundamental analysis, today at 12:00 GMT+3, it is worth paying attention to the publication of data on the composite business activity index (PMI) from S&P Global in the eurozone for February. A little later, the eurozone producer price index for January will be released.
Trade over 50 forex markets 24 hours a day with FXOpen. Take advantage of low commissions, deep liquidity, and spreads from 0.0 pips (additional fees may apply). Open your FXOpen account now or learn more about trading forex with FXOpen.
This article represents the opinion of the Companies operating under the FXOpen brand only. It is not to be construed as an offer, solicitation, or recommendation with respect to products and services provided by the Companies operating under the FXOpen brand, nor is it to be considered financial advice.
Stay ahead of the market!
Subscribe now to our mailing list and receive the latest market news and insights delivered directly to your inbox.


Latest articles

Ethereum: Has the Recovery Begun?
Ethereum has staged a notable rebound after once again testing the heavily watched psychological zone around 1500$. Since bouncing off this support, ETH/USD has climbed roughly 13%, now trading around the $1,700 mark.
This recovery is being driven

Oil Prices Are Back at Pre-Conflict Levels. Analysts Are Divided
At the start of May, oil markets were still pricing in elevated geopolitical risk and expectations of sustained supply disruption.
But easing tensions between Washington and Tehran, along with improving supply expectations, have rapidly shifted sentiment back toward fundamentals.
📉 Brent

The Dollar Awaits the Week’s Key Report: AUD/USD and NZD/USD at Crucial Technical Levels
Following mixed performance by the US dollar earlier this week, investors are now fully focused on the June Nonfarm Payrolls report, which will be released on Thursday rather than Friday. The schedule has been brought forward as US financial markets