


US Dollar Rises after GDP Data Release
FXOpen

The American currency is supported by evidence of the stability of the national economy, which allows the US Federal Reserve not to rush to begin easing monetary policy. Thus, the data published yesterday reflected an increase in gross GDP in the fourth quarter of 2023 by 3.3% after an increase of 4.9% in the previous period, with expectations at 2.0%. At the same time, labour market statistics recorded an increase in the number of initial applications for unemployment benefits for the week of January 19 from 189.0k to 214.0k with a forecast of 200.0k, and the number of repeated applications for the week of January 12 rose from 1,806 million to 1.833 million, while analysts expected 1.828 million. In addition, the US currency is supported by data from the real estate market, where sales of new homes in December adjusted by 8.0% after -9.0% previously, and in absolute terms the value rose from 0.615 million to 0.664 million, while analysts expected 0.645 million.
EUR/USD
The EUR/USD pair continues its decline, which began yesterday after the ECB meeting. Immediate resistance can be seen at 1.0870, a break higher could trigger a move towards 1.0932. On the downside, immediate support is seen at 1.0815, a break below could take the pair towards 1.0800.
The results of the ECB meeting yesterday put pressure on the position of the single currency. As expected, the key interest rate was kept at 4.50%, the deposit rate at 4.00%, and the margin rate at 4.75%. Officials noted weak economic growth in the region and ongoing risks to financial stability, although statistics record positive changes in inflation dynamics. In addition, the head of the department, Christine Lagarde, emphasised that at the moment she considers it premature to discuss reducing the cost of borrowing. Moreover, the day before, investors assessed German data on business optimism from the Institute for Economic Research (IFO): in January, the indicator fell from 86.3 points to 85.2, while analysts expected 86.7, and the economic expectations index, from 84.2 to 83.5 with a forecast of 84.8.
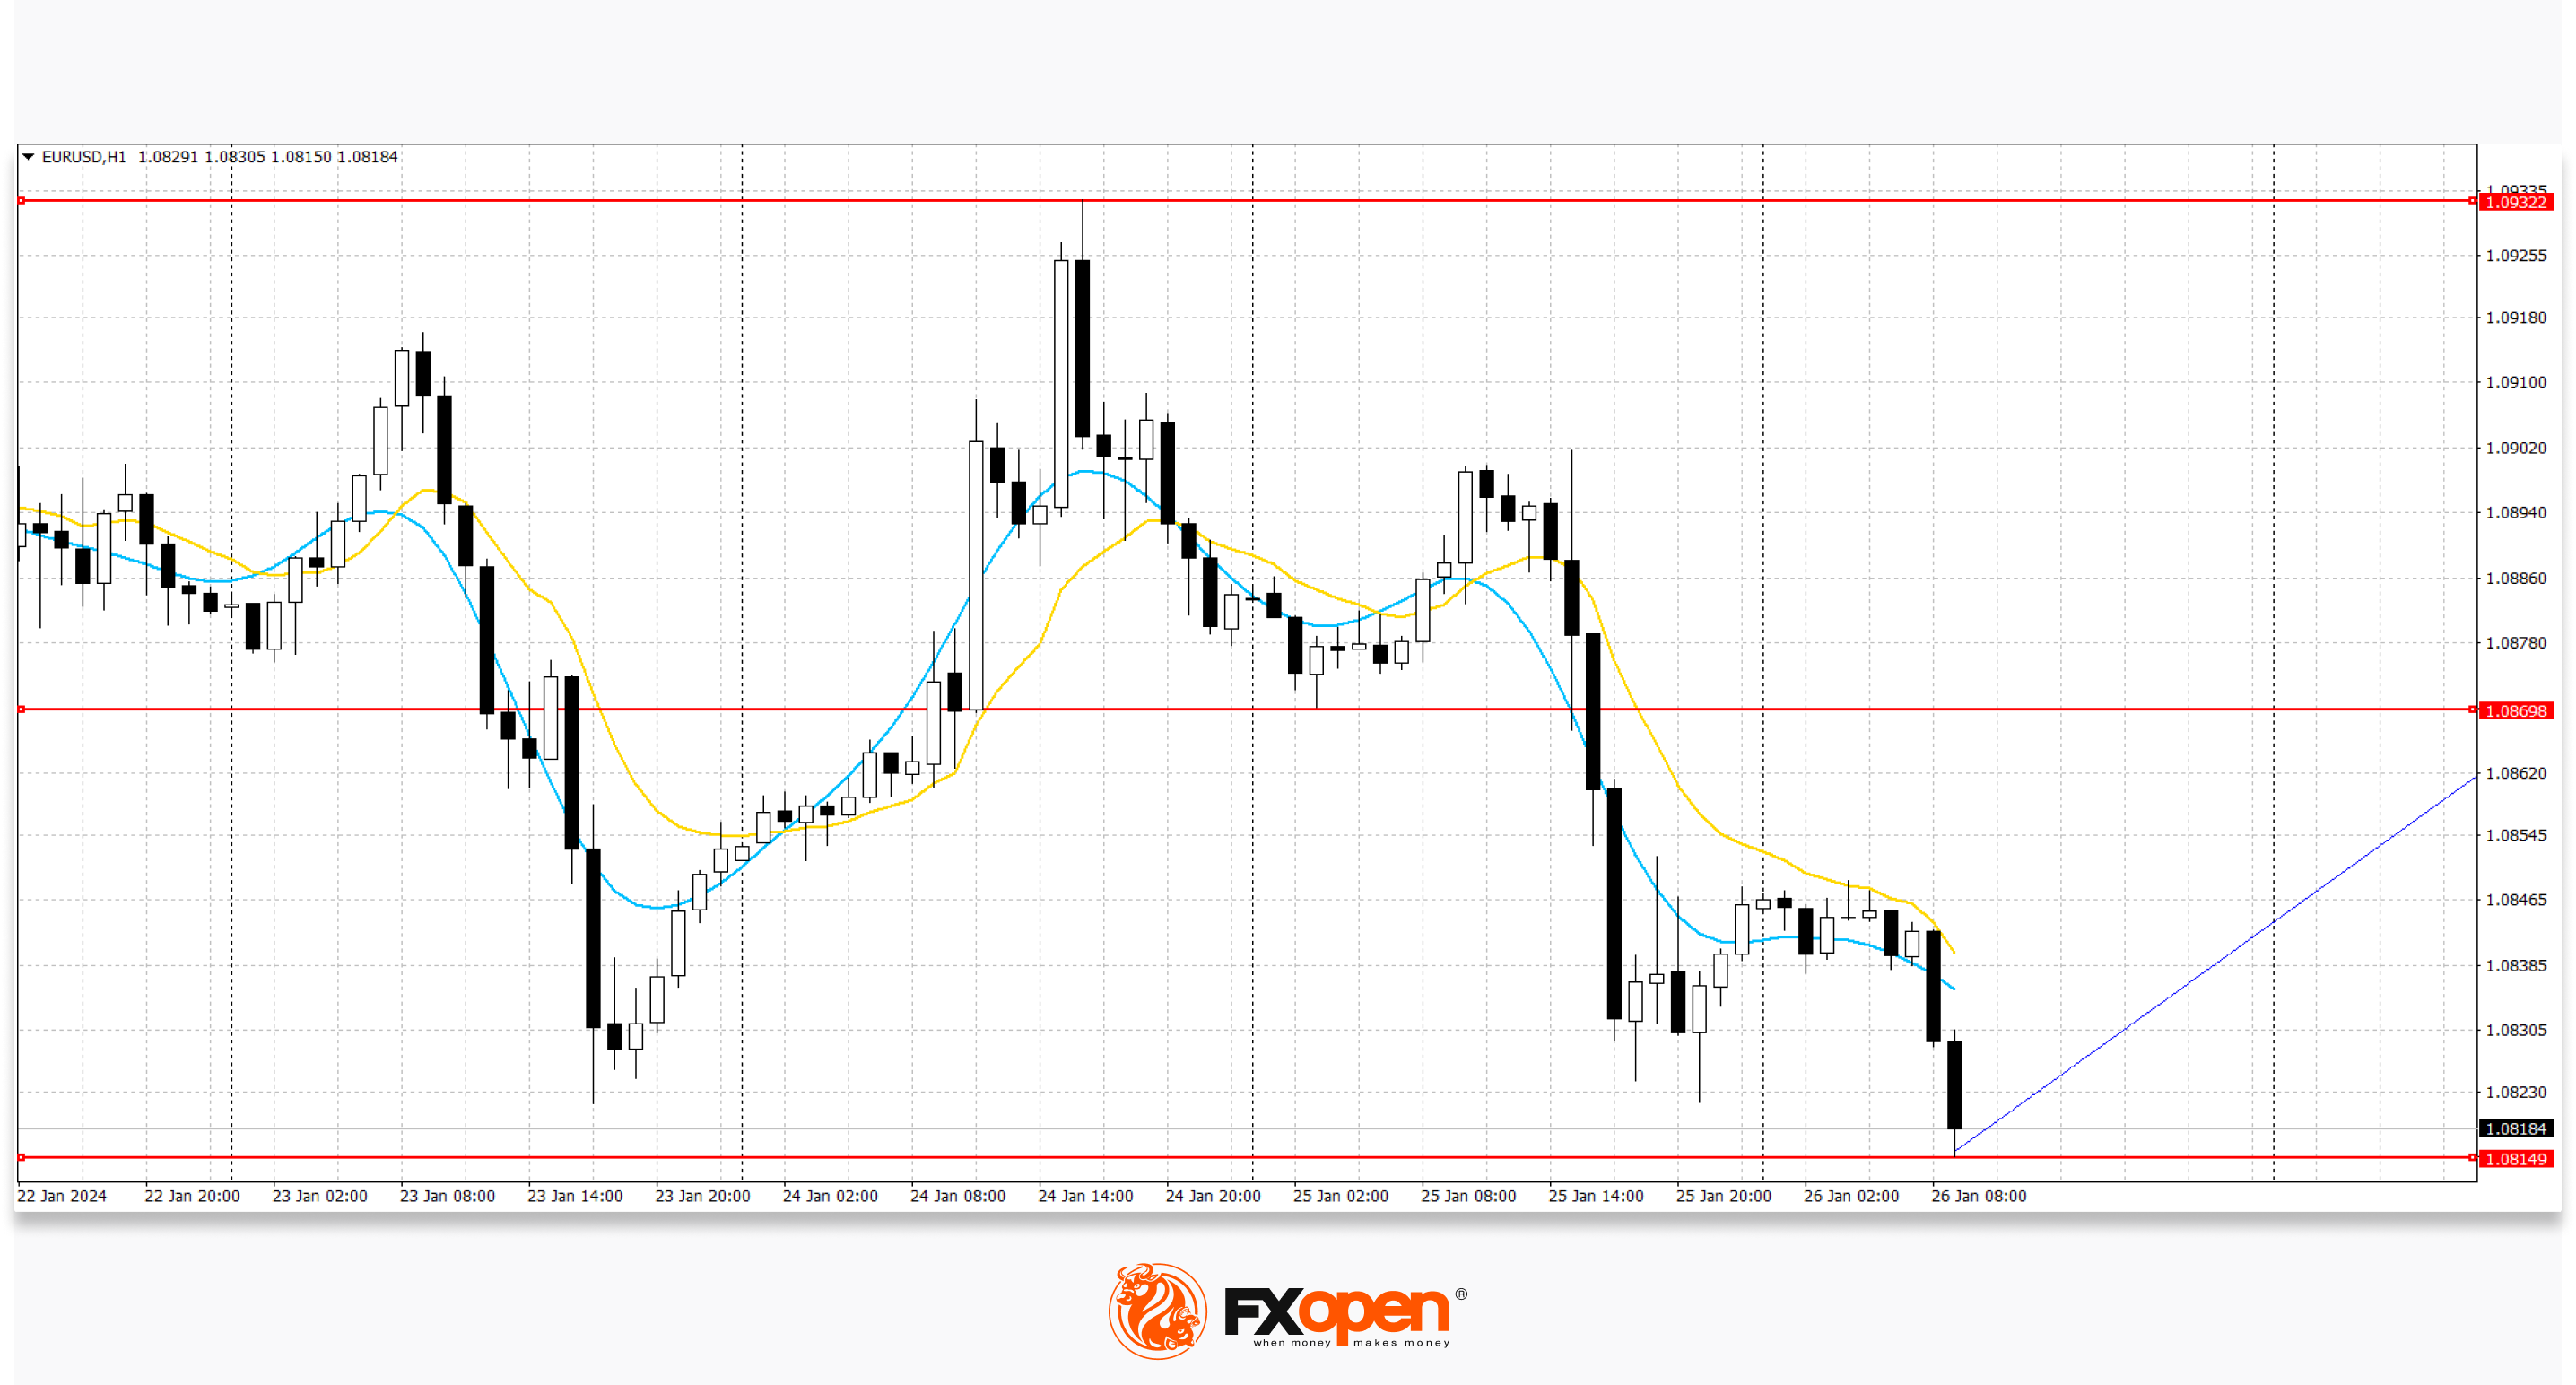
Technical analysis of EUR/USD shows that during the week a trading range formed with boundaries of 1.0815 and 1.0932. Now the price is near the lower border, from where it is possible to move to the middle of the range.
GBP/USD
The GBP/USD pair is trading in a narrow range around 1.2690. Immediate resistance can be seen at 1.2716, a break higher could trigger a rise towards 1.2774. On the downside, immediate support is seen at 1.2649, a break below could take the pair towards 1.2596.
The pound is strengthening its position as experts are confident that the Bank of England will launch a program to reduce interest rates later than the US Federal Reserve and the ECB. Inflation in the UK remains noticeably higher than the American and European indicators, but the trends towards easing price pressure are still quite significant. The British currency was also supported by January data on business activity, published on Wednesday, January 24. The index in the manufacturing sector from S&P Global rose from 46.2 points to 47.3 points, while experts expected 46.7 points, and the indicator in the services sector strengthened from 53.4 points to 53.8 with preliminary estimates of 53.2.
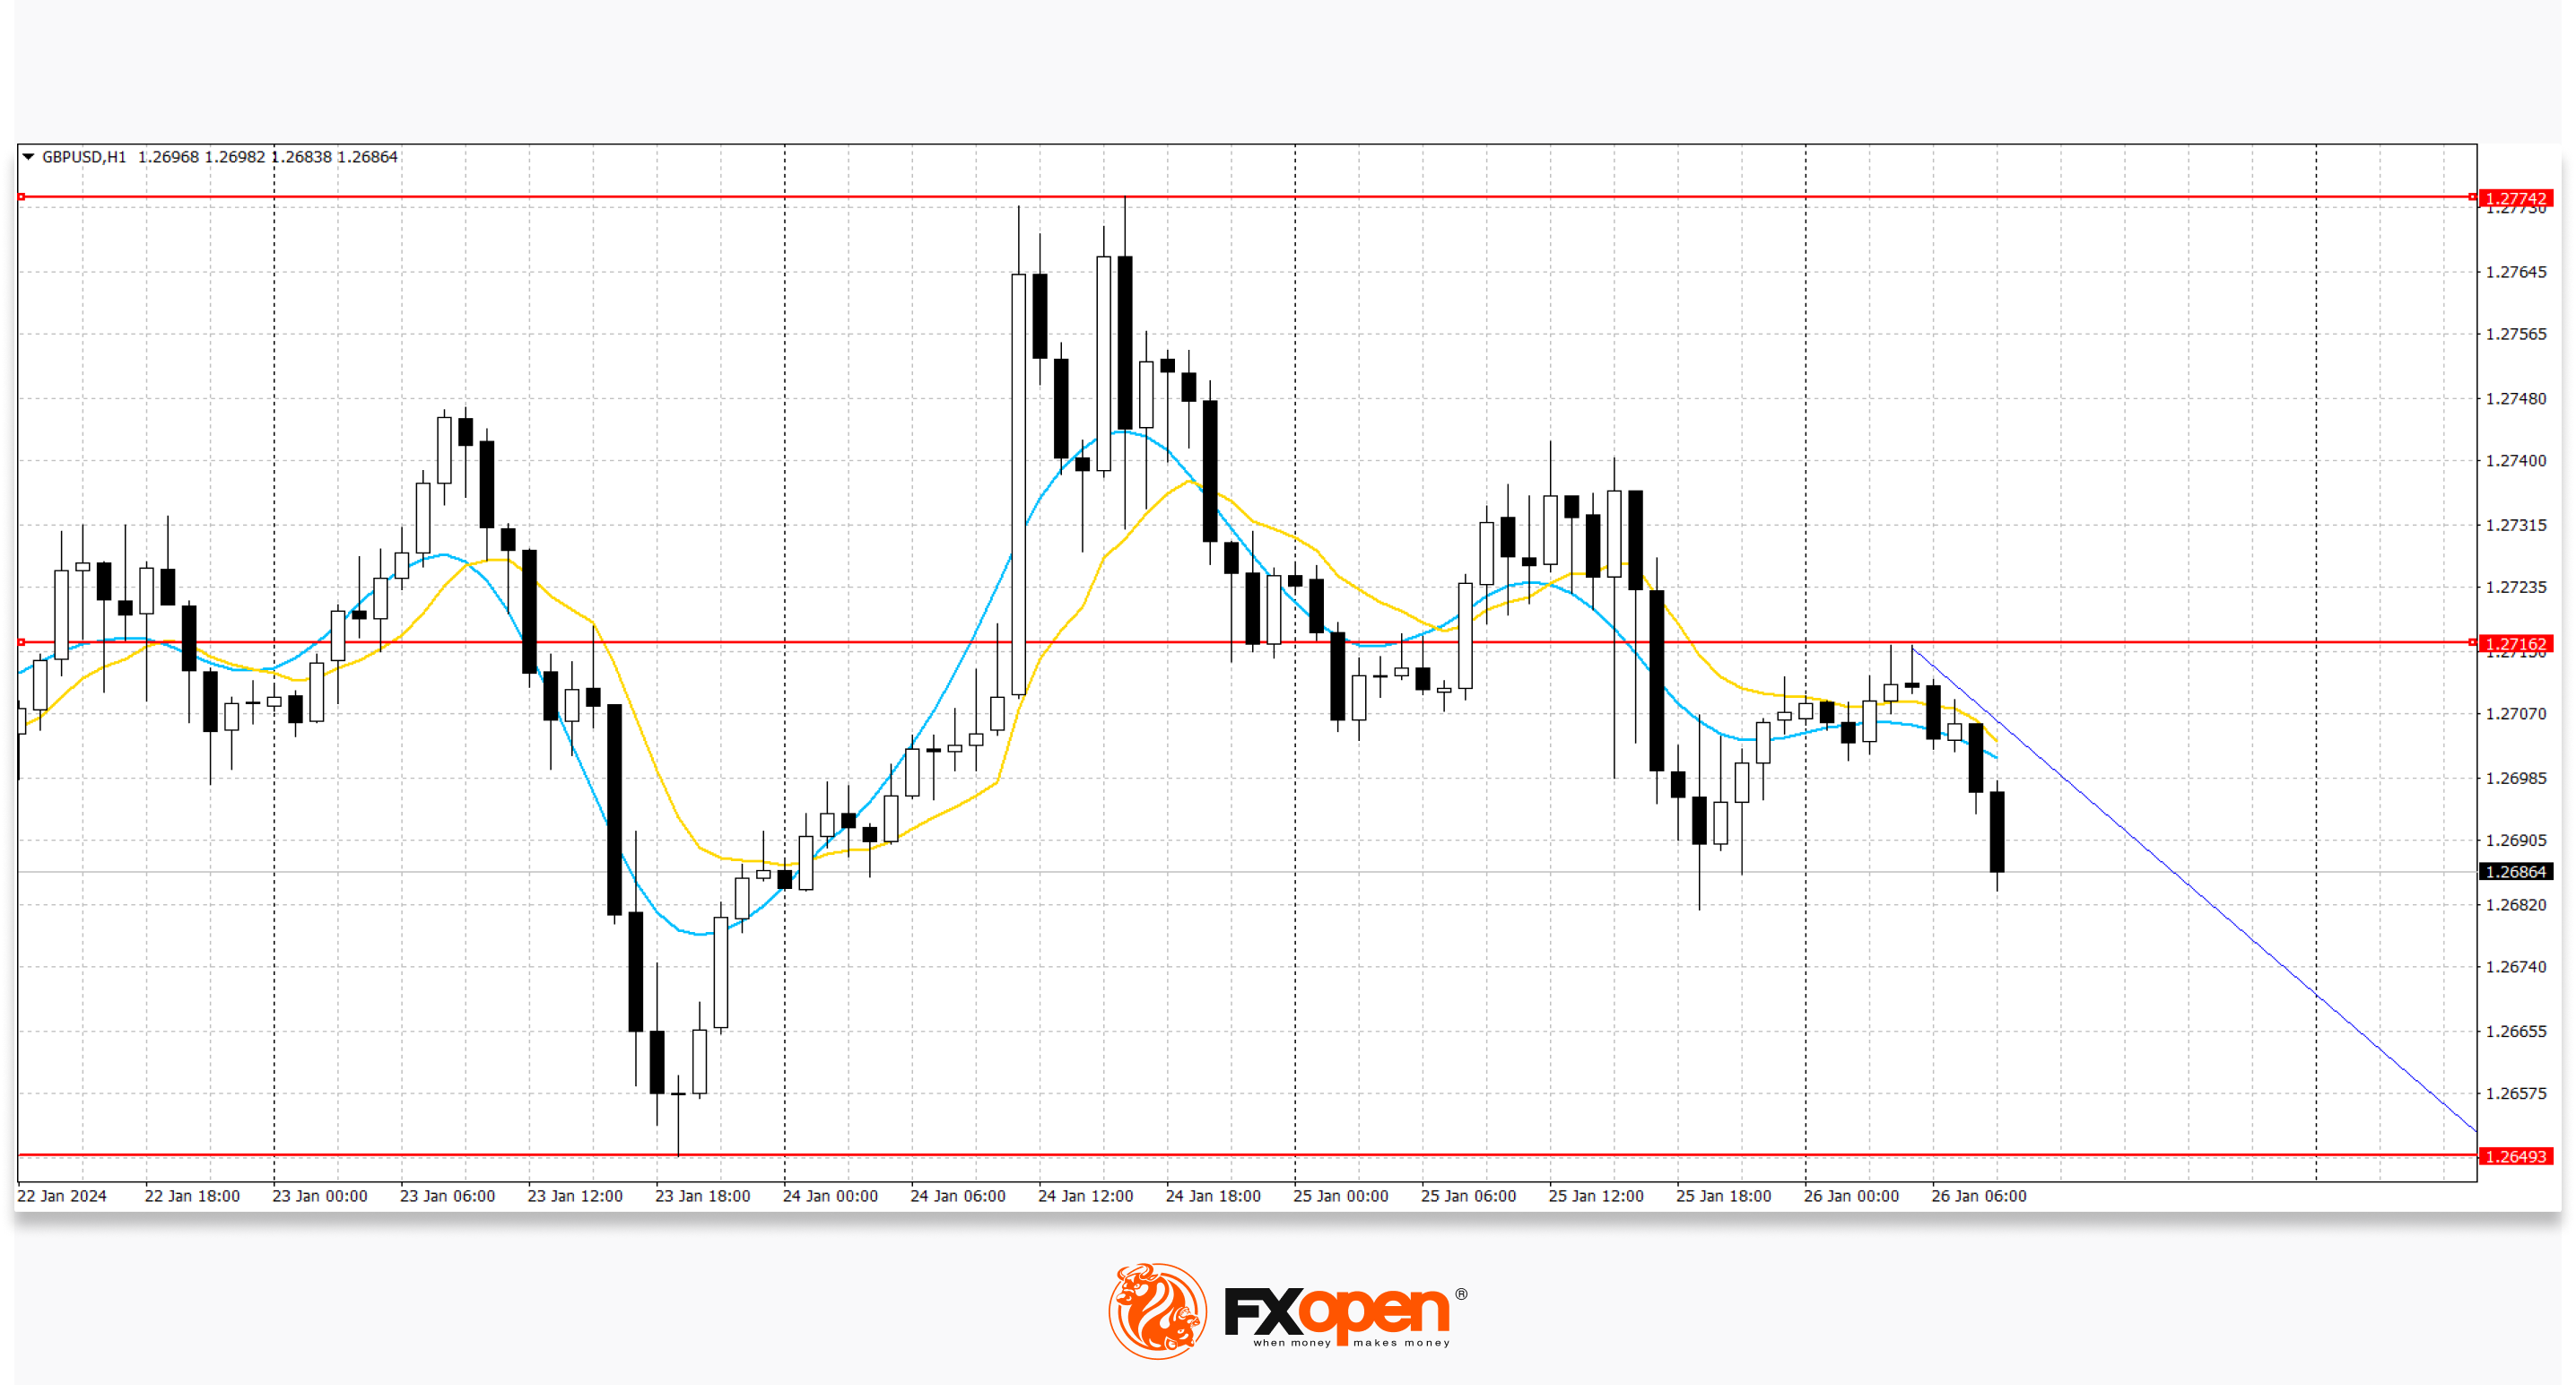
During the week, a trading range formed on the GBP/USD chart with boundaries of 1.2649 and 1.2774. Now the price is at the bottom of the range and may continue to decline.
USD/JPY
The USD/JPY chart shows restrained growth, where the pair is developing the bullish momentum formed the day before and testing the 147.75 mark for an upward breakout. Strong resistance can be seen at 147.88, a break higher could trigger a rise towards 148.70. On the downside, immediate support is seen at 146.65. A break below could take the pair towards 146.00.
Investors evaluate statistics from Japan. In January, the consumer price index in the Tokyo region slowed from 2.4% to 1.6%, and the index excluding food and energy prices slowed from 3.5% to 3.1%. Such a significant weakening of inflationary pressure could lead to the Bank of Japan continuing to maintain an accommodative monetary policy. Despite expectations that the regulator will soon abandon negative interest rates, the likelihood of an increase in borrowing costs decreases along with the consumer price index. The Japanese government's monthly economic report was published yesterday, assessing the impact of the strong earthquake on the Noto Peninsula in Ishikawa Prefecture, as well as setting out short-term forecasts for exports, production and consumption.
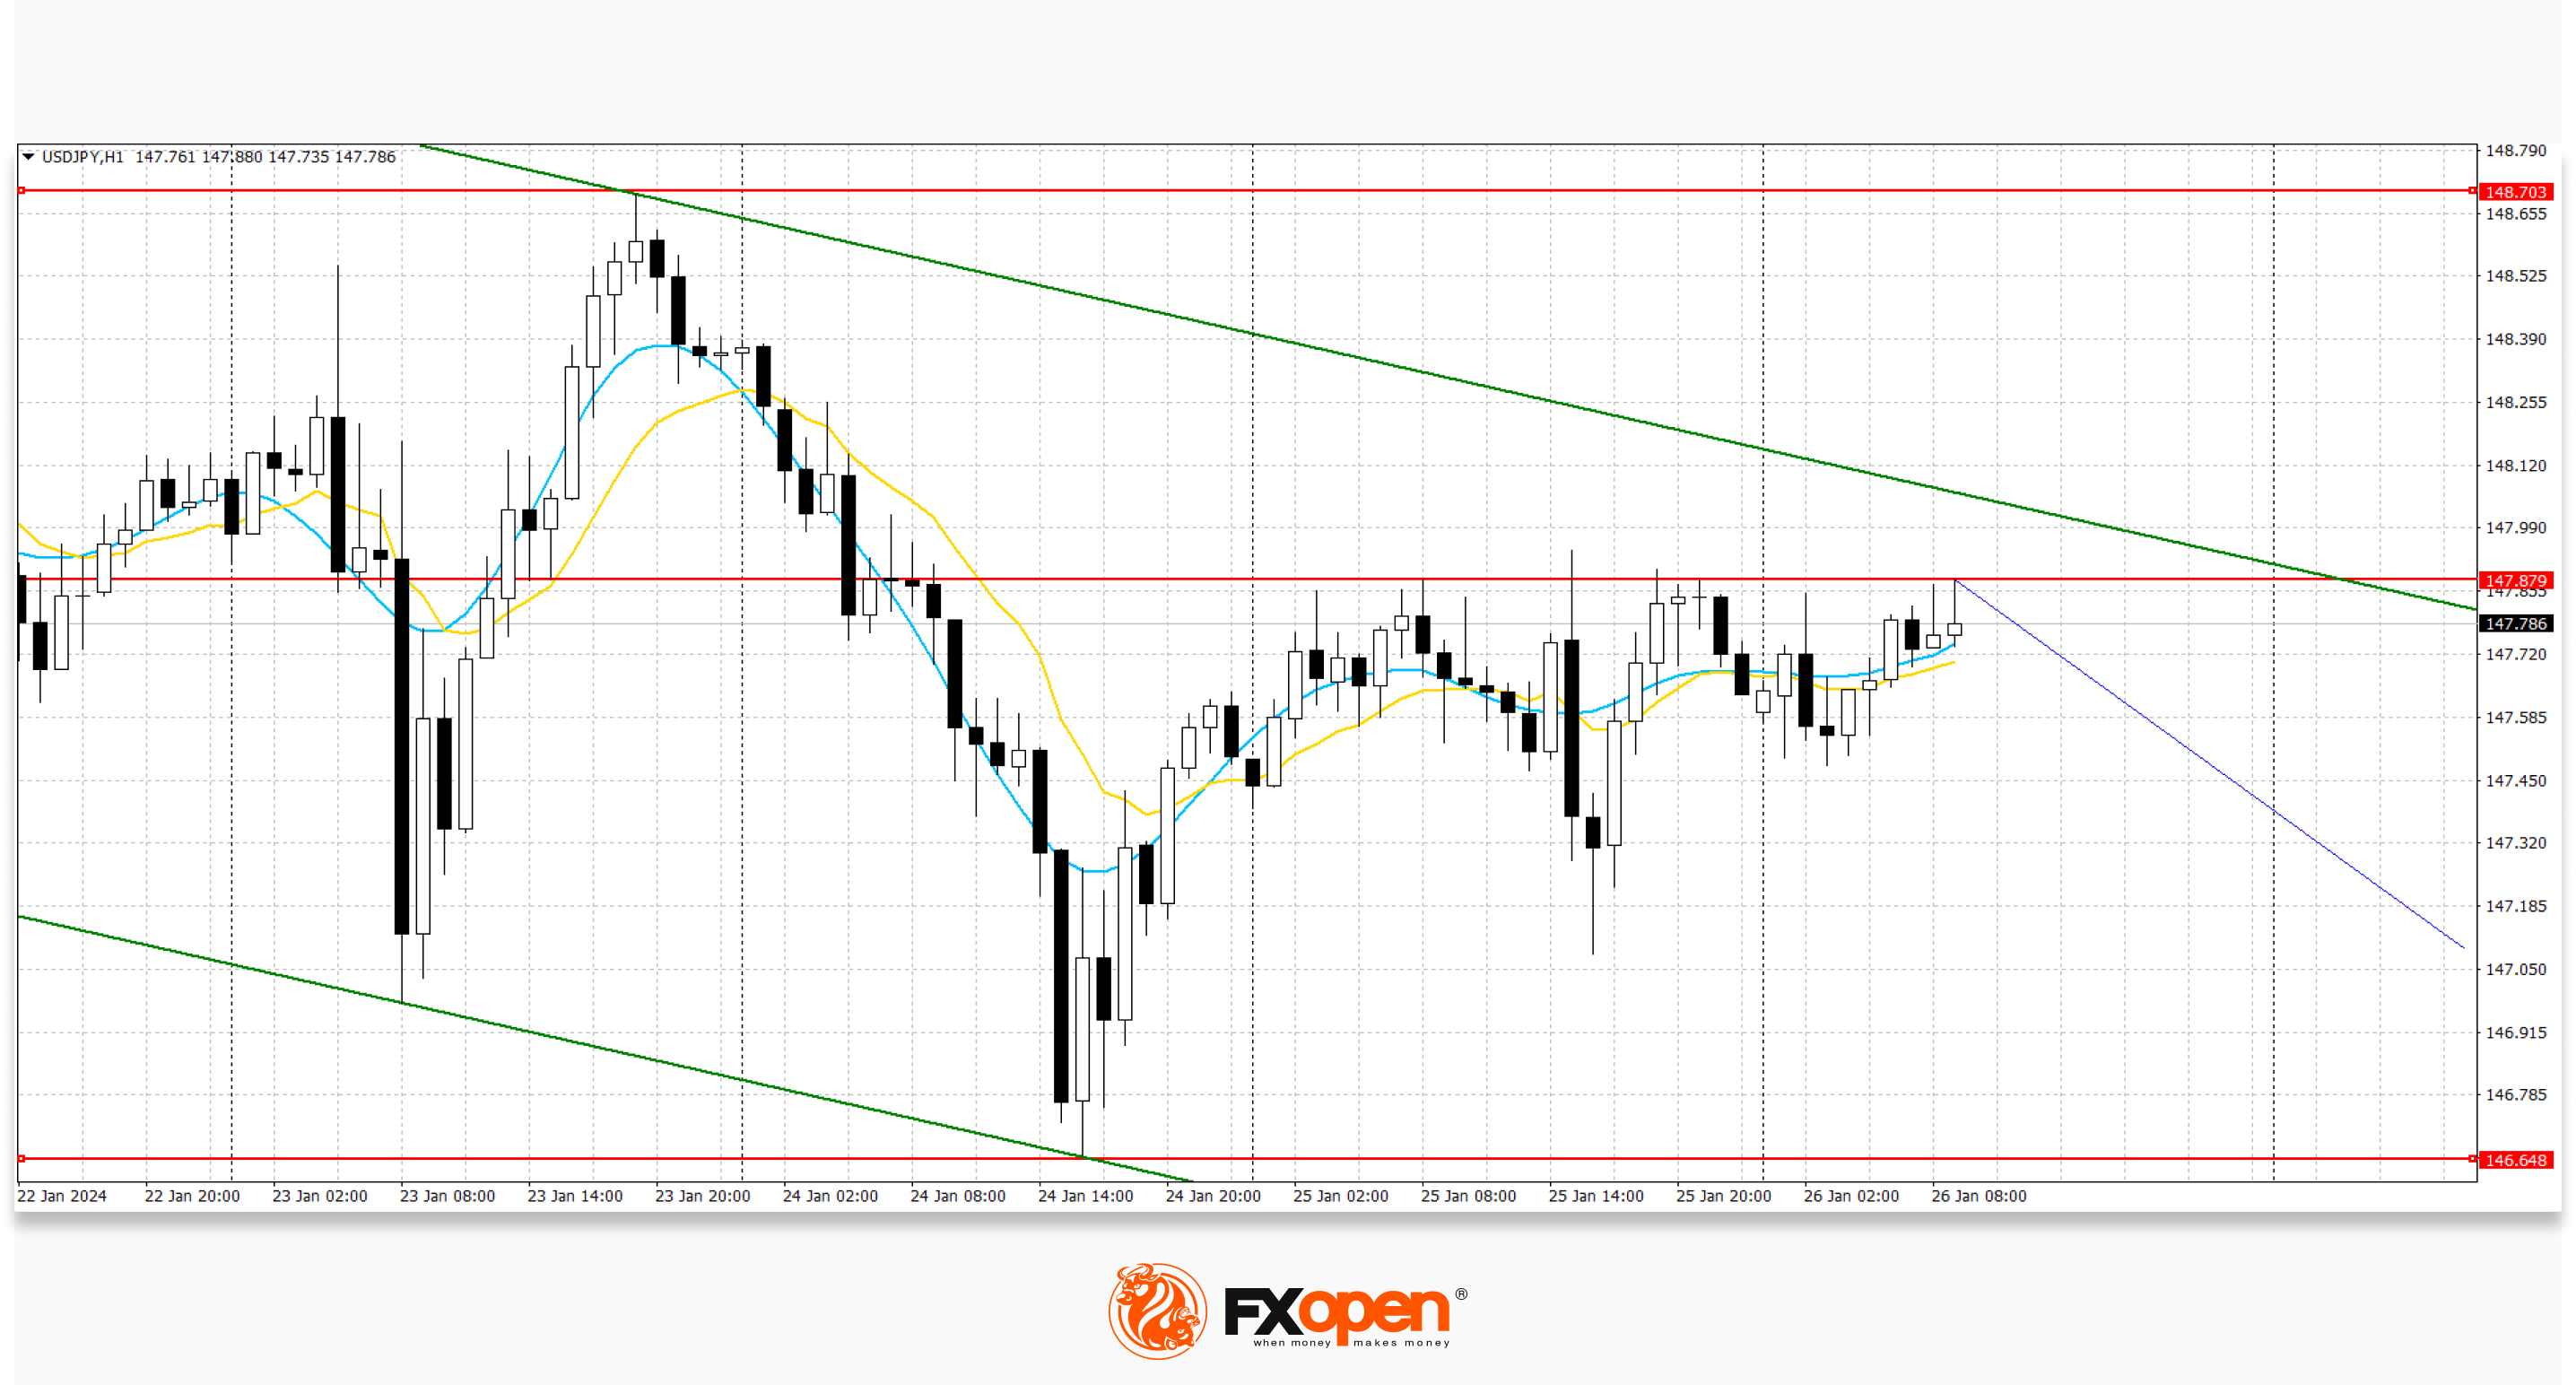
The downward channel is maintained. Now the price is approaching the upper border of the channel, from where it can continue to decline.
Trade over 50 forex markets 24 hours a day with FXOpen. Take advantage of low commissions, deep liquidity, and spreads from 0.0 pips (additional fees may apply). Open your FXOpen account now or learn more about trading forex with FXOpen.
This article represents the opinion of the Companies operating under the FXOpen brand only. It is not to be construed as an offer, solicitation, or recommendation with respect to products and services provided by the Companies operating under the FXOpen brand, nor is it to be considered financial advice.
Stay ahead of the market!
Subscribe now to our mailing list and receive the latest market news and insights delivered directly to your inbox.


Latest articles

Apple: Earnings Day Above the Activity Zone
On 30 April, after the market close, Apple Inc. will release its financial results for the second quarter of fiscal 2026. The consensus forecast, based on estimates from 31 analysts, points to revenue of around $109.7 billion, with expected

USD/JPY and USD/CHF Near Key Levels: The Dollar Supported by the Fed
The US dollar continues to trend upwards following the Federal Reserve meeting, drawing support from the regulator’s moderately hawkish stance and comments by Jerome Powell. Markets interpret the Fed’s rhetoric as a signal that restrictive policy is likely

EUR/USD and GBP/USD consolidate ahead of the Fed decision
European currencies are showing subdued dynamics, entering a consolidation phase following their previous advance. Earlier, EUR/USD and GBP/USD broke out of their ranges and strengthened; however, the subsequent correction has led both pairs to retest the previously breached