


USD/CAD, AUD/USD, EUR/USD Analysis: Commodity Currencies Testing Important Marks
FXOpen

The penultimate five-day trading period of the past year turned out to be quite successful for commodity currencies. Thus, the AUD/USD pair is approaching the July extremes of this year, the USD/CAD pair has broken through the support at 1.3400, and the NZD/USD pair has confidently strengthened above 62. At the same time, European currencies failed to move above strategic levels and are slightly adjusted against the dollar.
USD/CAD
The USD/CAD currency pair lost more than 200 pips last week and strengthened below the alligator lines on higher time frames. The likelihood of a change in the vector of monetary policy by the American Federal Reserve is contributing to the strengthening of the downward trend in the pair. Yesterday, data on the US consumer confidence index for December was published, showing positive dynamics: 110.7 versus 103.8. This fundamental impulse allowed the pair’s buyers to find support at 1.3310 and rebound to 1.3370, but so far no upward dynamics have been observed.
Today at 16:30 GMT+3, it is worth paying attention to the publication of US GDP data for the third quarter. Also, at this time, the core Canadian retail sales index for October will be published. In addition to the data already mentioned, weekly figures on the number of applications for unemployment benefits in the United States will be released.
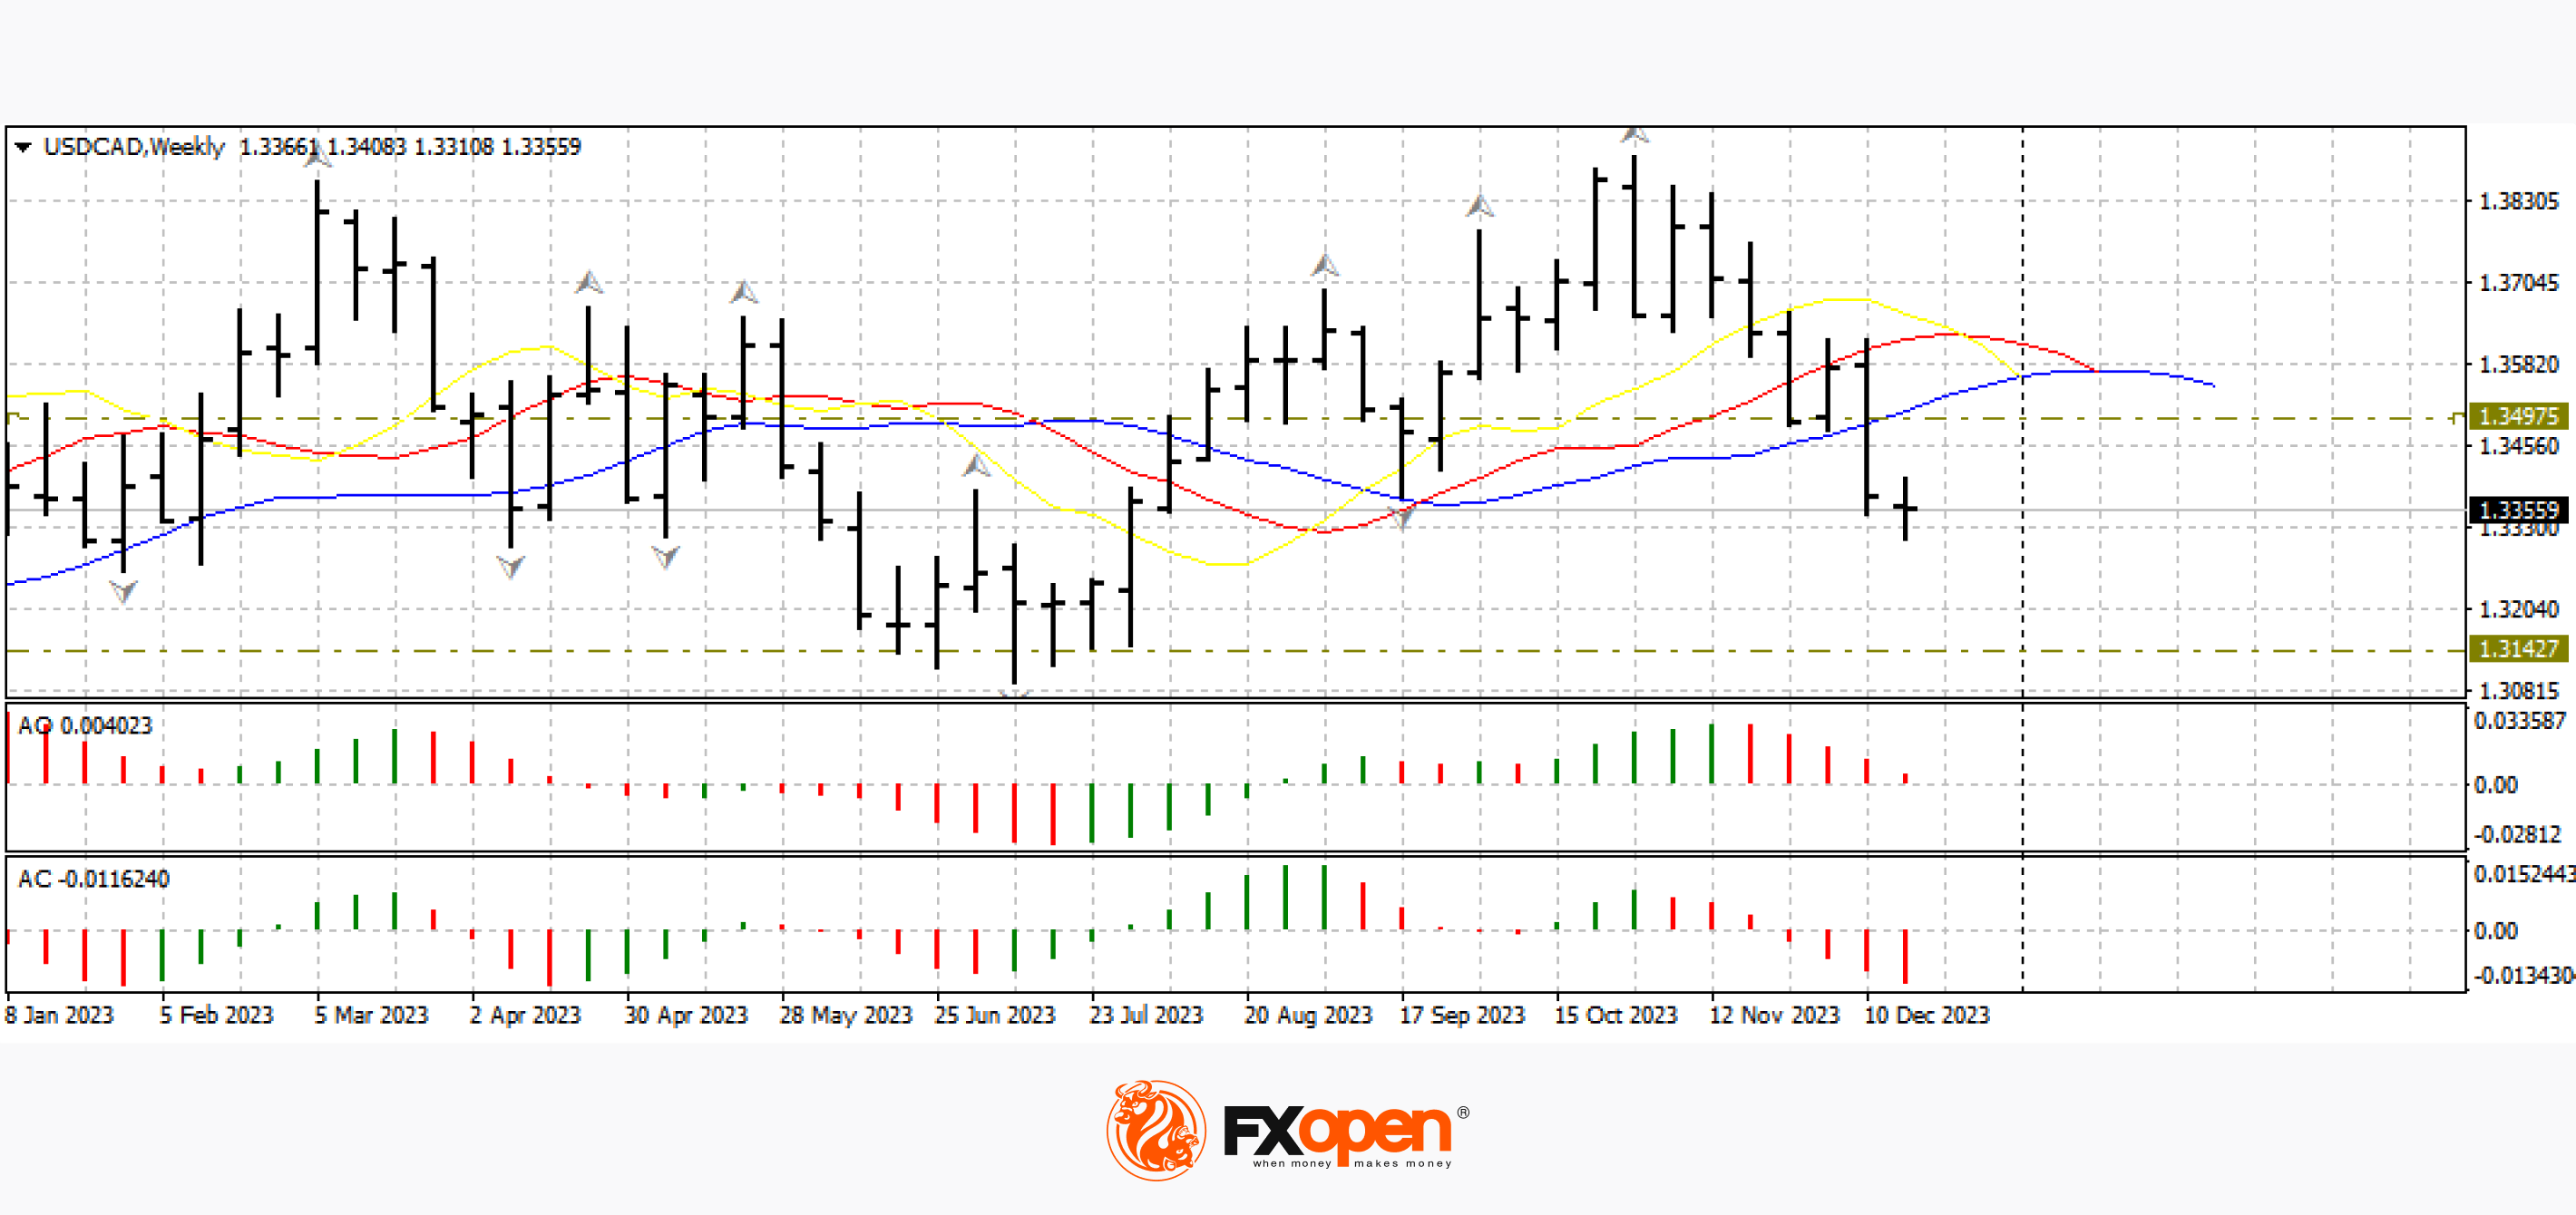
On the daily and weekly USD/CAD charts, the price is below the alligator lines, the AO and AC oscillators are red, which additionally indicates sales. The downward scenario may be cancelled if the price confidently consolidates above 1.3460-1.3500.
AUD/USD
The Australian currency strengthens for the second week in a row. Buyers of the pair came quite close to the July extremes of this year, which are located between 0.6800-0.6900. However, despite the sharp increase, a corrective decline to 0.6700-0.6600 cannot be ruled out.
Early tomorrow morning data on mortgage lending in Australia for November and reserve assets for the same period will be released.
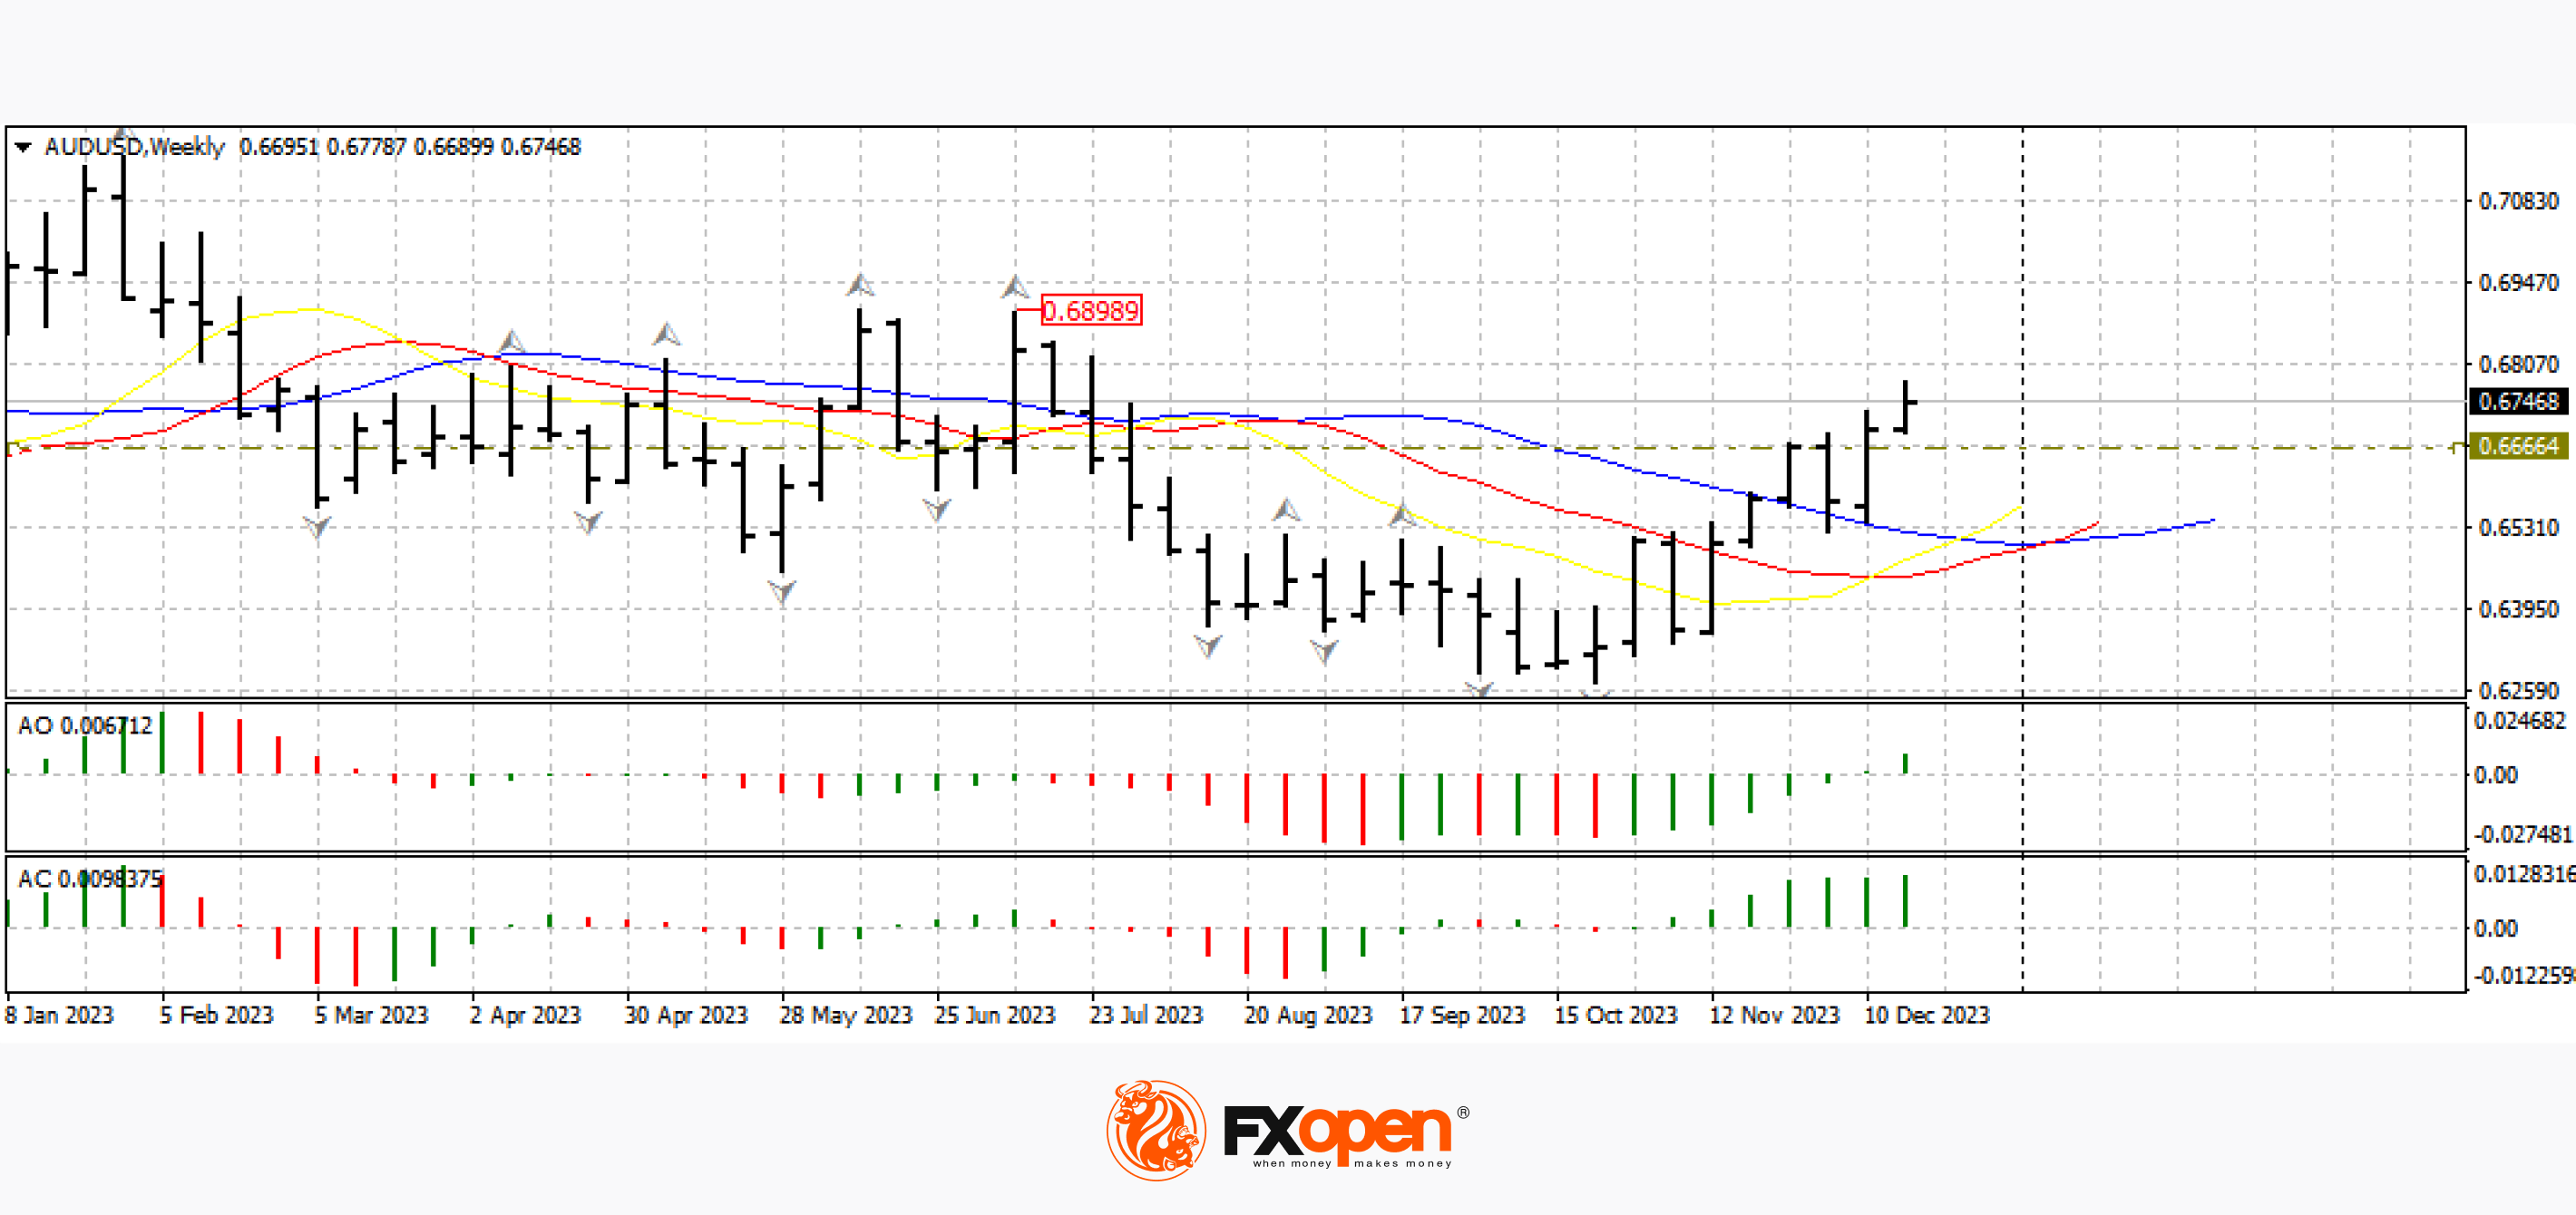
On the weekly AUD/USD chart, the price is above the alligator lines, the AO and AC oscillators are green, which may enhance the upward movement in the direction of 0.6800-0.6900.
EUR/USD
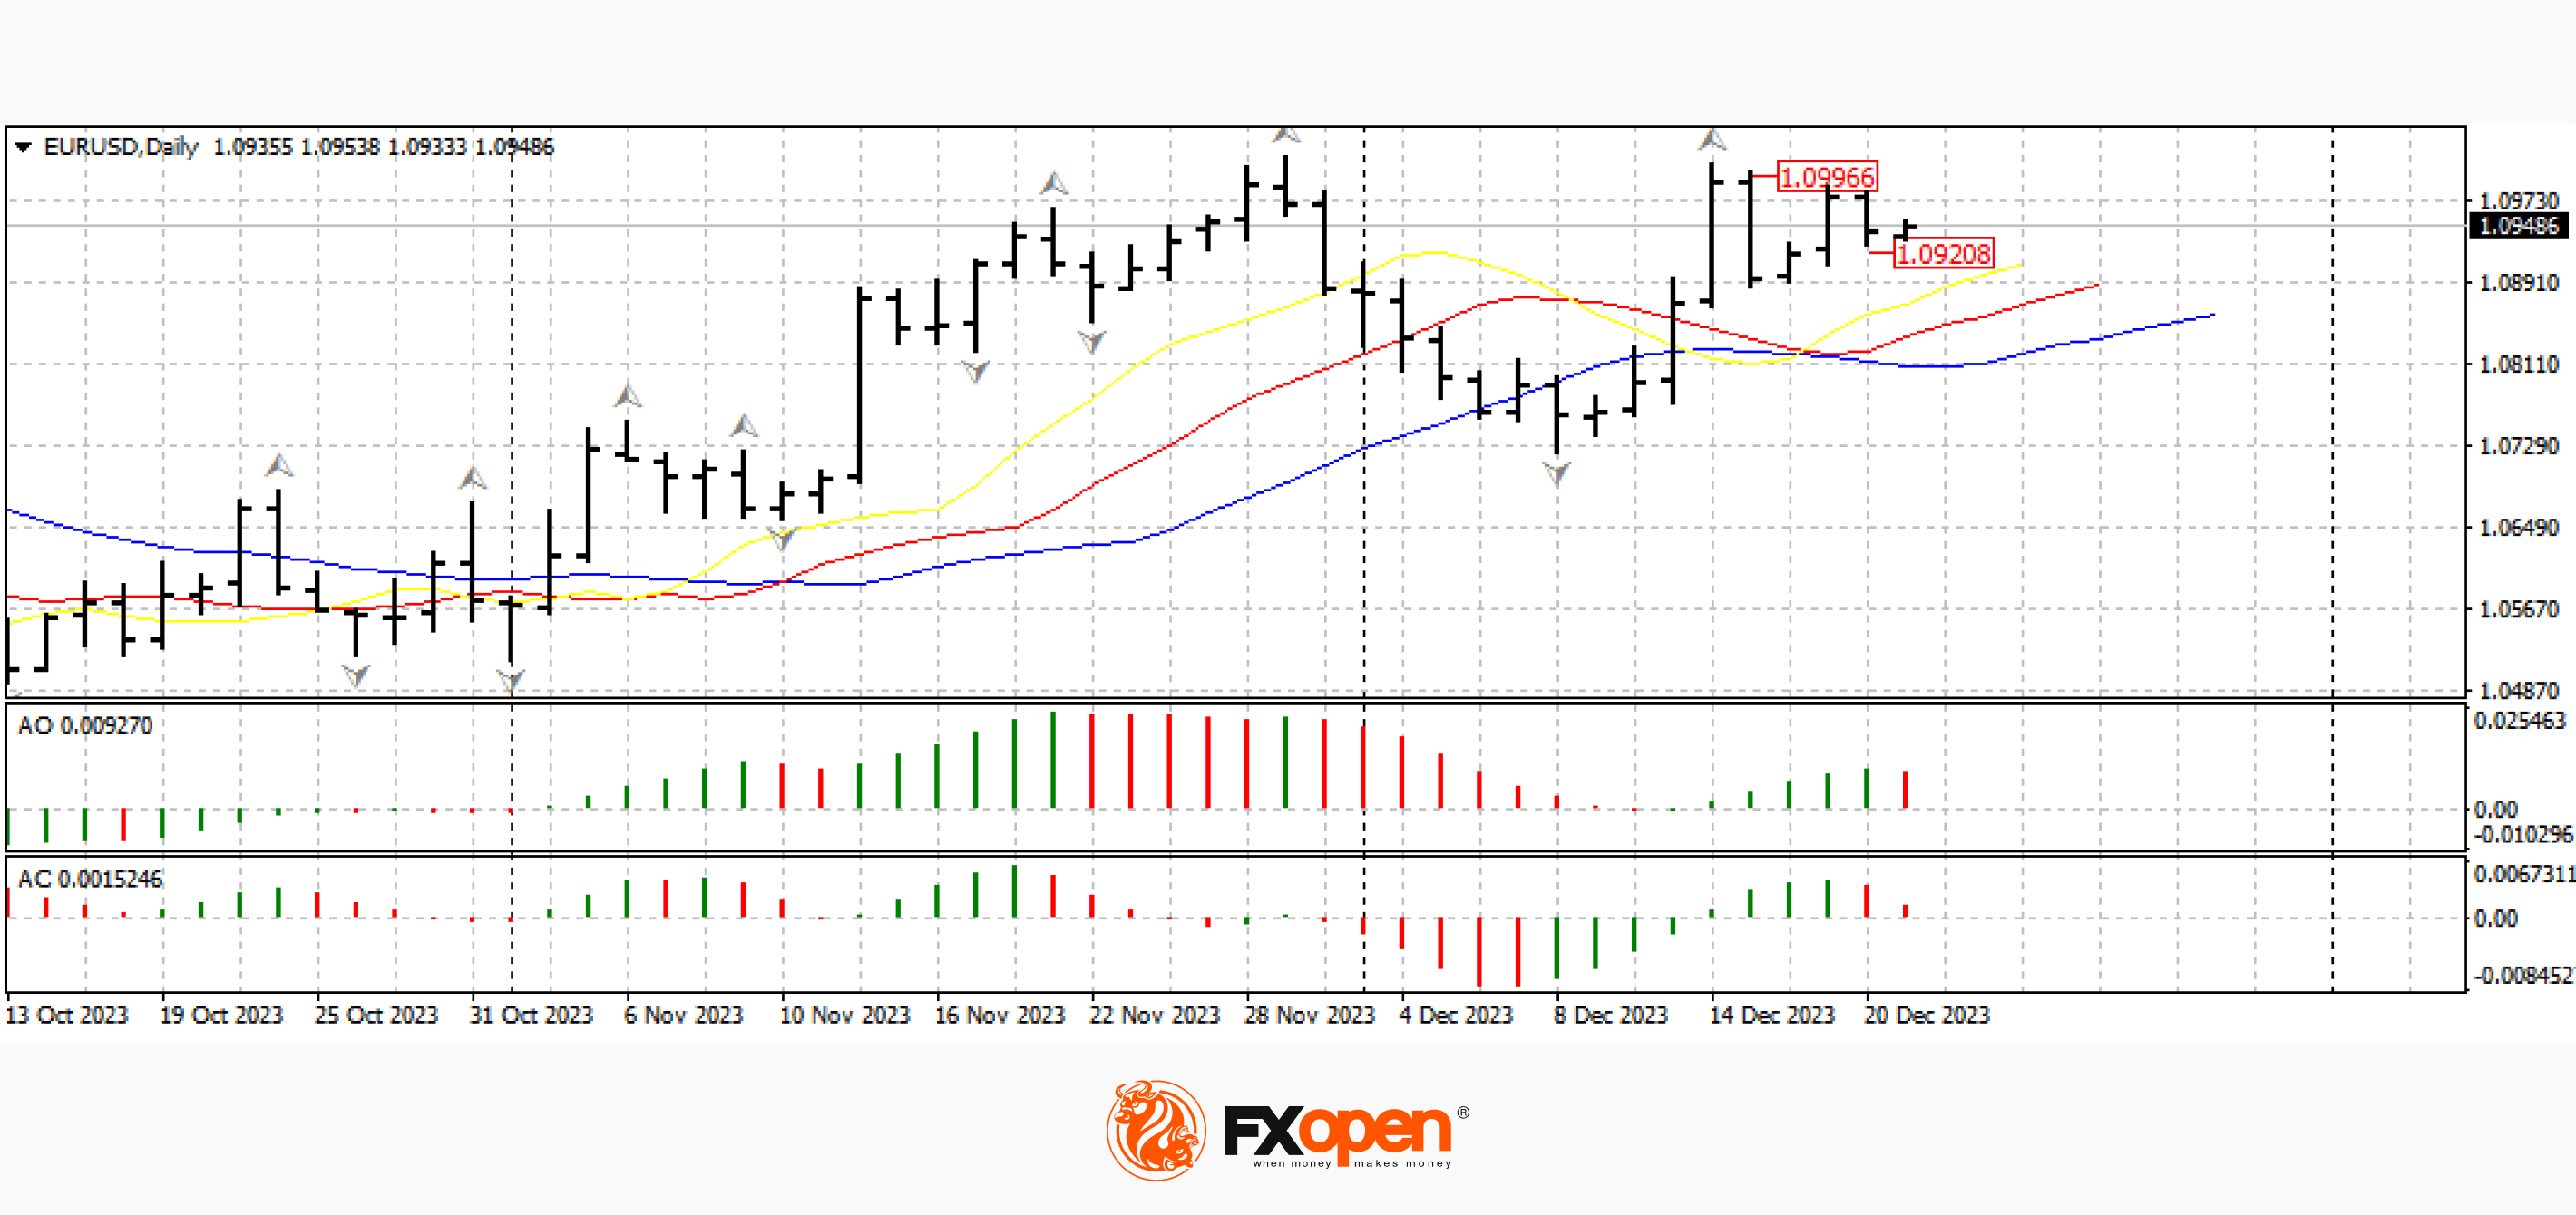
In the euro/dollar pair we are seeing a flat movement between 1.0920-1.0980. Today at 19:00 GMT+3, a speech is scheduled by ECB representative Philip Lane, and tomorrow at 12:00 GMT+3, data on the consumer confidence index in Italy and France will be published. It is quite possible that this fundamental data may contribute to an increase in volatility for the pair and beyond the indicated boundaries.
Trade over 50 forex markets 24 hours a day with FXOpen. Take advantage of low commissions, deep liquidity, and spreads from 0.0 pips (additional fees may apply). Open your FXOpen account now or learn more about trading forex with FXOpen.
This article represents the opinion of the Companies operating under the FXOpen brand only. It is not to be construed as an offer, solicitation, or recommendation with respect to products and services provided by the Companies operating under the FXOpen brand, nor is it to be considered financial advice.
Stay ahead of the market!
Subscribe now to our mailing list and receive the latest market news and insights delivered directly to your inbox.


Latest articles

Weekly Market Insights with Gary Thomson: The Week of Central Banks and Earnings
In this video, we’ll explore the key economic events and market trends, shaping the financial landscape. Get ready for insights into financial markets to help you navigate the week ahead. Let’s dive in!
In this episode of Market

Intel at a Crossroads: Earnings Beat Meets Technical Resistance
Intel has just delivered its strongest quarter in over fifteen years, and the market reaction says it all. Q2 2026 revenue surged 25% year-over-year to $16.1 billion, crushing the consensus estimate of $14.42 billion, while adjusted EPS of

Tesla: Complex Range Structure Breaks Down Following Quarterly Earnings
Tesla released its Q2 2026 results after the market closed on 22 July. Revenue increased 26% year-on-year to $28.24 billion, while vehicle deliveries reached a record 480,126 units. However, operating margin fell sharply to 1.4%, down from