


USD/CAD, GBP/USD, and EUR/USD Analysis: Major Currency Pairs in Consolidation Phase
FXOpen
Despite higher than expected NFP figures, published last week, the US dollar suffered a downward pullback. Thus, the pound/US dollar pair retested support at 1.2600 and sharply rose above 1.2700, the US dollar/loonie pair fell to 1.3290, and the euro/US dollar pair managed to briefly return to 1.1000. At the same time, it was not possible to develop a full-fledged downward movement, and since the beginning of the current five-day trading period, the main currency pairs continue to trade in narrow flat corridors.
USD/CAD
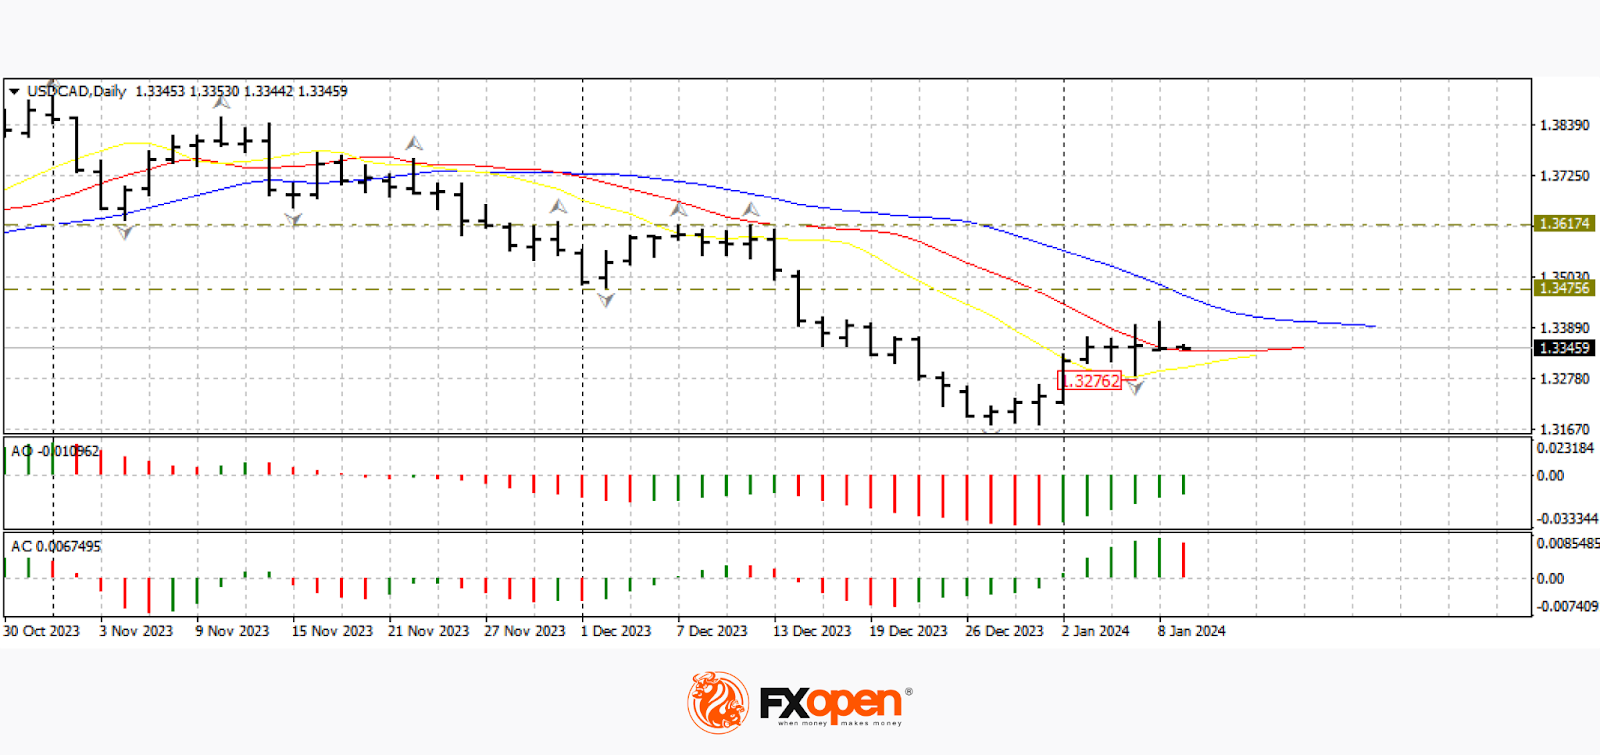
On the daily chart of USD/CAD, the upward pullback, which we observed on December 27, was interrupted on Friday by a sharp rebound from the resistance in the form of intertwined alligator lines. The price retreated from 1.3400, but managed to remain above 1.3300, which may increase the likelihood of a resumption of upward movement. Cancellation of the upward scenario can be considered after a confident consolidation below 1.3270.
Today at 16:30 GMT+3, it is worth paying attention to the publication of data on the trade balance and permits for the construction of new houses in Canada for December. Tomorrow at 18:30 GMT+3, data on crude oil reserves in the United States will be released.
GBP/USD
On the GBP/USD chart, sellers of the British currency tried unsuccessfully last week to break the support at 1.2600. The price bounced up over and over again, and after the publication of a report on the labour market in the United States, it even managed to strengthen by more than 150 pips. After the rollback, the price managed to remain above 1.2700, but no confident upward dynamics have been observed yet.
Today at 13:00 GMT+3, there will be an auction of twenty-year UK Treasury bonds. Bank of England Governor Andrew Bailey is scheduled to speak tomorrow at 17:15 GMT+3.
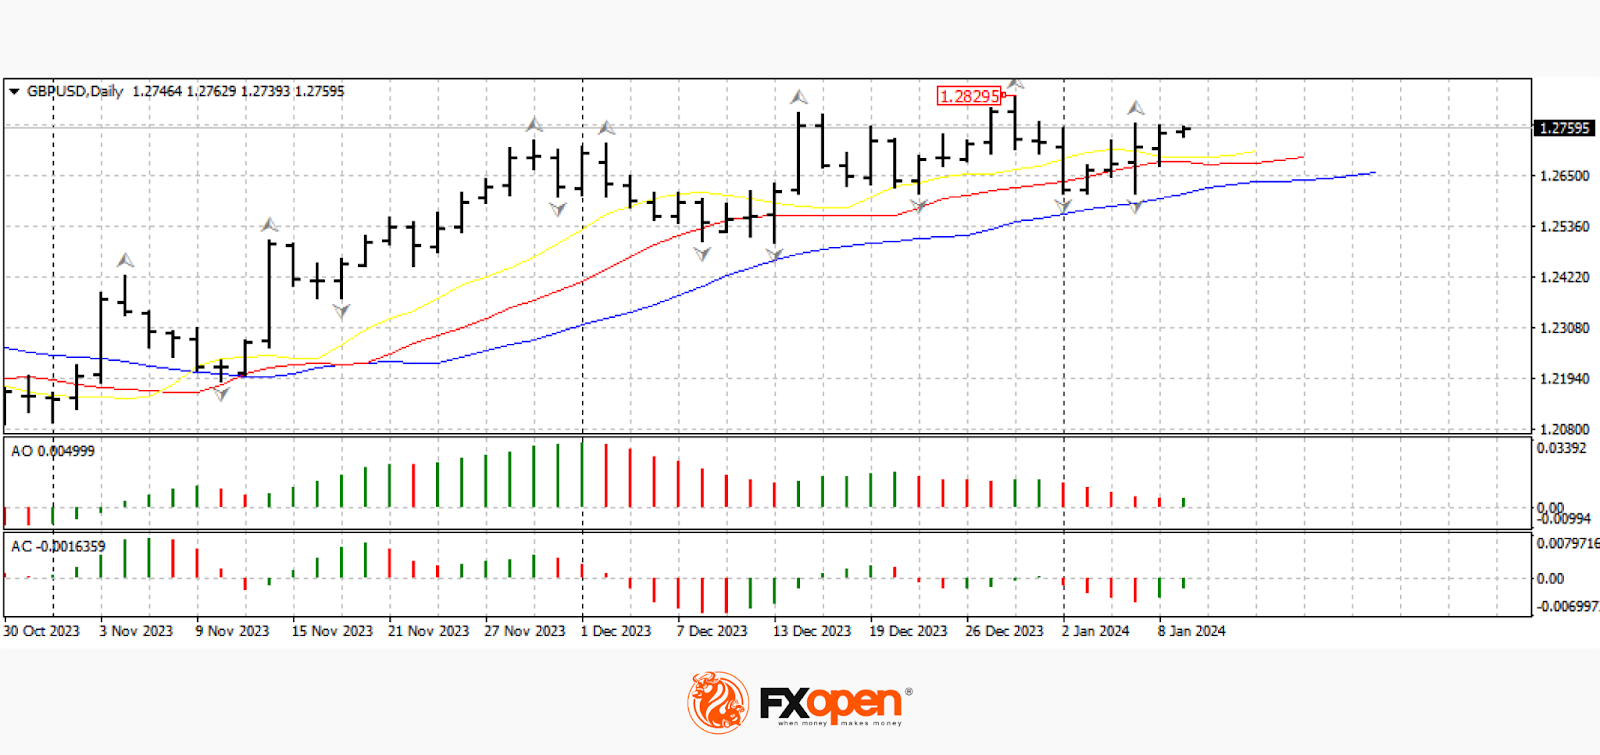
According to the chaos technical strategy, the price is above the alligator lines on the daily timeframe; if the price breaks the upper fractal, it may rise further. The condition for cancelling the upward scenario may be a move below 1.2600.
EUR/USD
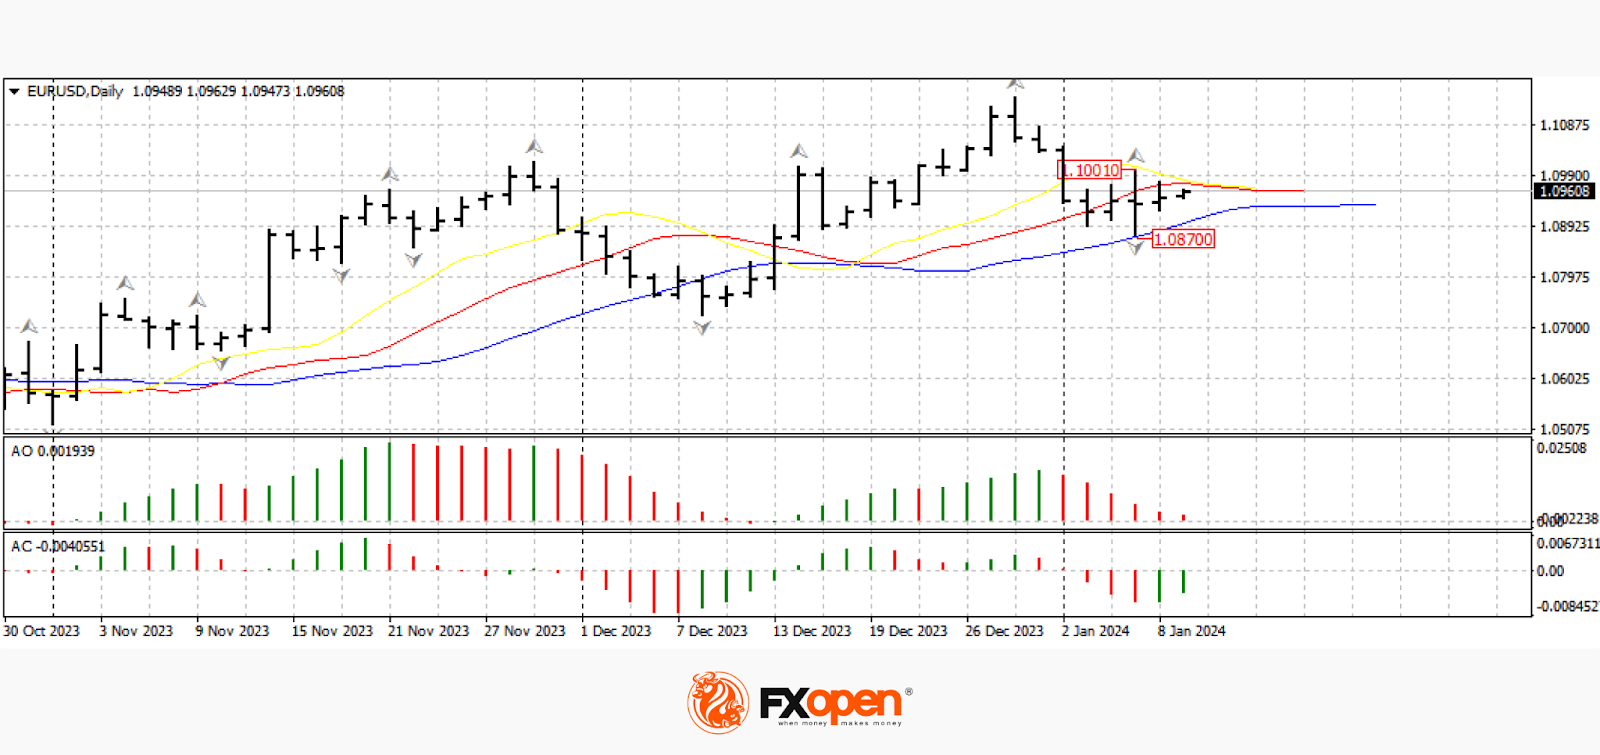
On Friday, the single European currency interrupted its almost continuous weekly decline and rebounded to important resistance at 1.1000. So far, the pair’s buyers have not managed to gain a foothold above the mentioned level. According to the EUR/USD technical analysis, as long as the price remains above 1.0900, the probability of a retest of 1.1000 may be high.
Important for the pair’s pricing will be data on the unemployment rate in the eurozone for December; publication of the indicator is scheduled for 13:00 GMT+3. It is also worth paying attention to the volume of imports and exports to the United States, which will be published at 16:30 GMT+3.
Trade over 50 forex markets 24 hours a day with FXOpen. Take advantage of low commissions, deep liquidity, and spreads from 0.0 pips (additional fees may apply). Open your FXOpen account now or learn more about trading forex with FXOpen.
This article represents the opinion of the Companies operating under the FXOpen brand only. It is not to be construed as an offer, solicitation, or recommendation with respect to products and services provided by the Companies operating under the FXOpen brand, nor is it to be considered financial advice.
Stay ahead of the market!
Subscribe now to our mailing list and receive the latest market news and insights delivered directly to your inbox.


Latest articles

AI Valuations Are Back in the Spotlight
Artificial intelligence remains the dominant investment theme of 2026, but investors are increasingly questioning whether AI stock valuations are keeping pace with reality.
💰 Big Tech continues to invest at an unprecedented scale, with hyperscaler AI spending projected to exceed $800

AUD/CAD: Months of Indecision — Is a Breakout Finally Coming?
The Australian dollar has clawed back most of its end-of-June losses, when it touched three-month lows against the greenback amid escalating Middle East tensions. Since then, sentiment has improved: the RBA's Assistant Governor Sarah Hunter signalled the board stands ready

USD/JPY: Battling at the Top of the Triangle
On 3 July, Japan's Finance Minister, Satsuki Katayama, stated that the Ministry of Finance remains in close contact with US authorities regarding developments in USD/JPY as the yen traded near its weakest level in almost 40 years. Similar verbal