


Shooting Star Pattern: Basics and Trading Approaches
FXOpen
Candlestick patterns can reveal a lot about market sentiment and potential price movements. One pattern that often catches traders’ attention is the shooting star. Recognisable by its small body and long upper shadow, the shooting star trading pattern signals that buyers tried to push prices higher but sellers regained control, hinting at a possible reversal. This article will delve into what a shooting star pattern is, how to spot it on a chart, its associated trading strategies, and its distinctions from similar patterns.
What Is a Shooting Star?
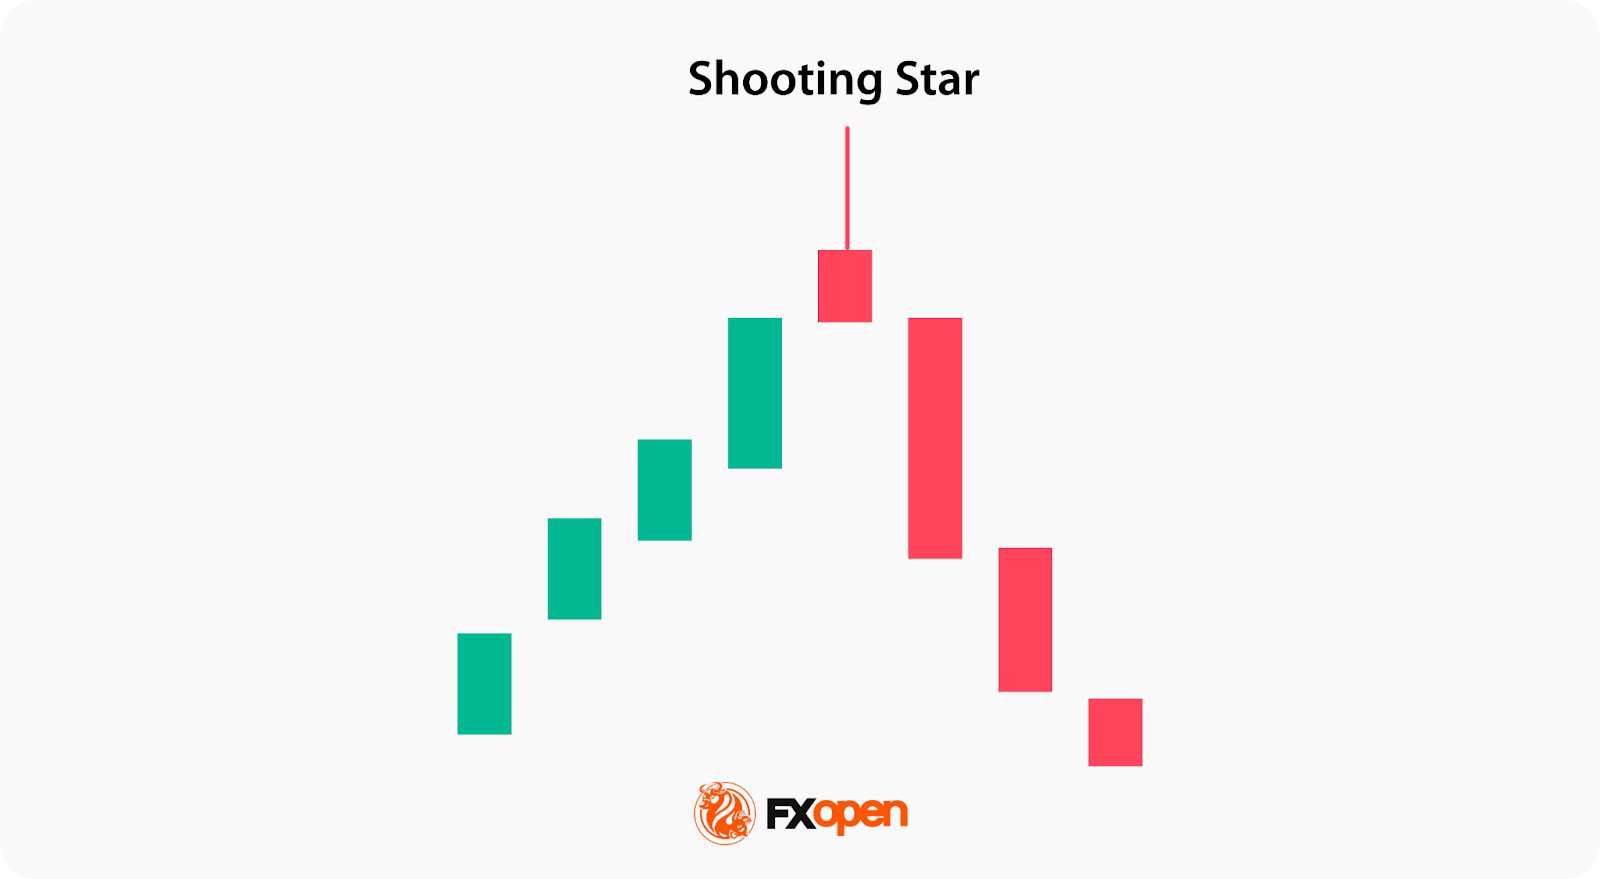
A shooting star in trading is a bearish candlestick pattern that can signify a potential reversal of an uptrend. It consists of a single candlestick with the following characteristics:
- A small body that is located at the lower end of the candlestick.
- A long upper shadow that is at least twice the length of the candle's body.
- A short or nonexistent lower shadow.
The appearance of the setup suggests that the price opened near its low and rallied significantly during the trading session but ultimately closed near its opening price. This pattern indicates sellers regained control after a brief period of bullishness.
While the formation is considered more probable when it closes red, it’s possible to see a green shooting star. A green shooting star candlestick simply indicates that sellers weren’t able to push the price down quite as aggressively.
How May You Trade the Shooting Star?
The shooting star trading strategy involves the following points:
- Entry: After identifying the candle in the strong uptrend, consider entering a short position. To validate the pattern, you may wait for the next one or two candles to close below the shooting star.
- Take Profit: Although candlestick patterns don’t provide specific entry and exit points, you may use common technical analysis techniques. For example, you might set a take-profit level based on the support level, Fibonacci retracement level, or nearest swing lows.
- Stop Loss: You may want to protect your position with a stop-loss order. This is usually placed above the high price of the shooting star.
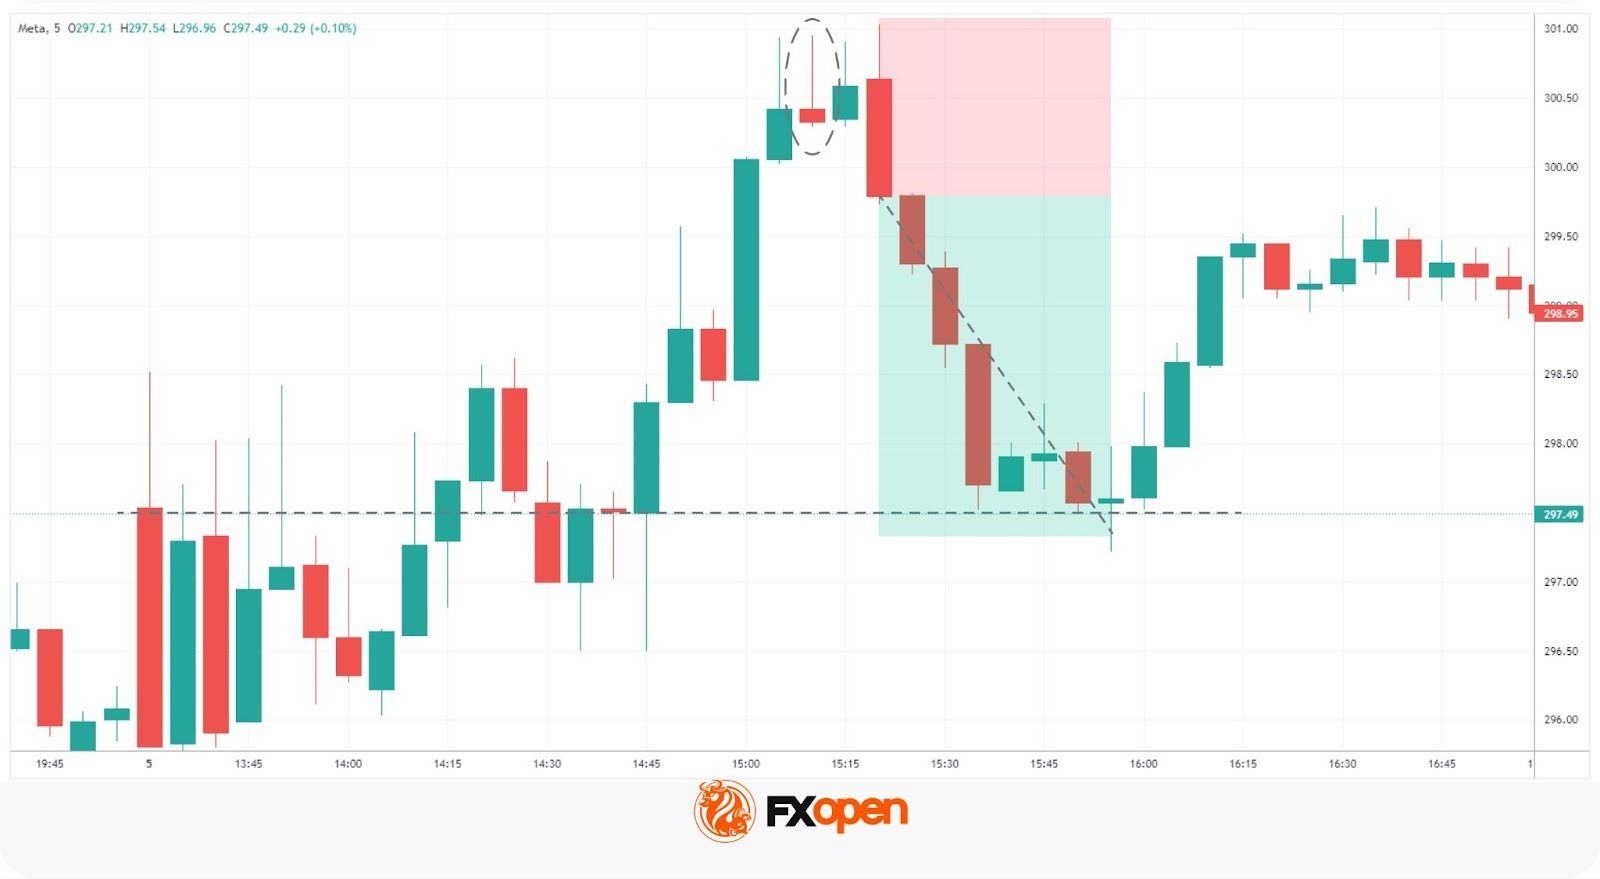
Let's consider a live market example of a shooting star in the stock market to illustrate the concept. A trader analyses the Meta stock chart on the TickTrader platform by FXOpen and spots a shooting star stock pattern after an extended uptrend. They wait for confirmation, i.e. for the next bar to close lower. Upon confirmation, they decide to enter a short trade, setting their take-profit target at a significant support level and placing a stop loss above the formation’s high.
How Traders Confirm the Shooting Star Signals
Confirming the shooting star pattern's reliability involves a multifaceted approach. Traders look beyond the candlestick itself, integrating various technical analysis tools to validate signals.
Confirmation methods include:
- Volume Analysis: A high trading volume accompanying the shooting star candlestick pattern can strengthen the signal, indicating that the reversal is supported by significant market participation.
- Subsequent Candles: Traders usually observe the next few candles for bearish confirmation. A strong bearish candle following the shooting star suggests that sellers are gaining momentum.
- Technical Indicators: Indicators can offer confirmatory signals, particularly momentum indicators like the Relative Strength Index (RSI) and Stochastic Oscillator. A moving average crossover can also add confluence.
- Resistance Levels: The proximity of the shooting star to established resistance levels may contribute to its significance. A shooting star forming near a resistance zone often signals a strong reversal point.
- Above Swing High: A shooting star pattern that breaks into the area just above a key high or low before reversing can signal a liquidity grab.
- Contextual Analysis: The broader market context, such as prevailing trends and economic news, can influence the pattern's signals. Aligning the shooting star with broader market sentiment increases the pattern’s reliability.
Shooting Star and Other Candlestick Formations
Let's compare the shooting star with other patterns with which it is often confused.
Shooting Star vs Inverted Hammer
The shooting star and inverted hammer look similar – they have small bodies and long upper shadows. However, they differ in their implications. The former is a bearish reversal pattern found in uptrends, while the latter is a bullish reversal formation seen in downtrends.

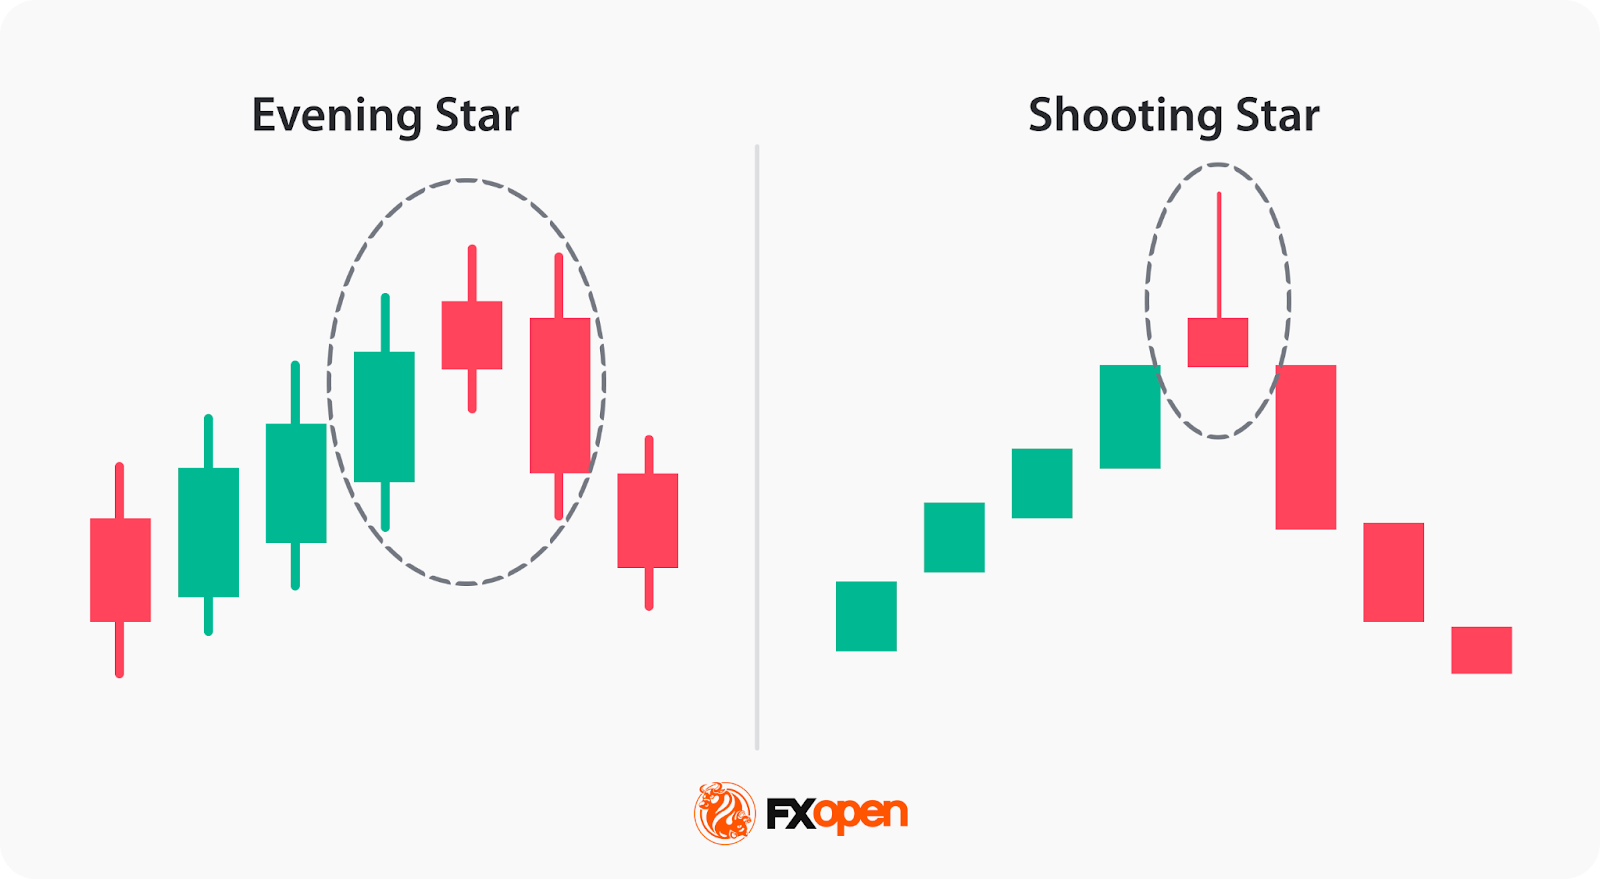
Shooting Star vs Evening Star
Both formations signal an uptrend reversal; however, the shooting star is a single-candle setup, whereas the evening star consists of three candles, including a large bullish candle, a small-bodied candle, and a large bearish candle.
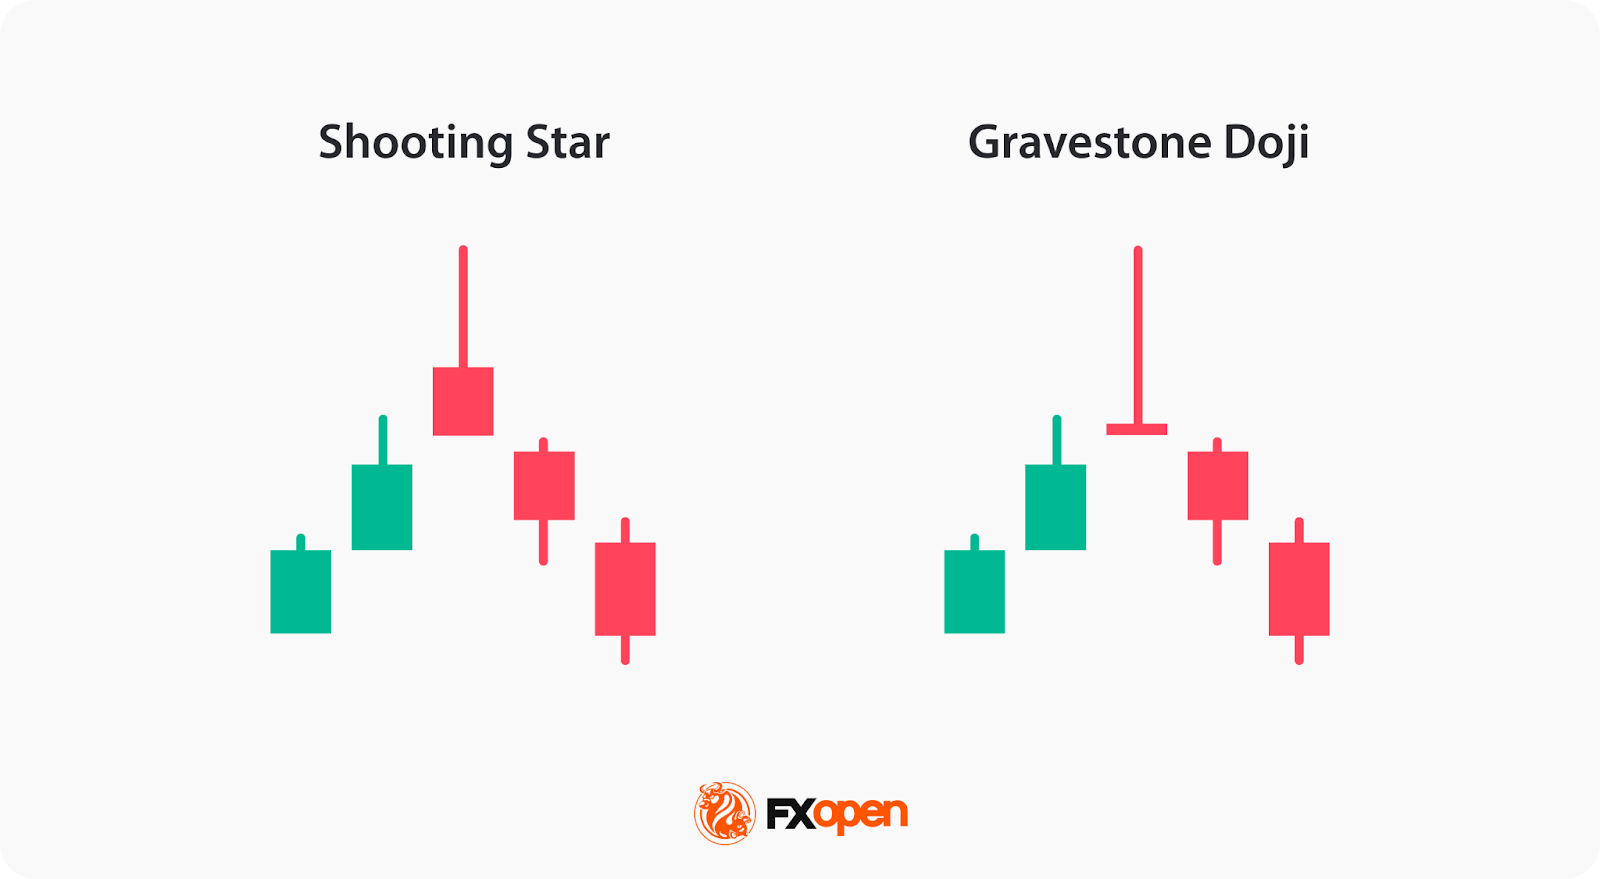
Shooting Star vs Gravestone Doji
The shooting star and gravestone doji are both bearish reversal patterns. The shooting star features a small body at the lower end of the candlestick with a long upper shadow, signifying a failed rally.
In contrast, the gravestone doji has no or a tiny real body, as the open and close prices are identical or nearly identical, with a long upper shadow and no lower shadow. The gravestone doji suggests strong indecision in the market, with buyers initially driving prices up but ultimately failing to maintain that momentum, which often signals a sharp reversal.
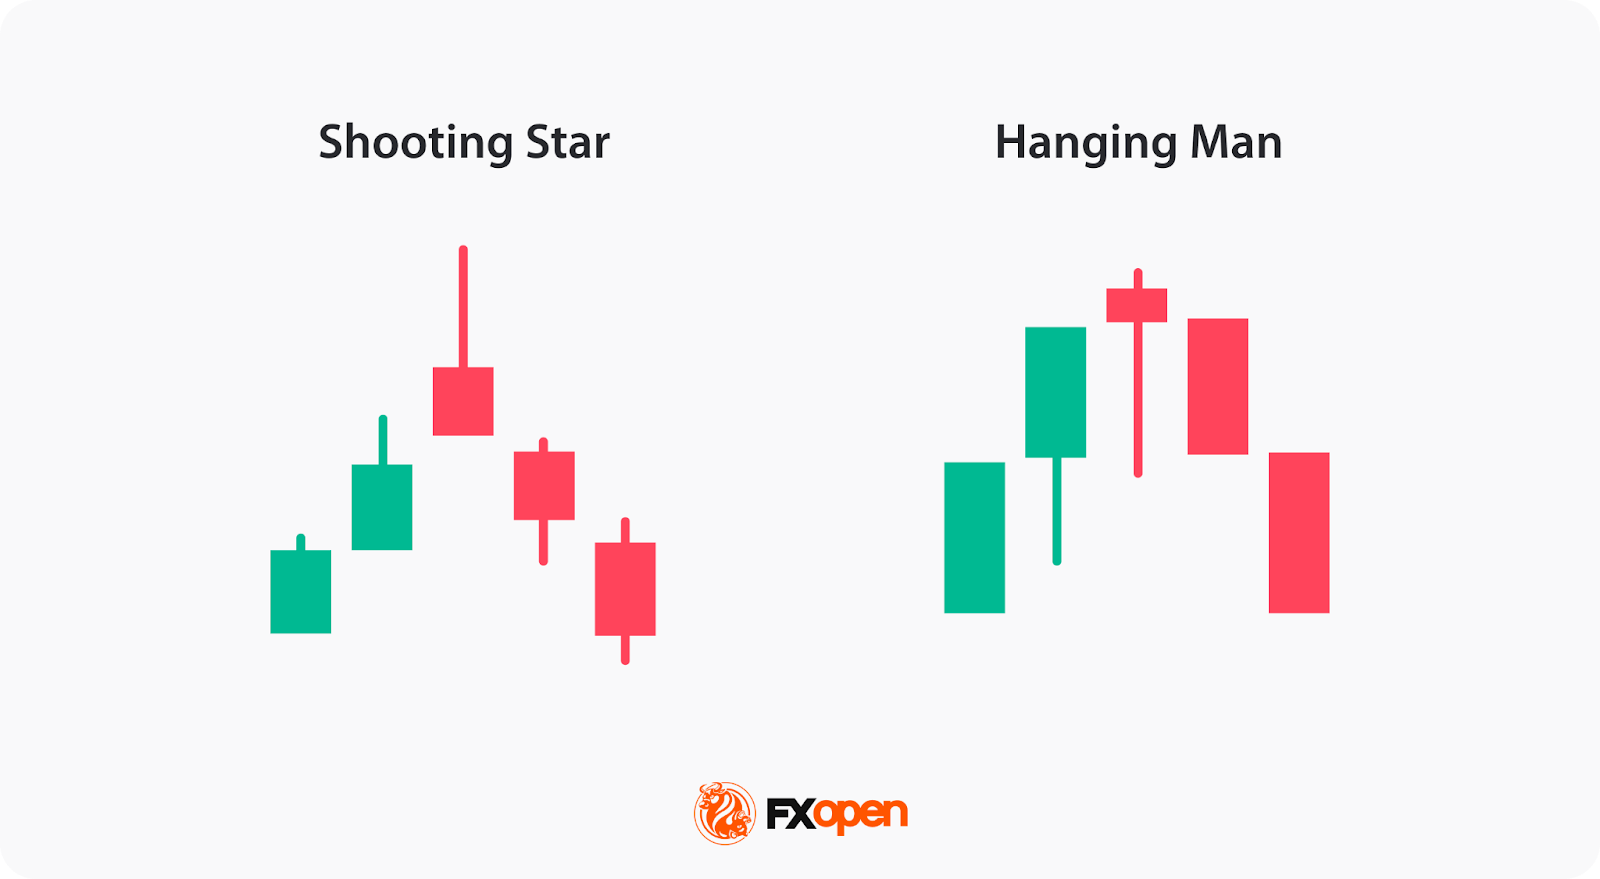
Shooting Star vs Hanging Man
The shooting star and hanging man also share similarities but differ in appearance and market positioning. The shooting star is a bearish pattern occurring after an uptrend, indicating a potential reversal as bears managed to pull the price down at the end of a trading session.
Conversely, the hanging man appears at the top of an uptrend as well but has a small body at the upper end and a long lower shadow, reflecting that sellers were able to push the price down significantly before buyers pulled it back up. The hanging man suggests that selling pressure is starting to outweigh buying interest.
Advantages and Limitations
This formation offers traders valuable insights, but it comes with its own set of advantages and limitations. Understanding these may help traders use the pattern within their strategies.
Advantages
- Early Reversal Signal: It provides an early indication of a potential trend reversal, allowing traders to prepare for or act on a change in market direction.
- Simplicity: The pattern is straightforward to identify, even for less experienced traders, making it an accessible tool for technical analysis.
- Versatility: It can be applied across various markets and timeframes, with traders often spotting the shooting star in forex, stock, and commodity markets as well as across both short-term and long-term charts.
Limitations
- False Signals: The pattern alone is not always reliable and can generate false signals, especially in volatile markets or when not used with other confirmation tools.
- Lack of Precision: It does not provide exact entry or exit points, requiring traders to rely on additional indicators or analysis to determine these.
- Dependency on Context: The pattern’s signals are highly dependent on the broader market context and trend strength, limiting its standalone use.
Final Thoughts
Understanding candlestick patterns such as the shooting star is a fundamental part of technical analysis. Although this pattern can signal potential market reversals, traders typically use it alongside other technical indicators to confirm trading signals. Staying informed about market trends and continuously refining analytical skills may help traders in today’s fast-moving trading environment.
If you want to explore over 700 markets, you can consider opening an FXOpen account and trade with tight spreads from 0.0 pips and low commissions from $1.50.
FAQ
Can Candlestick Patterns Be Time-Sensitive?
Yes, candlestick patterns vary depending on the timeframe. A shooting star on a 1-minute chart provides short-term signals, while a shooting star on a daily chart may signal a longer-term reversal. However, the choice of timeframe goes hand in hand with your market strategy and goals.
Is It Possible to Improve Candlestick Pattern Recognition Skills?
Improving your candlestick pattern recognition skills requires practice and study. You can analyse historical charts, use trading simulators, read analytical materials like those at FXOpen, and engage with experienced traders to gain insights and practical experience.
Why Are Candlestick Patterns Important in Trading?
Candlesticks visually represent price action and may help traders identify potential trend reversals, continuations, and key support and resistance levels. They are valuable tools for technical analysis.
What Is the Meaning of a Shooting Star Pattern?
The shooting star pattern is a bearish reversal candlestick that forms after an uptrend. It signals a potential shift in market sentiment, where buyers initially drive the price higher, but sellers take over, pushing the price back down near its opening level.
Is a Shooting Star Candlestick Bullish?
No, a bullish shooting star does not exist. It is a bearish pattern, indicating that an uptrend may be losing momentum and that a reversal to the downside could be imminent. A similar bullish formation is the inverted hammer.
Is a Shooting Star a Doji?
A shooting star is not a doji. While both patterns can signal reversals, a doji has nearly identical opening and closing prices with no significant body, reflecting indecision, whereas a shooting star has a small body with a long upper shadow, indicating a failed rally.
How May Traders Use a Shooting Star Candle?
Trading this candle involves looking for confirmation of the reversal, such as a bearish candle following the pattern. Traders often set stop-loss orders above the shooting star's high and take-profit levels near key support zones or previous lows.
This article represents the opinion of the Companies operating under the FXOpen brand only. It is not to be construed as an offer, solicitation, or recommendation with respect to products and services provided by the Companies operating under the FXOpen brand, nor is it to be considered financial advice.
Stay ahead of the market!
Subscribe now to our mailing list and receive the latest market news and insights delivered directly to your inbox.


Latest articles

Pound Weakens After Soft UK Inflation Data as Euro Awaits Fresh Market Signals
The pound remains under pressure following the release of weaker-than-expected UK inflation data. The slowdown in inflation has strengthened expectations that the Bank of England could adopt a more accommodative policy stance in the coming months, weighing on sterling. Meanwhile,

Alphabet: Record Profit as Markets Await Their Verdict
On 22 July, Alphabet reported its Q2 2026 results, with revenue rising 24% year-on-year to $119.8 billion. Google Cloud revenue surged 82% to $24.77 billion, comfortably exceeding analysts' expectations. Search advertising generated $63.3 billion in revenue (+17%

NZD/USD Analysis: A Tug-of-War at the Critical Level
The kiwi has strengthened meaningfully against most peers this month. However, against the US dollar specifically, NZD/USD remains well below its 2026 highs, trading in the mid-0.58 area versus January's peak near 0.6075.
New Zealand's Q2 inflation