


Simplified Technical Analysis in Stocks
FXOpen
In the ever-evolving landscape of stock trading, the art of technical analysis stands as a powerful tool, guiding investors and traders through the complex terrain of the financial markets. It's a discipline rooted in the examination of historical price and volume data, aiming to forecast future stock price movements based on patterns, trends, and market psychology. As we delve into the realm of technical analysis in stocks, this FXOpen article will shed light on the principles, strategies, and tools that empower traders and investors to decipher the intricate language of the stock market, ultimately making well-informed decisions to navigate the world of equities.
What Is Technical Analysis?
Technical analysis examines the historical price and volume data of financial assets, such as stocks, currencies, or commodities. This analysis aims to forecast future price movements based on patterns and trends observed in the historical data. It operates under the assumption that historical price and volume information can offer insights into future market behaviour.
Technical analysis doesn't concern itself with the intrinsic value of an asset, as fundamental analysis does, but rather focuses on how market participants' collective actions drive price changes.
Key Principles
Key principles of technical analysis include:
- Market Discounts: This principle asserts that all available information is already reflected in the price of an asset. Therefore, it focuses on analysing historical price data to identify trends.
- Trend Analysis: It assumes that prices tend to move in trends, either upward (bullish), downward (bearish), or sideways. Identifying and following these trends is crucial in technical analysis.
- History Tends to Repeat Itself: Historical price patterns and trends tend to repeat due to human psychology and market behaviour.
The Efficient Market Hypothesis (EMH) is a theory that suggests it's impossible to consistently achieve higher-than-average returns by using any form of analysis, including technical analysis. It posits that all available information is already incorporated into current asset prices, making it challenging to outperform the market consistently.
Bottom-Up Analysis
Bottom-up analysis is an investment approach that places its primary emphasis on individual assets. In this methodology, analysts and investors delve deeply into the specific fundamentals and technical aspects of a particular security to make investment decisions. Instead of looking at broader economic trends, bottom-up analysis revolves around studying the financial health, management, competitive position, and growth prospects of the company issuing the security.
This strategy is often attractive to investors with a long-term perspective who prioritise holding their assets over extended periods. For instance, an investor might come across a stock that appears to be overvalued and in an upward trend, and they utilise technical analysis to pinpoint the precise moment to enter the market when the stock seems to be reaching its highest point.
Top-Down Analysis
Top-down analysis takes a different approach, starting with a macroeconomic view before honing in on individual securities. The process begins with an overview of the overall economy, including factors such as interest rates, inflation, and economic indicators. From there, the focus narrows to specific sectors and industries that are expected to perform well under the given economic conditions. Finally, investors examine individual companies within those sectors to identify potential investment opportunities.
This approach is often favoured by traders looking for short-term gains, as it allows them to react quickly to changing economic conditions and trends. To provide an example, a trader might focus on stocks that have recently risen above the 100-day moving average as a potential buying opportunity, relying on technical analysis to make their decisions for short-term trading.
Essential Tools for Technical Analysis
Simplified analysis in price action charts relies on a set of essential tools to decode the intricate language of the financial markets. Price charts are a fundamental tool in technical analysis. They display historical price data and help traders identify trends, support, resistance, and patterns.
Common types include:
- Line Charts: This is a line connecting closing prices over a specific time period.
- Candlestick Charts: These provide information about open, high, low, and close prices in a candlestick format.
- Bar Charts: These display open, high, low, and close prices as vertical bars.
Choosing the right time frame is crucial in technical analysis. Common time frames include daily, weekly, and intraday. Shorter time frames are suitable for day traders, while longer ones suit long-term investors.
Technical Indicators
Technical indicators are indispensable tools in the world of stock trading. These mathematical calculations and statistical measures are applied to price, volume, or open interest data to provide traders with valuable insights into market trends and momentum. They help traders make informed decisions by offering a systematic way to interpret market data.
In stock trading, technical indicators come in various forms, serving different purposes. For instance, moving averages smooth out price data, making it easier to identify short-term and long-term trends. The Relative Strength Index (RSI) gauges the strength of a stock's price movements and helps traders determine if an asset is overbought or oversold. The Moving Average Convergence Divergence (MACD) may be useful for identifying changes in an asset's momentum, making it a popular choice among traders.
Chart Patterns
Chart patterns are another essential component of stock trading, particularly in the realm of technical analysis. These patterns represent recognisable formations that often precede specific price movements.
Certain chart patterns, such as the head and shoulders/inverse head and shoulders, double top/bottom, flags, and pennants, serve as valuable visual cues that traders use to predict potential future price directions and develop effective trading strategies. The head and shoulders patterns, for example, signify a potential trend reversal, while double top/bottom patterns indicate reversals after an extended trend. Flags and pennants denote consolidation periods before the previous trend resumes.
When employed alongside other technical and fundamental analyses, these patterns assist traders in making informed decisions within the stock market, although it's essential to remember that no pattern is infallible, and successful trading hinges on risk management, timing, and various other factors.
Sample Trade Analysis
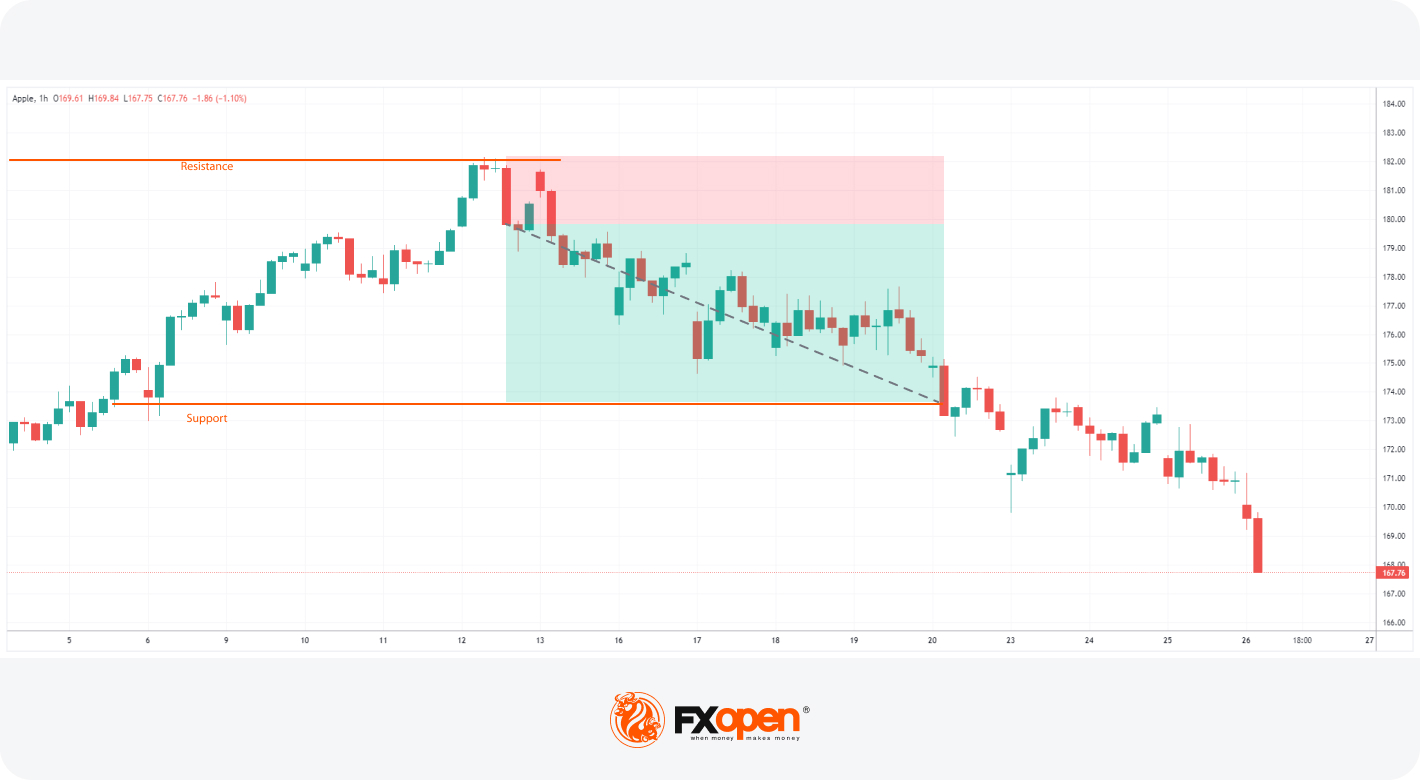
A trader uses support and resistance levels on the hourly chart of Apple stock to short. They wait for a bearish confirmation, i.e. the large red candle, and enter at its close. Their exit lies at the next support level. The risk-reward ratio in this trade is 1:2.
Conclusion
Traders can perform simplified analysis for free using the TickTrader trading platform by FXOpen. As they develop their approaches, they may open an FXOpen account and implement their analysis on the live charts. It is essential to remember that developing true skills on the price action charts may take time. However, once accomplished, you may find good trading opportunities with ease.
This article represents the opinion of the Companies operating under the FXOpen brand only. It is not to be construed as an offer, solicitation, or recommendation with respect to products and services provided by the Companies operating under the FXOpen brand, nor is it to be considered financial advice.
Stay ahead of the market!
Subscribe now to our mailing list and receive the latest market news and insights delivered directly to your inbox.


Latest articles

Nasdaq 100: 48 Hours of Chaos, One Trendline Standing in the Way
Wall Street just lived through one of its wildest 48 hours of the year. On Wednesday, the Fed held rates steady at 3.50%-3.75%, but three FOMC members broke ranks to demand a hike—an unusually hawkish dissent

Amazon Analysis: Strong Earnings Coincide with a Breakout from the Correction
On 30 July, Amazon.com reported its financial results for the second quarter of 2026, significantly exceeding market expectations. Revenue rose 20% year-on-year to $200.6 billion, compared with the consensus forecast of around $196.5 billion. The main growth

GBP/USD and EUR/GBP Await Key Bank of England Decision
The pound strengthened following the outcome of the US Federal Reserve meeting, where the central bank, as expected, kept interest rates unchanged. However, the Fed did not provide the market with clear signals of an imminent shift towards rate cuts,