


Slow Week for Cryptocurrencies
FXOpen
It’s been a slow week for the crypto-market. Bitcoin traded in a tight $16 dollars range during the past seven days while Litecoin stayed within its consolidation area.
Bitcoin in 3.8 Percent Range
Bitcoin continues to trade relatively calm, with prices stuck in a $16 dollars range last week. In percentage terms this is around 3.8 percent. We are currently quoted at $431 dollars per coin, only $2 dollars higher compared to last Tuesday.
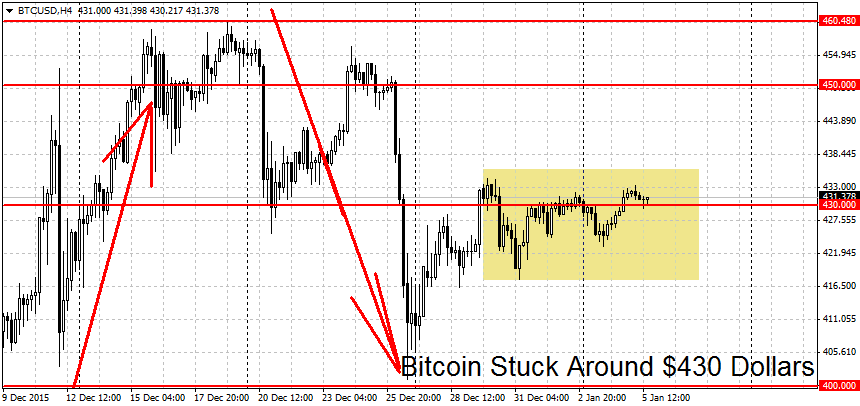
The two potential breakout points haven’t changed. A decisive breakdown below the $400 round figure could start a new BTC downtrend. Important support levels below here are the former swing high at $379 dollars, followed by the $350 round figure. Weaker support levels can be found bit lower at $340 and $310 dollars per coin.
Note that as is usually the case with these levels, they’re more of support/resistance areas and not exact numbers. Important levels like the $400 round figure are watched by a lot of market participants, so expect to see a lot of games being played around these figures.
On the upside, a clean breakout above $461 dollars level could reignite the rally. Higher up the first major resistance can be found at the round $500 figure. This is close to the top reached during the November rally. Back then prices peaked at $504 dollars on most BTC exchanges.
Litecoin Still in Consolidation Mode
Bitcoin’s little brother is still in consolidation mode. Since our last LTC update, the pair hit a high of $3.505 and a low of $3.400. The total range top to bottom in percentage terms was 2.89 percent, even lower then bitcoin. We are currently quoted at $3.461 dollars, only 3 cents below last Tuesday’s price.
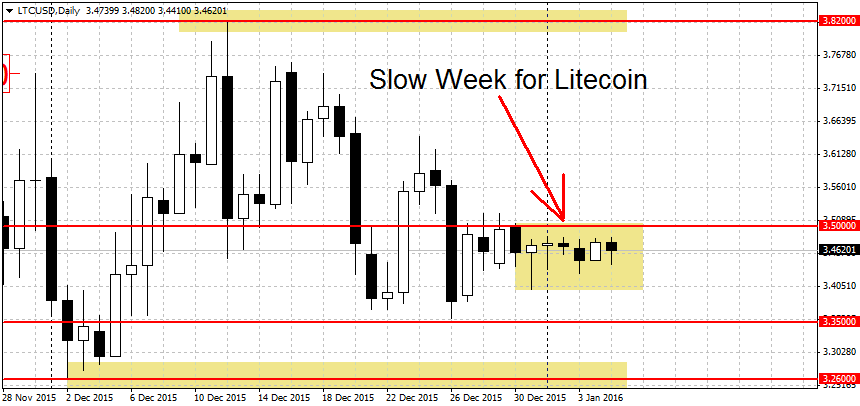
The support levels on the lower end start at $3.35 dollars. A decisive breakdown below here could start a new downtrend. The next support below here can be found near $3.26 dollars per coin, followed by the round $3 dollars figure. Lower still we have the former swing low at $2.88 dollars, closely followed by $2.70 and $2.50 dollars per coin. The January swing high at $2.40 dollars could provide some support to falling prices. But a stronger level can be found bit lower at the $2 dollars round figure.
On the other end we have two weaker resistance levels at $3.64 and $3.76 dollars per coin. But the important level for the bulls is a bit higher up at the $3.82 swing high. A clean breakout above this swing high may trigger a new LTC rally. Higher up more resistance levels can be found at $4.00 and $4.50 dollars, followed by the November high for Litecoin at $4.85 dollars.
FXOpen offers the world's most popular cryptocurrency CFDs*, including Bitcoin and Ethereum. Floating spreads, 1:2 leverage — at your service (additional fees may apply). Open your trading account now or learn more about crypto CFD trading with FXOpen.
*Important: At FXOpen UK, Cryptocurrency trading via CFDs is only available to our Professional clients. They are not available for trading by Retail clients. To find out more information about how this may affect you, please get in touch with our team.
This article represents the opinion of the Companies operating under the FXOpen brand only. It is not to be construed as an offer, solicitation, or recommendation with respect to products and services provided by the Companies operating under the FXOpen brand, nor is it to be considered financial advice.
Stay ahead of the market!
Subscribe now to our mailing list and receive the latest market news and insights delivered directly to your inbox.


Latest articles

EUR/USD and GBP/USD consolidate ahead of the Fed decision
European currencies are showing subdued dynamics, entering a consolidation phase following their previous advance. Earlier, EUR/USD and GBP/USD broke out of their ranges and strengthened; however, the subsequent correction has led both pairs to retest the previously breached

Meta: V-Shaped Recovery Meets Heavy Volume Resistance
The movement in Meta Platforms shares is being driven by two competing narratives. On one hand, advertising revenue is benefiting from AI-based tools: the Advantage+ platform continues to support strong advertiser demand, and the analyst consensus for Q1 2026 revenue

Commodity Currencies Test Key Levels Ahead of Major Macro Data
Commodity-linked currencies are trading near key levels, showing restrained price action as market participants adopt a wait-and-see approach. The fundamental backdrop is shaped by expectations surrounding the release of Australia’s inflation data and the Bank of Canada’s interest