


The TRIX Indicator: Definition, Calculation, and Trading Strategies
FXOpen
Developed by Jack Hutson in the 1980s, the TRIX indicator has gained popularity among traders due to its ability to filter out short-term fluctuations and focus on longer-term price trends. Whether you are a seasoned trader or just starting your journey in the financial markets, adding the TRIX indicator strategy to your trading arsenal might be a valuable step towards enhancing your technical analysis and trading decisions. This FXOpen article will explore the basics of the TRIX indicator and examine its application in analysing market dynamics.
What Is a TRIX Indicator?
The TRIX indicator appears as a line below a chart, oscillating above and below the zero line. It calculates the percentage rate of change between two triple-smoothed exponential moving averages (EMA). The indicator helps filter out noise and insignificant price movements in financial instruments, similar to the MACD. The TRIX combines momentum and trend analysis and can identify overbought and oversold conditions in the market. It also helps identify bullish and bearish divergences.
TRIX is often compared to the moving average convergence divergence (MACD) indicator, but it has some differences. One notable distinction is that TRIX provides smoother outputs due to the triple smoothing of the exponential moving average (EMA).
What Is the TRIX Indicator Formula?
To calculate the TRIX indicator, you first need to determine the number of periods (n) that you want to include in the indicator calculation, depending on the timeframe you trade on. There is no single best TRIX indicator setting; you can find your perfect parameter by testing the indicator on the TickTrader platform for free.
Next, calculate the first exponential moving average (EMA1) by taking the n-period EMA of the closing prices. Then, calculate the second exponential moving average (EMA2) by taking the n-period EMA of the EMA1 values calculated in the previous step.
Proceed to calculate the third exponential moving average (EMA3) by taking the n-period EMA of the EMA2 value. Finally, compute the indicator value by taking the percentage change between the current EMA3 value and the previous EMA3 value, divided by the previous EMA3 value.
How to Use the TRIX Indicator
Here are three common techniques:
Zero-Line Crossover
One popular application of the indicator is a zero-line crossover. When the TRIX line crosses above the zero line, it suggests a bullish signal, indicating a shift towards upward momentum. Conversely, when the TRIX line crosses below the zero line, it means a potentially bearish signal, indicating a change towards downward momentum.
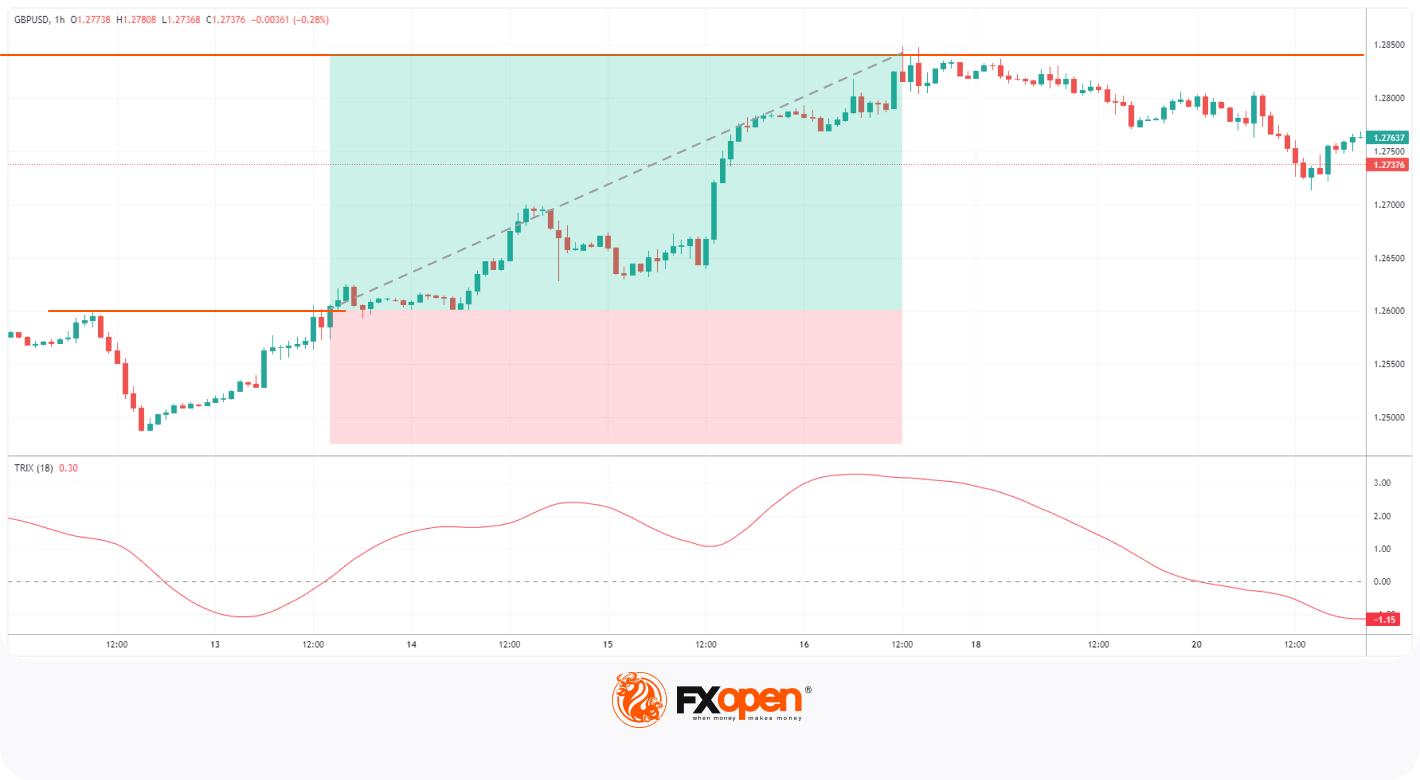
The green area on the GBPUSD hourly chart corresponds to the TRIX technical indicator being above 0. The trader looks for a buy opportunity while the indicator is in the positive zone. They identify a breakout and place a long position with a stop loss below the previous low and a take profit at the next resistance.
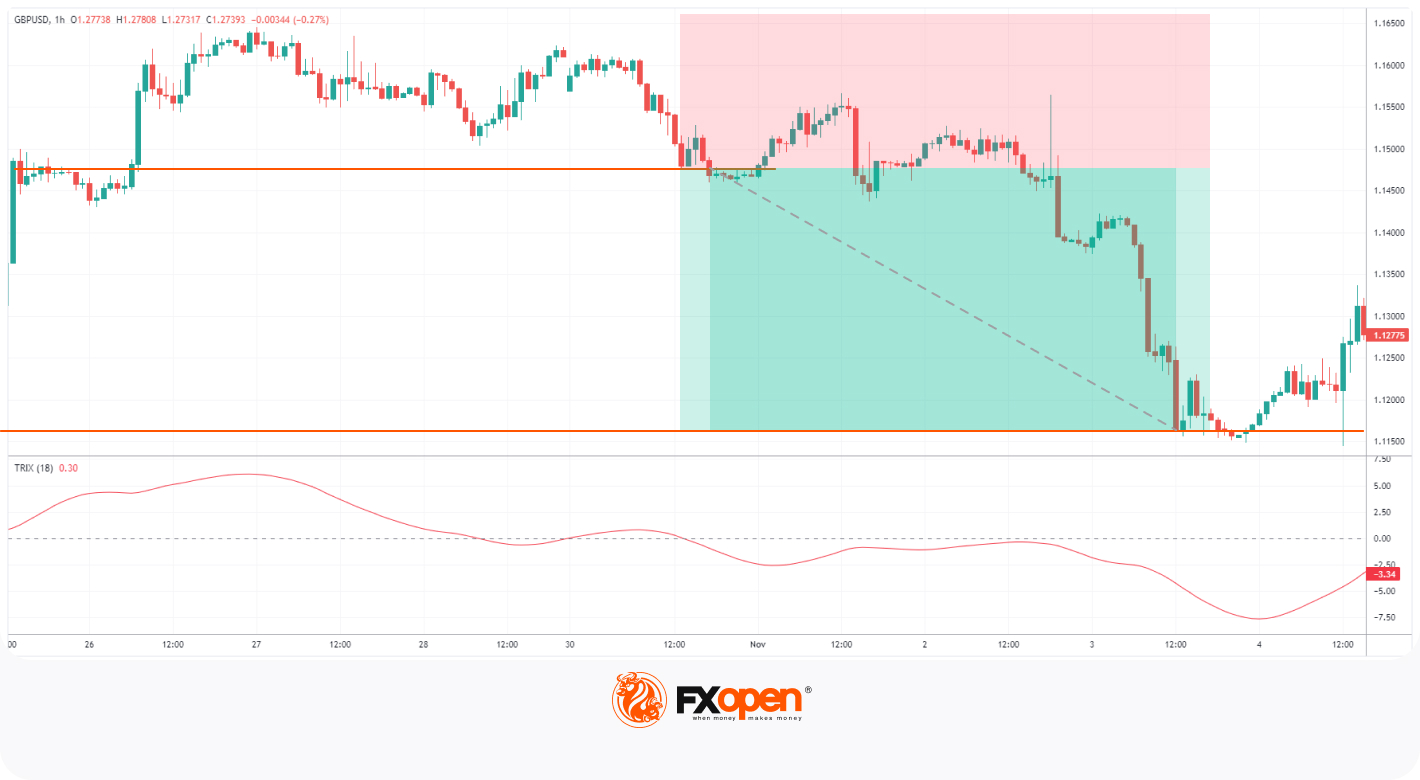
Similar to the example above, a trader also sets up a short position on GBPUSD when the indicator falls below 0, and a breakout of support is observed. The SL is above the previous high, and the take profit is at the next support on the TickTrader chart.
Bullish and Bearish Divergences
Traders also look for divergences between the TRIX indicator and the price of the asset. A bullish divergence occurs when the price makes lower lows, but the indicator forms higher lows. This suggests that the downward momentum is weakening, potentially indicating a bullish reversal. Conversely, a bearish divergence occurs when the price makes higher highs, but the TRIX indicator moves down. This suggests that the upward momentum is weakening, potentially indicating a bearish reversal.

The TRIX indicator on the stock chart of Tesla shows a bearish divergence. The trader places a stop loss above the price high and waits for a small breakout of support to place a short trade. Their take profit lies at the support level in accordance with the 1:2 risk/reward ratio.
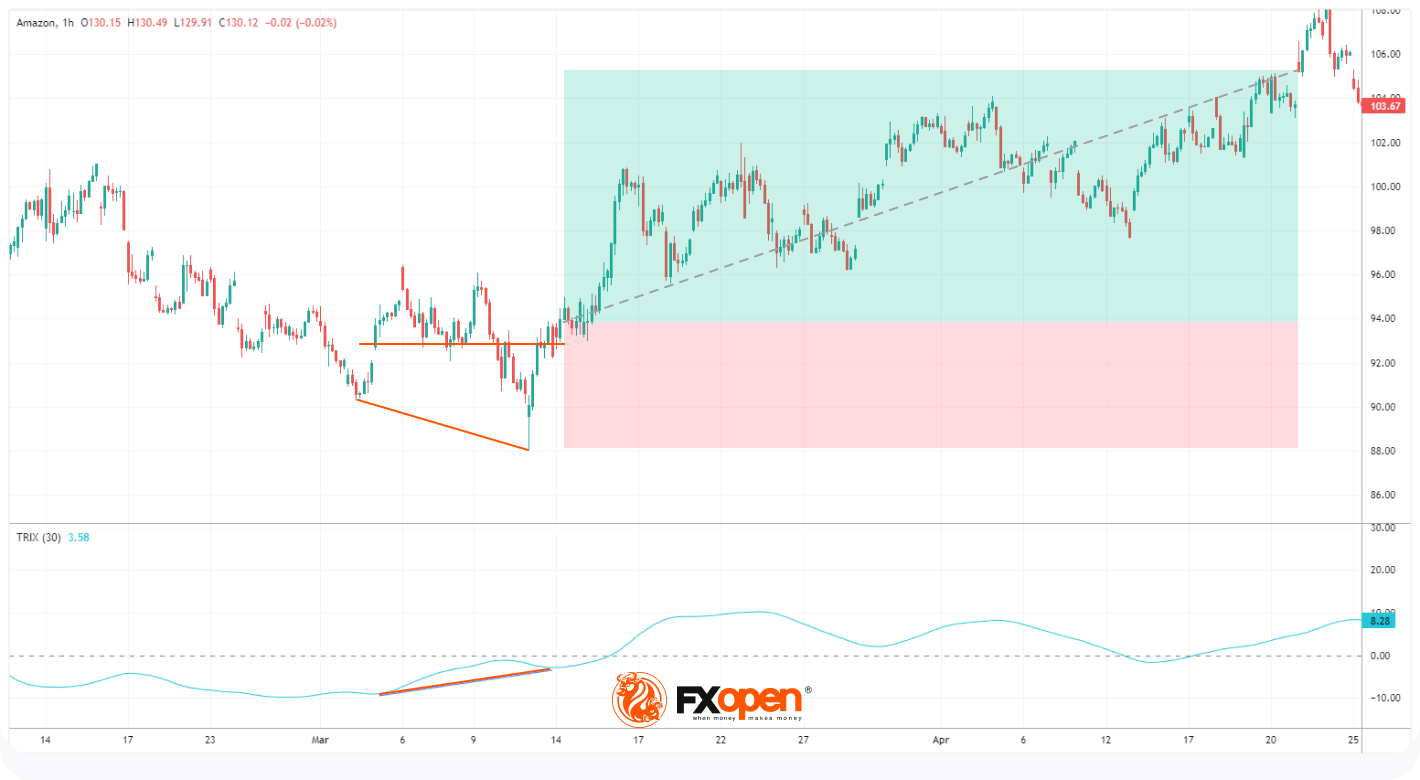
You can see a bullish divergence on the Amazon stock where a trader places a long position after confirming the setup and a small breakout of the resistance. Their SL lies below the price low with the take profit at the resistance level in accordance with the 1:2 risk/reward ratio.
Signal Line Crossover
In addition to zero-line crossovers, traders often employ a signal line, typically a 9-period EMA, to generate trading signals. When the TRIX line crosses above the signal line, it is considered a bullish signal, indicating a potential upward momentum. Conversely, when the TRIX line crosses below the signal line, it is regarded as a bearish signal, meaning potential downward momentum.
To trade using the TRIX on multiple financial instruments, traders may choose to open an FXOpen account at no cost. The platform provides CFDs on stocks, commodities, indices, ETFs, and cryptocurrencies*, as well as forex trading with minimal spreads.
Final Thoughts
It's important to remember that no indicator is infallible, and the TRIX indicator can be used in conjunction with other technical analysis tools to confirm signals and validate trading decisions. When making trading choices, it is also crucial to consider other factors, such as market conditions, risk management, and fundamental analysis.
As with any technical analysis tool, it is advisable to practise and gain experience in using the indicator before relying on it for trading decisions. Understanding its strengths, limitations, and how it aligns with your trading strategy will contribute to its effectiveness.
FAQ
What types of financial instruments can the TRIX be used for?
The TRIX can be used for various financial instruments such as stocks, currency pairs, commodities, indices, ETFs, and cryptocurrencies*.
What is the recommended timeframe for using the TRIX?
The TRIX can be applied to different timeframes, including intraday, daily, weekly, or monthly charts. The choice depends on your trading style and preferences.
Can the TRIX be used in conjunction with other indicators?
The TRIX can be combined with other technical indicators like moving averages, trend lines, or oscillators to enhance the accuracy of trading signals and provide a more comprehensive analysis.
*At FXOpen UK and FXOpen AU, Cryptocurrency CFDs are only available for trading by those clients categorised as Professional clients under FCA Rules and Professional clients under ASIC Rules, respectively. They are not available for trading by Retail clients.
This article represents the opinion of the Companies operating under the FXOpen brand only. It is not to be construed as an offer, solicitation, or recommendation with respect to products and services provided by the Companies operating under the FXOpen brand, nor is it to be considered financial advice.
Stay ahead of the market!
Subscribe now to our mailing list and receive the latest market news and insights delivered directly to your inbox.


Latest articles

US Dollar Index Analysis: Dollar at a Crucial Point, What's Next?
As the chart shows, the US Dollar Index (DXY) has gained more than 4% from its January lows, with the move accelerating from February 2026 onwards. Today, the dollar finds itself at a technically and fundamentally critical point, one that

US Natural Gas: Inventory Surplus Continues to Weigh on Prices
The US natural gas market (XNG/USD) is entering the summer season under the influence of two opposing forces. Domestically, the picture remains bearish. According to the EIA, working gas in underground storage stood at 2,688 billion cubic feet

Forex Kill Zone Times and ICT Trading Sessions
Kill Zone trading is a