


TradingView's Tools for Advanced Forex Analysis
FXOpen
In forex trading, access to precise tools and accurate information is critical. TradingView, the world’s number one platform for investors and traders, offers just that. From diverse chart types to advanced technical analysis tools, it equips traders with everything they need for in-depth market analysis. This article breaks down TradingView’s various tools and how they help forex traders analyse the ever-evolving currency markets.
Markets and Charts
TradingView’s Supercharts are used by over 50 million traders and investors looking to stay up-to-date with the market’s movements and perform in-depth analysis.
Different Chart Types
TradingView offers a diverse array of chart types, catering to various analysis styles using currency trading tools. There are two groups:
- Time-Based Traditional Charts: These include Bars, Candles, Hollow Candles, Columns, Line, Line with Markers, Step Line, Area, Baseline, and High-Low. These charts are constructed based on time intervals, making them ideal for a range of trading styles, from day trading to long-term analysis.
- Price-Change Dependent Charts: For traders focusing more on price movements than time, TradingView provides charts like Heikin Ashi, Renko, Line Break, Kagi, Point & Figure, and Range. These are solely based on price changes, offering a different perspective from traditional charts.
Timeframes
A key benefit of TradingView is its flexibility in timeframes. Traders can set time-based bar intervals ranging from as short as 1 minute to as long as 12 months. This flexibility allows traders to tailor their analysis to their specific strategy, whether intraday or multi-month position trading. Moreover, TradingView offers the option to work with price range bars, providing a unique view of market movements by focusing on price changes rather than time intervals.
Market Data and Providers
TradingView provides access to a vast range of markets, encompassing an extensive array of currency pairs, stocks, bonds, ETFs, and even economic data. With direct connections to over 1,357,880 instruments globally, the platform sources high-quality information from institutional-grade data partners. This extensive coverage ensures that traders have a wide array of data at their fingertips, essential for making the most of TradingView’s host of forex market analysis tools.
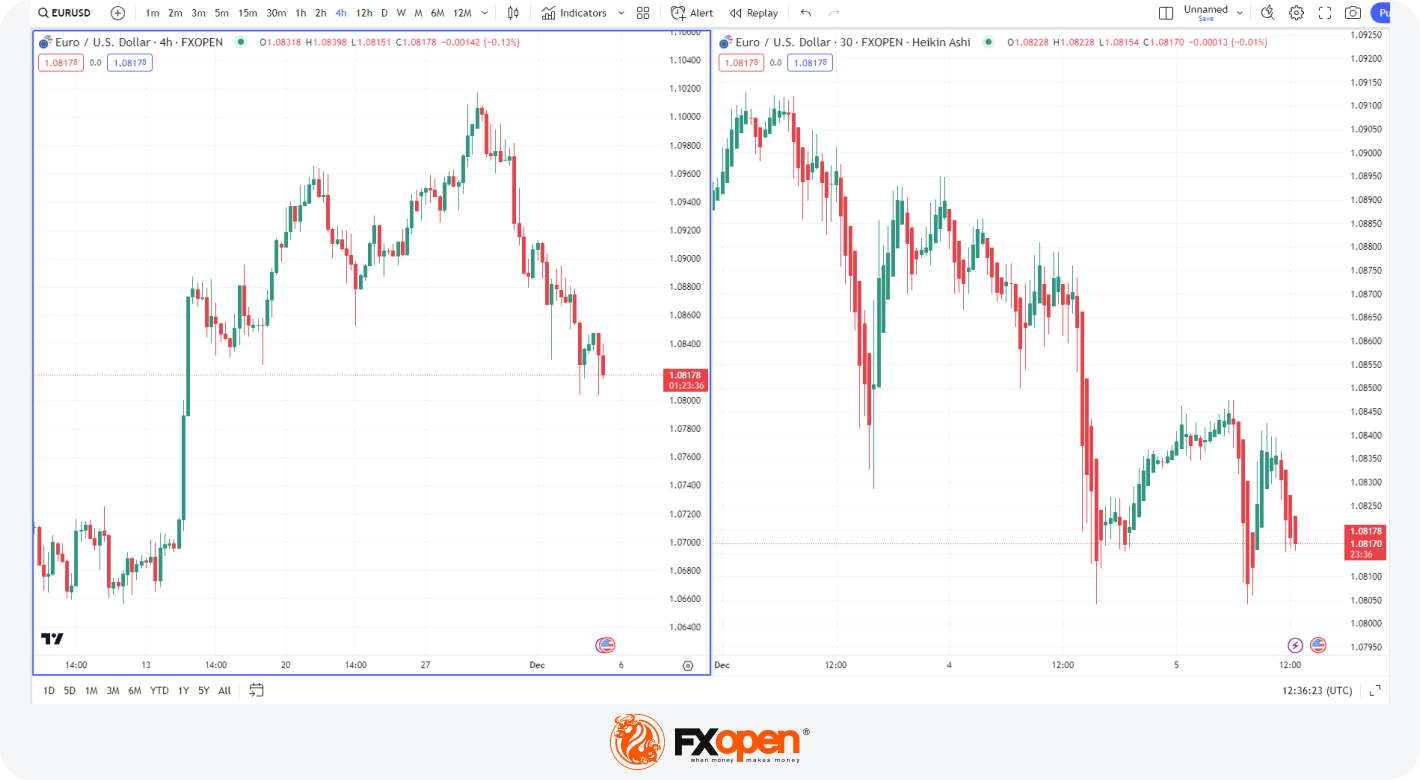
Multi-Chart Mode
The multi-chart mode in TradingView allows traders to view up to 16 charts simultaneously. This feature is handy for comparing different currency pairs, timeframes, or even market indicators side by side. By providing a comprehensive view of the markets, traders can better identify correlations, trends, and potential trading opportunities across different markets.
Technical Analysis Tools
For many forex traders, technical analysis is their bread and butter. TradingView offers the most comprehensive libraries of technical analysis tools of any trading platform.
Indicators
TradingView provides an extensive range of tools needed for forex trading. It boasts over 400 built-in indicators and strategies, along with a staggering 100,000+ community-built public indicators. These indicators and strategies are constructed using TradingView's Pine Script™ language, known for its elegant and minimalistic nature. This vast repository allows traders to analyse markets through various lenses, tailoring their approach to different trading methodologies.
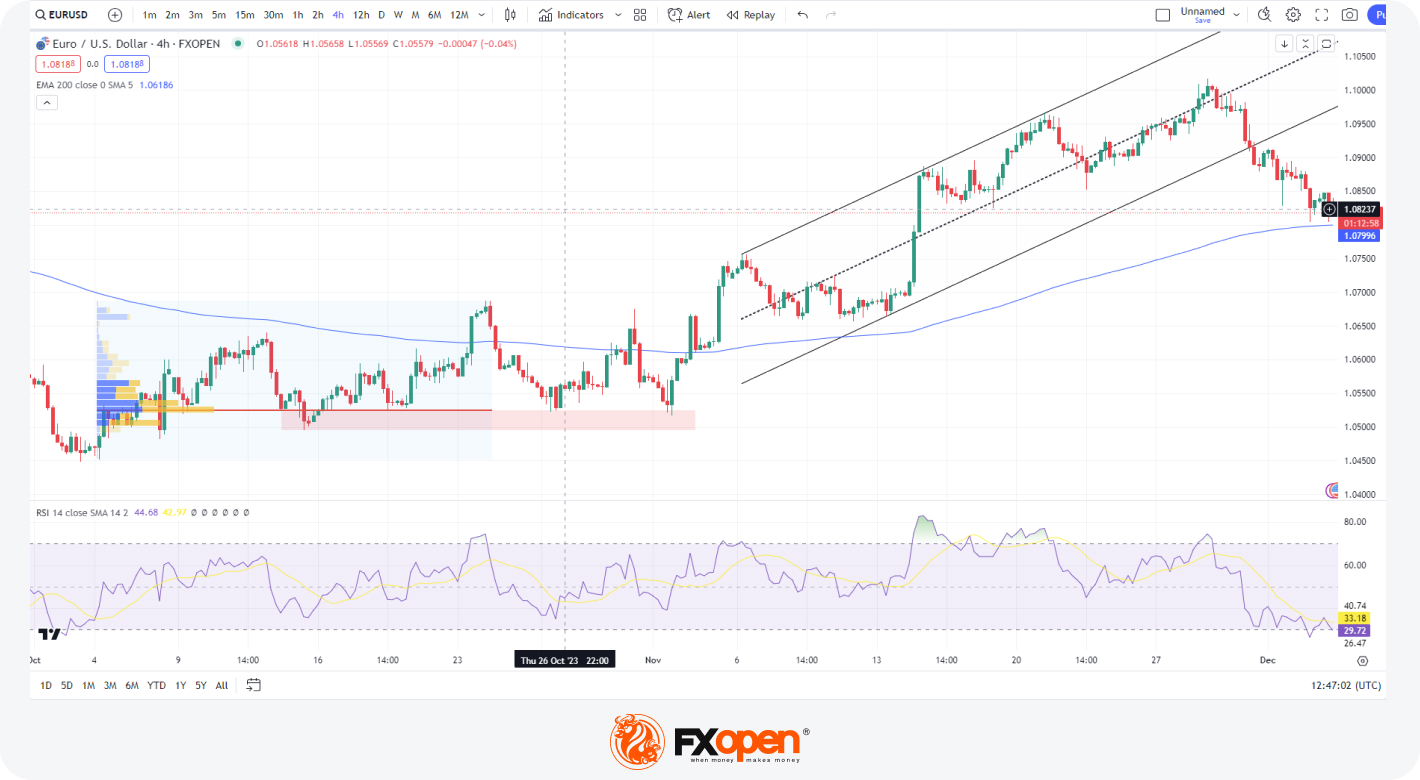
Drawing Tools
TradingView’s drawing tools are among the top technical analysis tools for traders. The platform offers over 110 tools, perfect for marking trends, performing measurements, and identifying future price movements. These tools are categorised into seven groups, including trend lines for marking price movement direction, Gann and Fibonacci tools for automatic level building, geometric shapes for freehand drawing, annotation tools for chart notes, pattern tools for marking highs and lows, forecasting and measurement tools, and a wide range of icons to add visual variety to analysis.
Volume Profile
The Volume Profile is one of TradingView’s more sophisticated forex trading analysis tools that displays trading volume over specified time periods at certain price levels. It’s crucial in identifying support and resistance levels and areas of market activity. TradingView offers three types of Volume Profile:
- Fixed Range Volume Profile: Analyses a specific range selected by the trader.
- Visible Range Volume Profile: Focuses on the volume profile of the visible portion of the chart.
- Session Volume Profile: Displays volume data for specific trading sessions.
Candlestick Pattern Recognition
Lastly, candlestick pattern recognition is a cornerstone of forex trading. TradingView's indicators assist traders in identifying candlestick patterns. Auto Chart Patterns allows for automated detection of complex market patterns, streamlining the analysis process and providing traders with quick, reliable insights into potential market movements.
Bar Replay
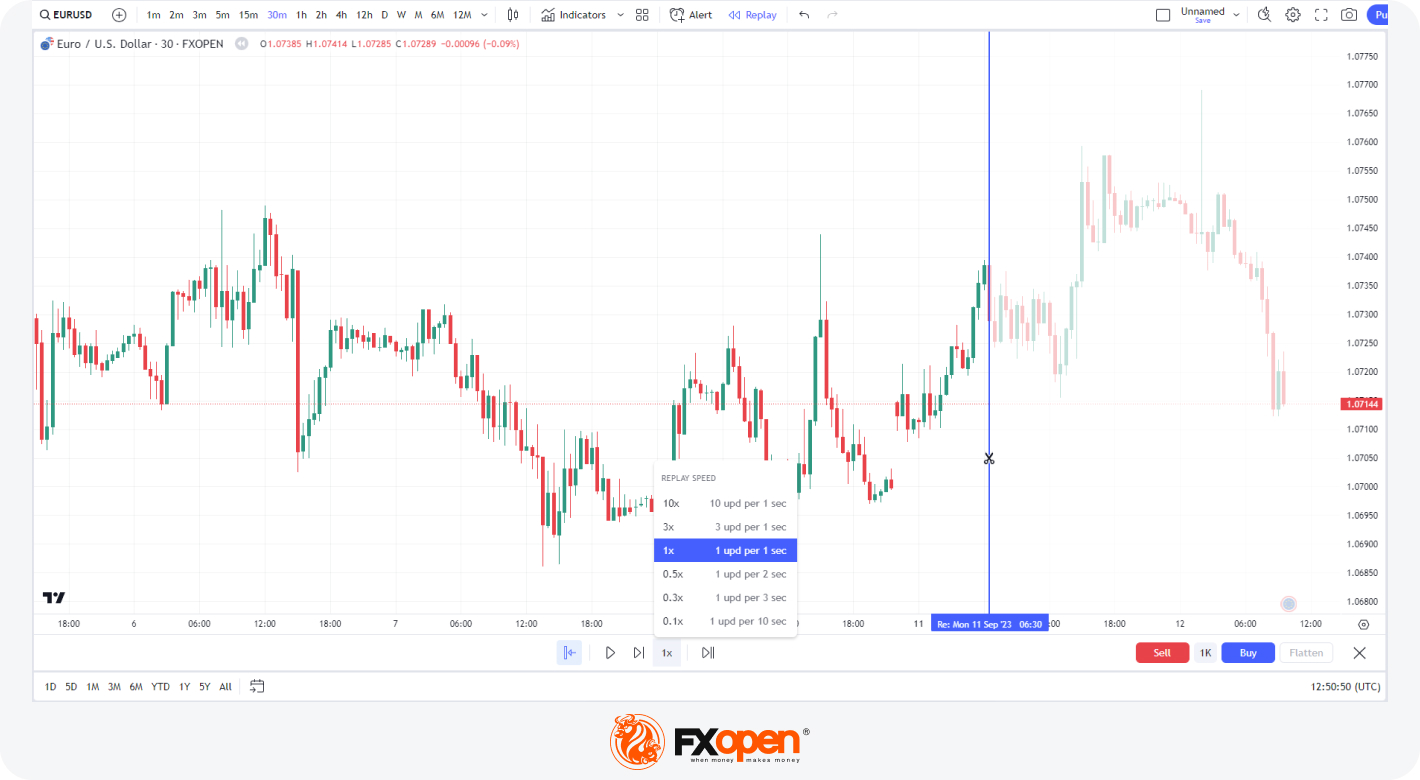
The Bar Replay feature is a powerful tool among TradingView’s chart tools, designed for simulated trading on historical data. This feature enables traders to replay forex market movements at their chosen starting point. Traders can initiate this tool on any chart and timeframe. It offers the flexibility to adjust playback speed, determining how rapidly each trading bar appears during the replay.
With six different replay speeds and an autoplay function, this tool provides a dynamic and interactive way to analyse past price actions and refine trading strategies. It's particularly helpful for those looking to understand market behaviour at specific moments, like a significant news release or a particular time of day.
Advanced Forex Screener
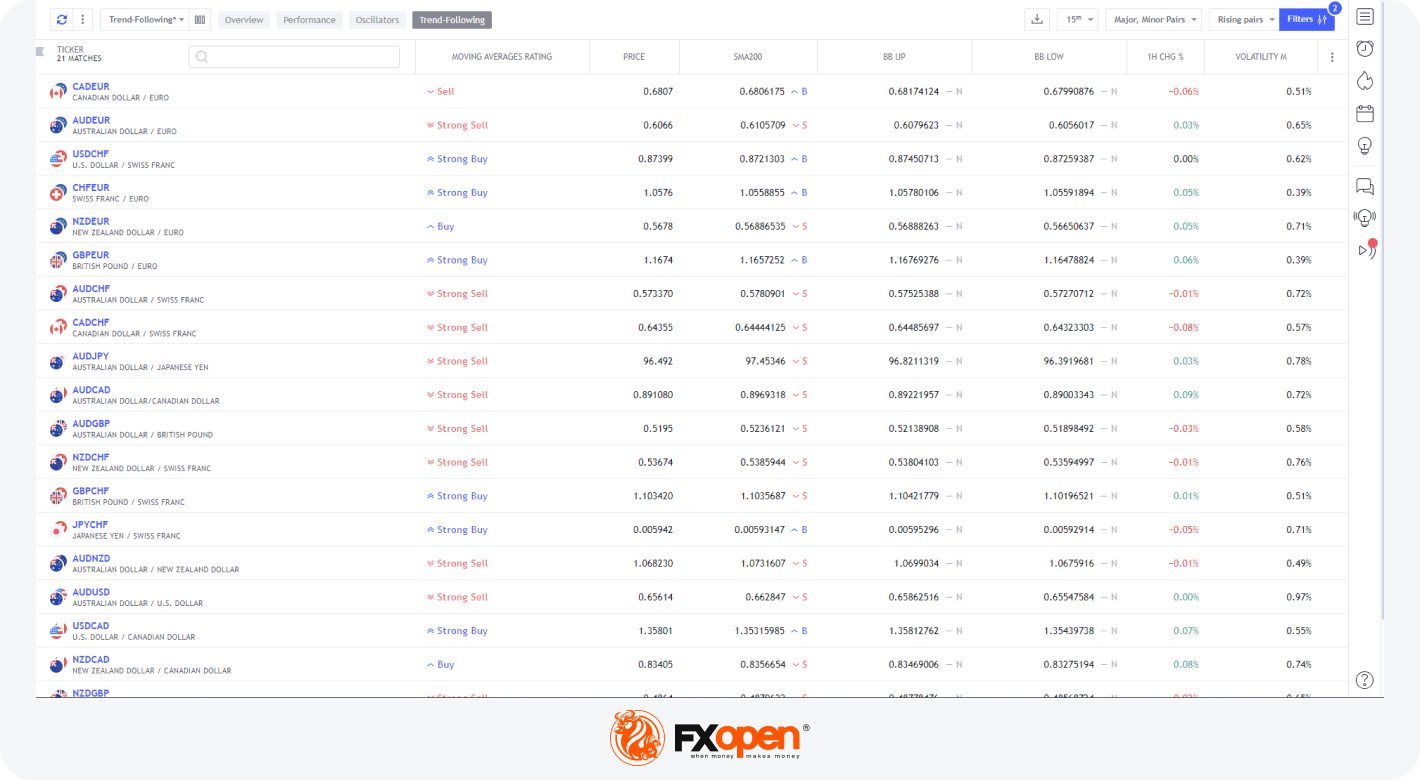
TradingView's Forex Screener is one of the platform’s best forex day trading analysis tools. It enables traders to filter and analyse forex pairs based on various criteria. The screener is equipped with a range of filters.
These filters, including options like percentage changes, price changes, volatility, and even indicator-based metrics, help traders pinpoint forex pairs matching their strategy. There are also technical-based ratings, offering market insights at-a-glance. This tool is not only powerful and highly customisable but also incredibly user-friendly, laid out in a clear table format.
Economic Events and News Flow
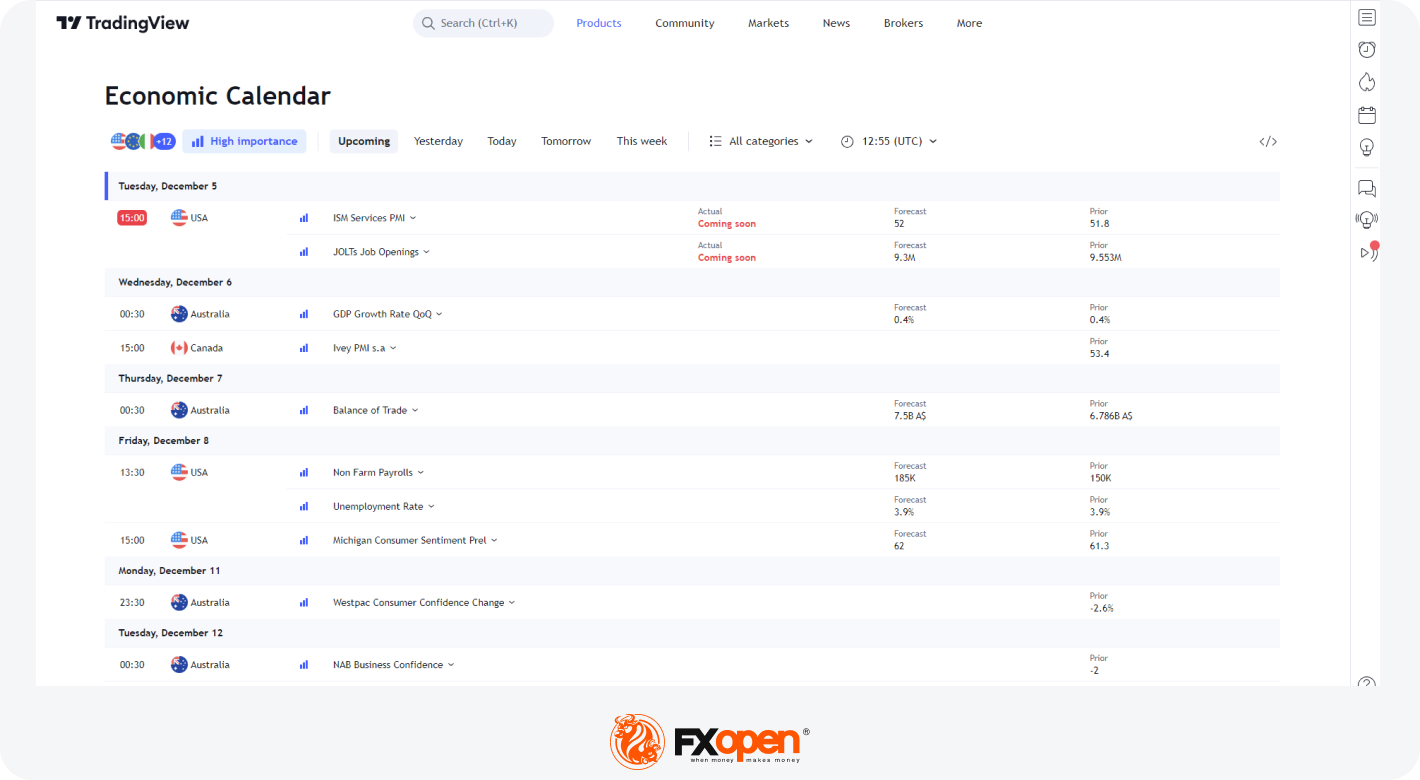
TradingView's economic calendar provides real-time tracking of pivotal financial events and data. This includes economic indicators like GDP, interest rate announcements, and updates from authorities like the Federal Reserve.
The calendar displays the time, country, and significance of each event. Users can click on events for detailed descriptions and options like viewing charts or adding to their own calendars. Importantly, the calendar shows actual and forecasted values of data releases.
TradingView's News Flow feature aggregates real-time global news from various sources, keeping traders updated on market-impacting events for their preferred asset classes throughout the day.
Community-Driven Custom Scripts and Ideas
TradingView’s platform is bolstered by its vibrant community, which actively contributes to a vast repository of over 100,000 custom scripts, including indicators and strategies across different trading methodologies. This community-driven aspect is further enriched through programs like TradingView Wizards, which recognises and rewards outstanding contributions.
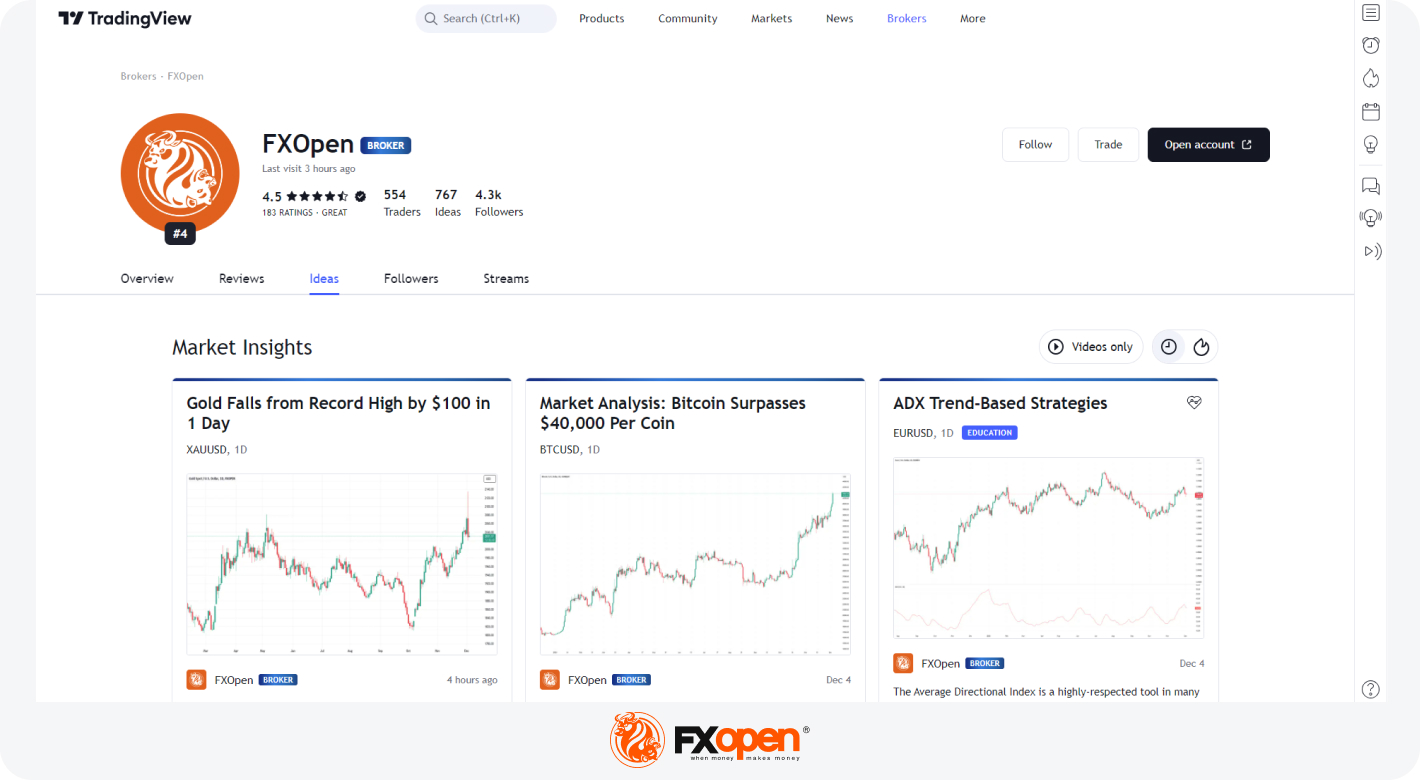
In addition to scripts, the platform also hosts community-led ideas. These are analytical insights and trade thoughts provided by users, enabling collaborative learning and strategy sharing. For instance, on FXOpen's dedicated ideas page, we frequently contribute to the platform’s knowledge base through in-depth market analysis and informative trading articles.
TradingView Alerts
TradingView alerts are real-time notifications tailored to specific market conditions set by the user. These alerts can be based on prices, indicators, strategies, and drawing tools. Users can customise alerts using over 1,000 indicators, including community-created ones, with predefined conditions or custom triggers.
Alerts can be received as visual popups, audio signals, emails, email-to-SMS, or push notifications on phones. Webhook notifications are also available for Essential, Plus, and Premium users. This feature allows traders to stay informed on any device, ensuring they never miss crucial market movements.
Pine Script: TradingView's Powerful Coding Language
Pine Script, developed by TradingView, is a versatile programming language for crafting custom indicators and strategies in technical analysis. It features a specialised editor that facilitates code writing and editing, complete with auto-highlighting for built-in language elements like variables and functions. Finished indicators can be directly added to charts, saved, edited, or shared in the Community Scripts.
TradingView also offers comprehensive resources, including a user manual, quick reference materials, and an active community platform, PineCoders, for learning and improving Pine Script skills. Moreover, users can access open-source codes of TradingView's built-in indicators, providing a practical way to learn and experiment with Pine Script.
The Bottom Line
In conclusion, TradingView stands out as an essential resource for forex traders, offering a robust array of analytical tools, charts, and community insights. Whether for in-depth technical analysis or staying abreast of market trends, TradingView caters to all levels of trading expertise. For those ready to elevate their trading journey, opening a TradingView account through FXOpen provides an integrated platform to harness these comprehensive tools. Join the community today and experience the full potential of TradingView with FXOpen.
This article represents the opinion of the Companies operating under the FXOpen brand only. It is not to be construed as an offer, solicitation, or recommendation with respect to products and services provided by the Companies operating under the FXOpen brand, nor is it to be considered financial advice.
Stay ahead of the market!
Subscribe now to our mailing list and receive the latest market news and insights delivered directly to your inbox.


Latest articles

Nasdaq 100: 48 Hours of Chaos, One Trendline Standing in the Way
Wall Street just lived through one of its wildest 48 hours of the year. On Wednesday, the Fed held rates steady at 3.50%-3.75%, but three FOMC members broke ranks to demand a hike—an unusually hawkish dissent

Amazon Analysis: Strong Earnings Coincide with a Breakout from the Correction
On 30 July, Amazon.com reported its financial results for the second quarter of 2026, significantly exceeding market expectations. Revenue rose 20% year-on-year to $200.6 billion, compared with the consensus forecast of around $196.5 billion. The main growth

GBP/USD and EUR/GBP Await Key Bank of England Decision
The pound strengthened following the outcome of the US Federal Reserve meeting, where the central bank, as expected, kept interest rates unchanged. However, the Fed did not provide the market with clear signals of an imminent shift towards rate cuts,