


Types of Trading Charts in the Stock Market
FXOpen
Trading charts are like roadmaps for traders exploring the exciting stock market. They help us understand price movements, spot trends, and aid in making smart decisions. But guess what? There are numerous types of trading charts. Each has its own unique features that can make your trading experience even more thrilling. So, get ready to dive into the world of trading charts.
Common Types of Trading Charts
There are various charts in trading. They serve specific purposes and functions. The most common types of chart patterns in stock market trading include:
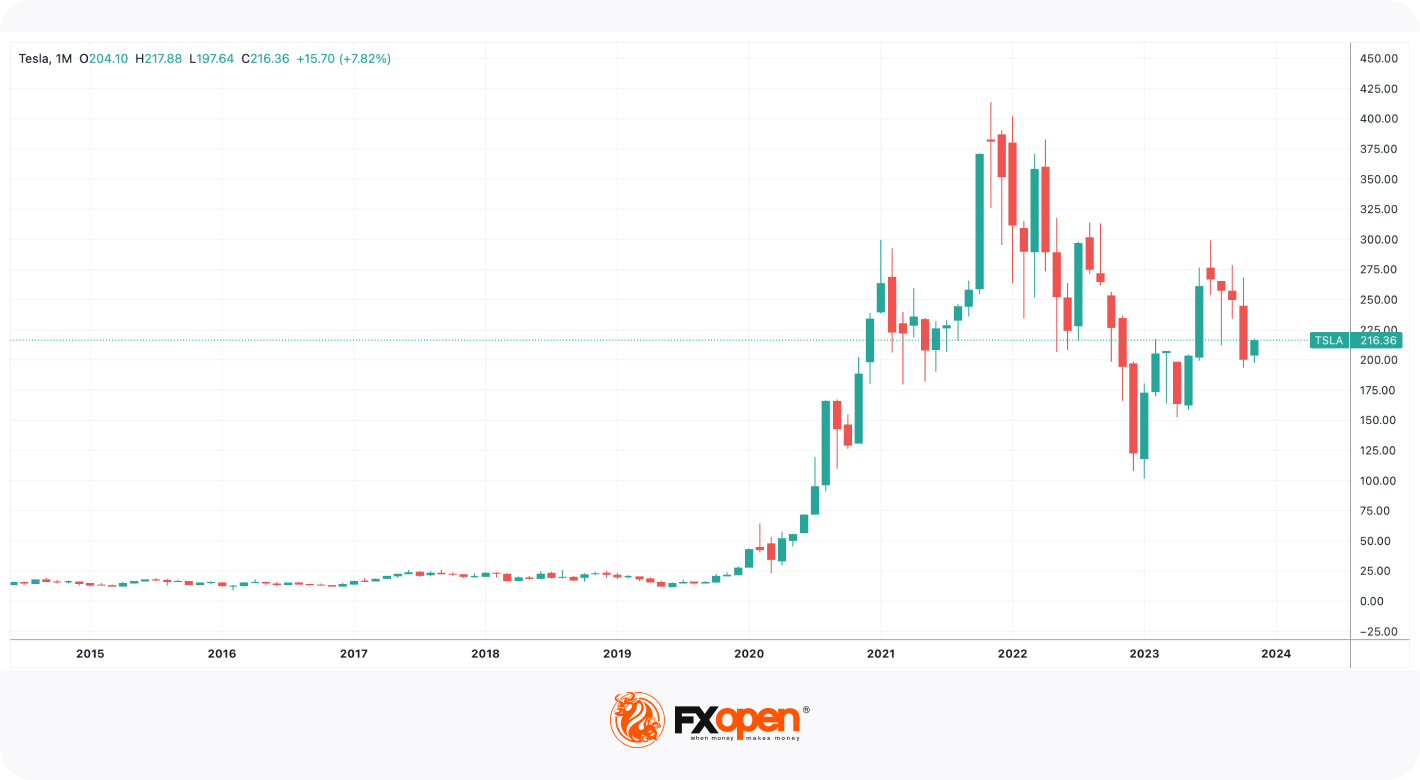
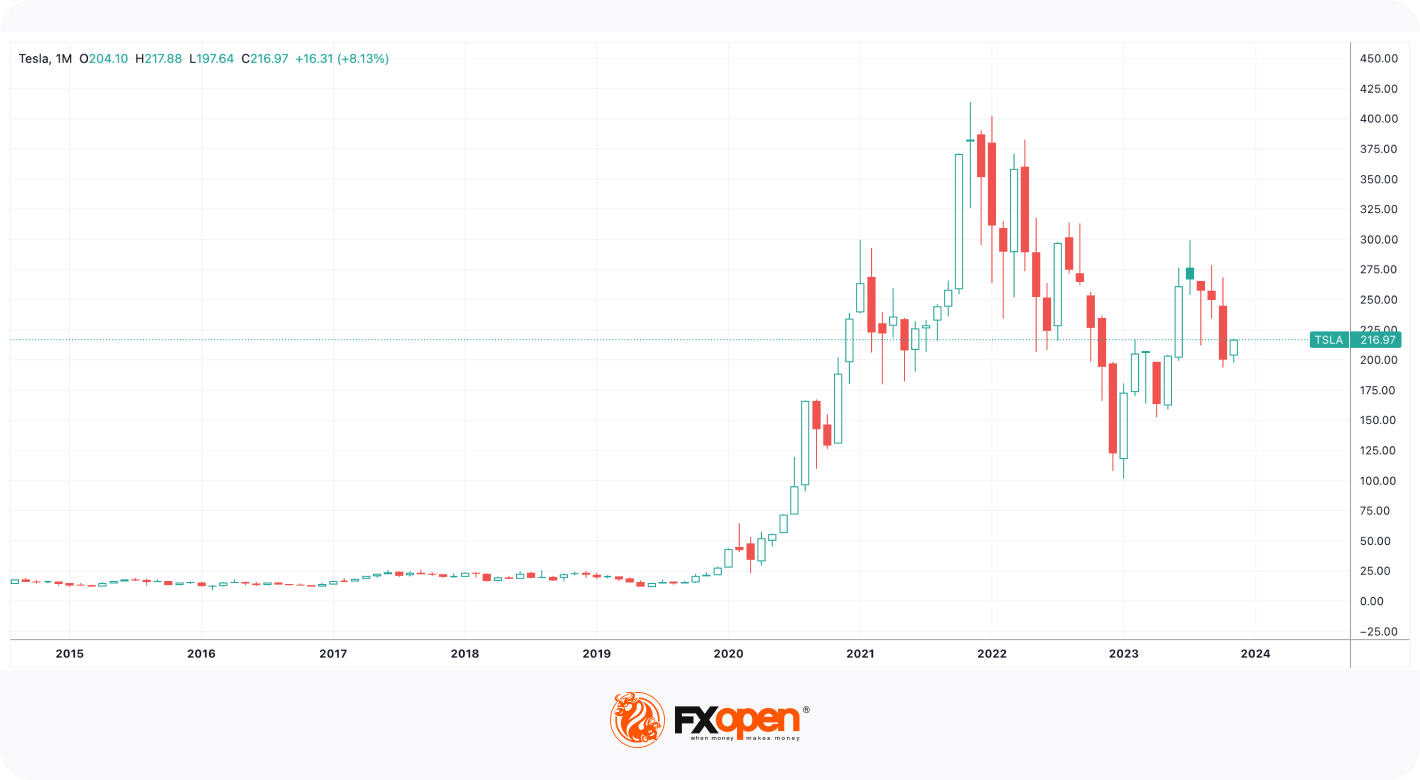
Candlesticks
Candlesticks are financial charts used to represent price movement in stocks, currencies, or other assets over a specific period. They provide visual information about price direction, open, close, high, and low prices, trend strength, and market sentiment, helping traders analyse and make informed trading decisions. You can easily recognise stock market patterns on this chart type.
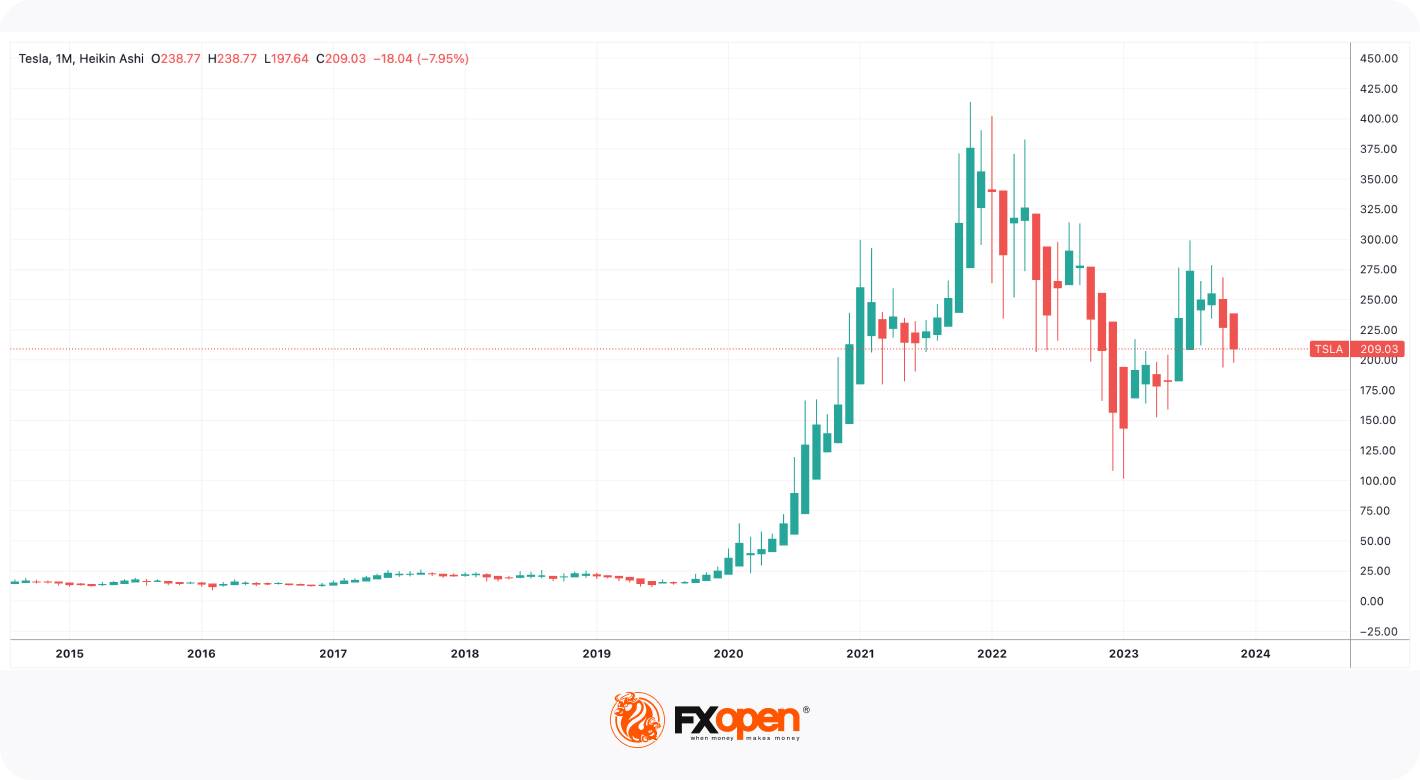
Heikin Ashi
The Heikin Ashi is a financial chart used to analyse price trends and trend reversals in stocks, forex, and other assets. It employs a modified formula for calculating the open, high, low, and close prices of each period, making it easier for traders to identify the overall trend direction and potential reversal points.
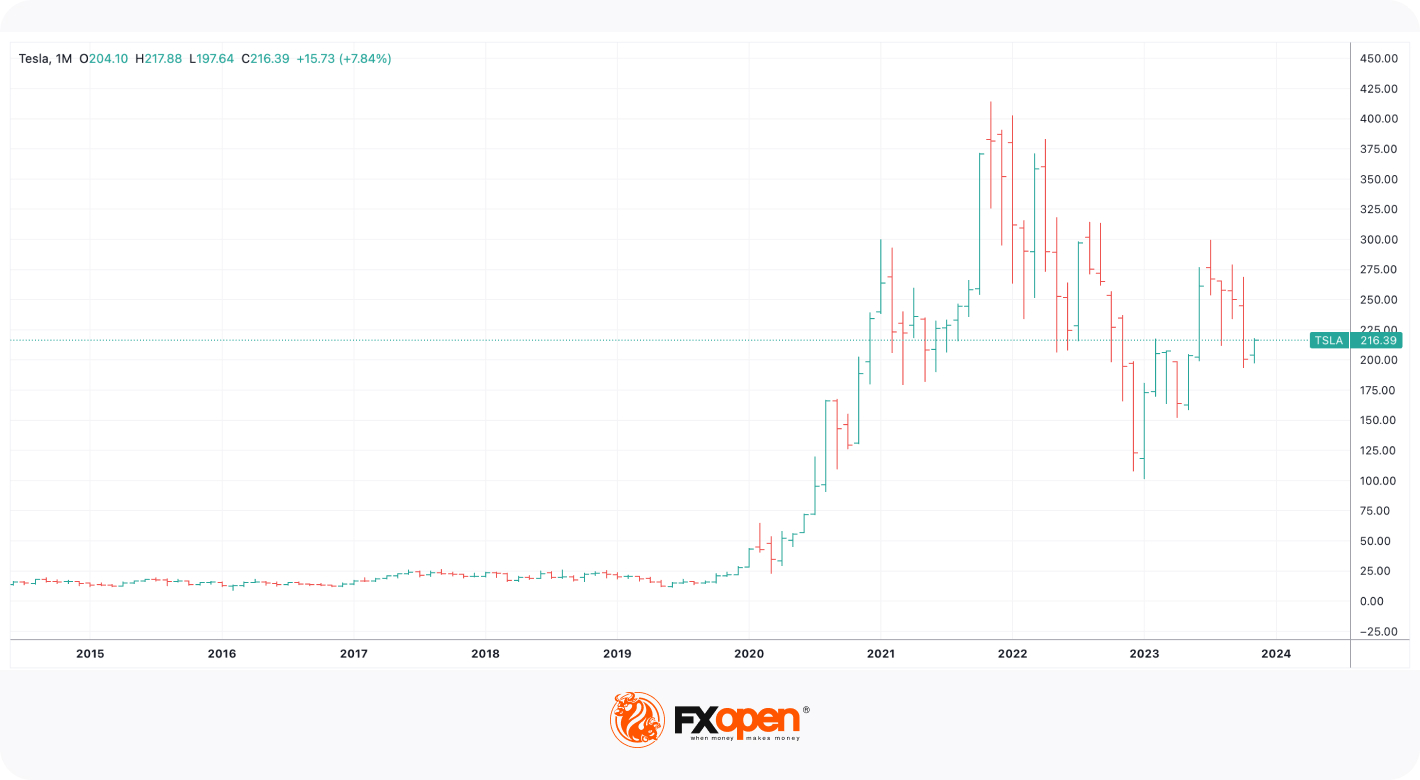
Bars
Bars display numerical data through vertical or horizontal lines. They do well in presenting data grouped into distinct categories and enable quick visual analysis of trends and comparisons in data sets.
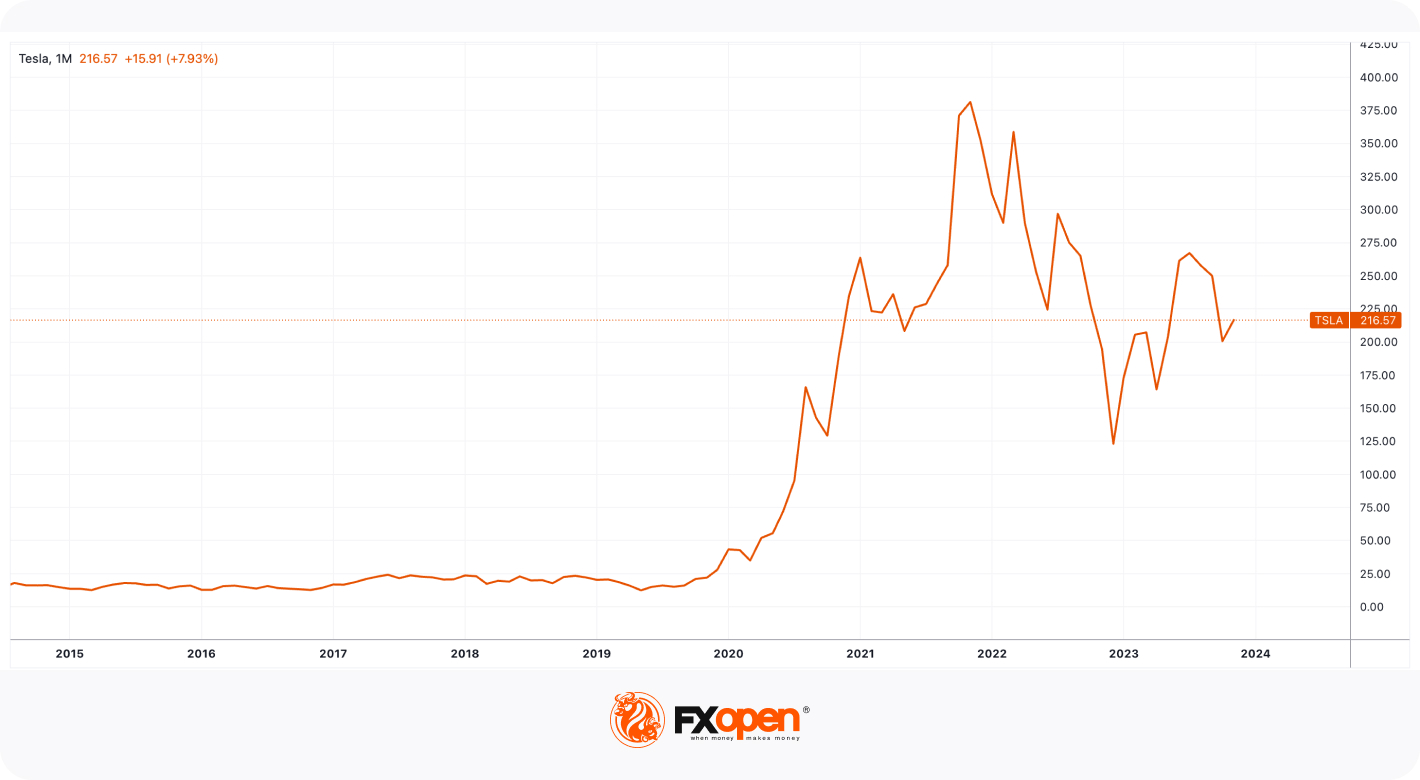
Lines
A line chart is commonly used to show the trend or pattern of data over time or any other continuous variable. They are particularly useful in analysing relationships between presented data and making predictions based on historical data. Line charts are widely used for stock chart analysis.
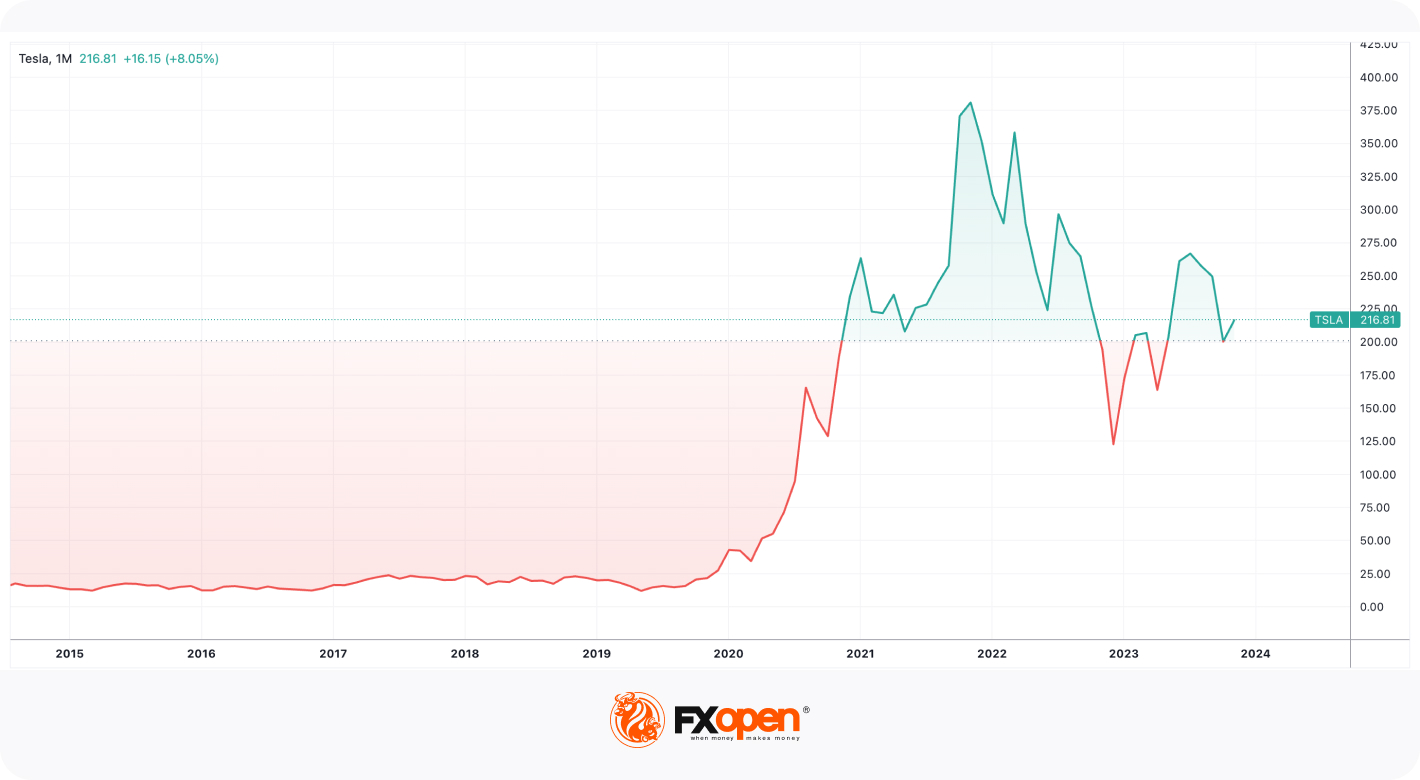
Baseline
For traders who want to focus on support and resistance levels, the baseline chart is an ideal choice. It's the perfect chart for highlighting changes in price from a specific baseline level.
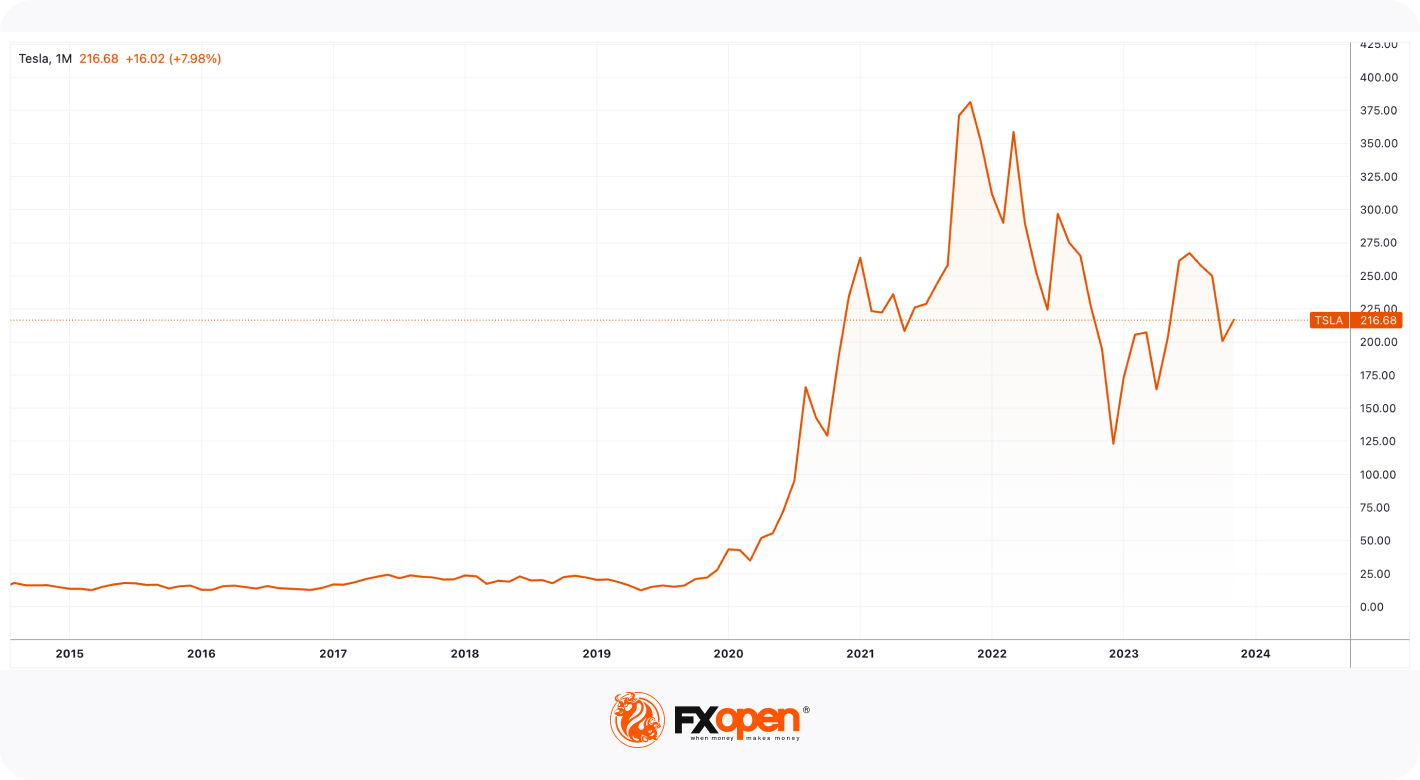
Area
This chart displays data as an area under a curve on a graph. It is created by connecting data points with straight lines and then filling the area between the line and the x-axis or y-axis (depending on the orientation of the chart). Areas are often used to track changes in data over time, compare multiple data sets or categories, and illustrate trends in data that fluctuate often.
Hollow Candles
Hollow candles offer a good overview of price changes. They're similar to candlesticks but put even more emphasis on price movements. This makes them really helpful for monitoring changes over time. You can find the most popular chart patterns on Hollow сandles.
If you want to test any of these types, you can try FXOpen's TickTrader trading platform.
How to Choose the Right Chart
Using the right type makes it easier to spot trends and patterns and make more effective trading decisions. Traders usually go with candlesticks, bars, and lines; however, your choice may differ. Here are some insights into how to choose your perfect option:
Understand Your Trading Goals
Traders consider their trading goals before opting for a specific chart. An example is candlesticks, which are suitable for short-term traders as they provide detailed information about price movements and patterns. Some medium- to long-term traders prefer the Heikin Ashi chart because it reduces market noise and can be equally effective in technical analysis.
Data Type
Trading charts primarily display two types of information: price data and volume data.
- Price Data: This data type represents the price of the asset being traded, such as a stock, currency pair, or commodity. It includes open, high, low, and close (OHLC) prices for each time period displayed on the chart. The OHLC data is used to create candlestick charts or bar charts, providing insights into price movements.
- Volume Data: Volume data represents the number of shares, contracts, or units traded during each time period. It is usually displayed as a histogram or a separate graph below the price chart. Volume can help traders gauge the level of interest and participation in the market.
Time Frame
The choice of the time frame used for analysis may impact your decision-making process. Patterns may look different on shorter time frames, like minutes, compared to longer timeframes, such as daily or weekly. If you trade over longer periods, lines and Heikin Ashi may be more effective for the analysis of a long-term trend, while for short-term trading, you may stick to candlesticks.
Asset Class
The characteristics and behaviours of different asset classes can affect the formation and interpretation of chart patterns in several ways. Asset classes can vary significantly in terms of volatility and liquidity. A highly liquid and volatile asset class like stocks may exhibit shorter-term and more frequent chart patterns; therefore, stock traders widely use candlestick charts.
How to Use Different Chart Types
Selecting the right chart is key to making effective financial decisions, but the way you use it may also impact the effectiveness of your trading choices.
Market Analysis
Different chart types might work better with certain indicators and strategies. Discover the technical indicators and analysis methods to be used (like moving averages, RSI, and MACD) on the TickTrader platform. Candlesticks are suitable for technical analysis, especially for identifying patterns in trading charts. Lines are handy when it comes to simple trend analysis. They provide a clear view of price trends, making them suitable for basic trend analysis and trendline drawing.
Customisation
Take note of customisation options when choosing a chart. Ensure it fits your trading needs. See if the chart allows for adjusting time frames, adding indicators, and using tools for drawing trendlines if required. If you prefer technical trading chart patterns, you will need a chart type that allows you to spot them easily, for example, candles, hollow candles, and Heikin Ashi.
If you want to check the most effective stock market chart patterns, read our article.
Risk Management
Make sure the chart supports smart risk management strategies, like stop-loss orders, take-profit orders, and position sizing. These strategies help protect trading capital.
Final Words
It's important for traders to be aware of the different types of charts. They're powerful tools for analysing price movements, spotting trends, and making informed trading decisions.
When traders can read and use different market data effectively, they'll have a better grip on how the market works. This can help them trade more wisely. You can open an FXOpen account to explore various charts and discover which ones work best for you.
This article represents the opinion of the Companies operating under the FXOpen brand only. It is not to be construed as an offer, solicitation, or recommendation with respect to products and services provided by the Companies operating under the FXOpen brand, nor is it to be considered financial advice.
Stay ahead of the market!
Subscribe now to our mailing list and receive the latest market news and insights delivered directly to your inbox.


Latest articles

Ethereum: Has the Recovery Begun?
Ethereum has staged a notable rebound after once again testing the heavily watched psychological zone around 1500$. Since bouncing off this support, ETH/USD has climbed roughly 13%, now trading around the $1,700 mark.
This recovery is being driven

Oil Prices Are Back at Pre-Conflict Levels. Analysts Are Divided
At the start of May, oil markets were still pricing in elevated geopolitical risk and expectations of sustained supply disruption.
But easing tensions between Washington and Tehran, along with improving supply expectations, have rapidly shifted sentiment back toward fundamentals.
📉 Brent

The Dollar Awaits the Week’s Key Report: AUD/USD and NZD/USD at Crucial Technical Levels
Following mixed performance by the US dollar earlier this week, investors are now fully focused on the June Nonfarm Payrolls report, which will be released on Thursday rather than Friday. The schedule has been brought forward as US financial markets